
Abstract
Vaccinations are considered the major tool to curb the current SARS-CoV-2 pandemic. A randomized placebo-controlled trial of the BNT162b2 vaccine has demonstrated a 95% efficacy in preventing COVID-19 disease. These results are now corroborated with statistical analyses of real-world vaccination rollouts, but resolving vaccine effectiveness across demographic groups is challenging. Here, applying a multivariable logistic regression analysis approach to a large patient-level dataset, including SARS-CoV-2 tests, vaccine inoculations and personalized demographics, we model vaccine effectiveness at daily resolution and its interaction with sex, age and comorbidities. Vaccine effectiveness gradually increased post day 12 of inoculation, then plateaued, around 35 days, reaching 91.2% [CI 88.8%-93.1%] for all infections and 99.3% [CI 95.3%-99.9%] for symptomatic infections. Effectiveness was uniform for men and women yet declined mildly but significantly with age and for patients with specific chronic comorbidities, most notably type 2 diabetes. Quantifying real-world vaccine effectiveness, including both biological and behavioral effects, our analysis provides initial measurement of vaccine effectiveness across demographic groups.
Introduction
The mRNA-based BNT162b2 COVID-19 vaccine has demonstrated a 95% efficacy in preventing COVID-19 in phase III randomized placebo-controlled trial, with early protection from the disease evident already 12 days after the first dose1. Despite the benefits of a controlled trial, it is limited in resolution due to restrictions during the recruitment process and the relatively small sample size. For example, the phase III trial did not allow the participation of immunosuppressed patients, or patients with unstable chronic conditions2. The rapid national vaccination rollout in Israel provides an opportunity to test the effectiveness of the vaccine in real-world prevention of SARS-CoV-2 infection and disease across a diverse population. However, estimating the real-world effectiveness of the vaccine is challenging due to strong temporal and spatial epidemic patterns, and association of testing with vaccination.
Several approaches have been applied to tackle these challenges. First, comparing the infection incidence for the vaccinated population starting at the early protection period with incidence during the first 11 days after the first dose, when patients are not yet protected, has identified an effectiveness of over 50% in later days3. Models accounting for disease dynamics in the general population suggest a 66-85% reduction in infections with over 90% reduction in severe hospitalizations4. In a different effort, leveraging known associations of vaccination with population characteristics such as age and geographical location, population-wide associations of infection incidence and hospitalizations with vaccination rates were identified5. Finally, a comprehensive comparison of infection and disease incidences between a vaccinated population and a demographically and clinically matched unvaccinated control group has yielded an estimation of effectiveness similar to the randomized-control trial, and showed a reduction in vaccine effectiveness in patients with comorbidities6. Yet, quantifying the association of vaccine effectiveness with multiple patient-specific attributes and resolving behavioral versus biological effects, while controlling for patient demographics and the dynamically varying volume of the epidemic, remains challenging. Indeed, vaccinated and unvaccinated patients could also differ in their rate of testing. In recent years, machine-learning based approaches have become powerful in quantifying vaccine effectiveness in reducing infections per-test while accounting for confounding variables7–10. Here, generalizing these approaches, we build a multivariable logistic regression analysis for both per-day and per-test infections, that allows us to calculate infection risk for different post-vaccination time ranges, while adjusting for spatial and temporal patterns of the epidemic and for patient-specific characteristics such as age, sex and comorbidities. Adding interaction terms of time from vaccination with sex, age and comorbidities, we further resolve the associaitons of these patient attributes with vaccine effectiveness. Applying this methodology on infections observed either per-day or per test, and comparing associations at later times following vaccination with associations observed at early days, before any presumed immunological protection, help us to further resolve behavioral and biological effects of the vaccine.
Results
Between 19th of December 2020 and February 25th 2021, Maccabi Healthcare Services (MHS) has vaccinated more than 1.2 million out of almost 1.8 million of its 16 years old and older population, as part of a national rapid rollout of the vaccine. We collected, for each member of MHS, anonymized data including vaccination dates, results of any oral-nasopharyngeal SARS-CoV-2 tests, age, sex, and city of residence, as well as tagging of comorbidities including: cardiovascular disease, type 2 diabetes, high blood pressure, immunosuppression, chronic kidney disease (CKD) and chronic obstructive pulmonary disease (COPD, Methods). We then performed a logistic regression analysis on a gigantic matrix where each line (“observation”) corresponds to a given person at a given calendar day (67 calendar days, over 120 million observations). The outcome of each of these observations indicates whether or not the specific person had a positive test at the specific calendar day (0/1). The features include the calendar day, vaccinated versus unvaccinated, the number of days post-vaccination and patient-specific characteristics including sex, age, place of residence, and patient’s comorbidities. Finally, to characterize vaccine effectiveness, we also included interaction terms of age, sex and comorbidities with vaccination for three distinct post-inoculation time periods (1-11, 12-28, 29-50 days; Methods). We consider two models, one that includes all 67 calendar days for each patient (thereby predicting the “per-day” risk of a positive test result) and the other that includes for each patient only the calendar days in which they were tested (thereby predicting the “per-test” risk of a positive test result).
The odds ratio of infection for different days following vaccination, compared to unvaccinated reference, showed a gradual decrease in infection rate starting at day 12, ultimately plateauing, following 35 days post first inoculation, at levels of approximately 91% for the per-test model and 95% for the per-day model. The model coefficients for post-vaccination days provide the odds ratios for infection relative to an unvaccinated reference (Fig. 1). In the per-day model, we observed an initial negative association of infections with vaccination at days 1-5, coinciding with a decrease in tests on these initial post-inoculation days (Supplementary Fig. 1, presumably due to a behavioral tendency to avoid testing immediately following vaccination). Consistent with the phase III placebo-controlled trial, an initial decrease in infection rate is observed at day 12. These rates further decrease until a plateau is reached following 35 days post-inoculation at levels of 95.2% (CI 93.9%-96.2%) for days 44-50. Vaccinated individuals are not required to get tested for epidemiological reasons (e.g. after contact with a COVID-19 patient). Therefore, effectiveness at later days may be overestimated. To alleviate this potential bias, we used the per-test model, considering the risk of infection per test. We found an initial apparent effectiveness already in days 1-11 (green period), explained by a time-independent (existing even prior to vaccination) positive association of the vaccinated group with testing (Supplementary Fig. 1; likely due to association with access and tendency for treatment). Focusing on later days (orange and red periods), vaccine effectiveness gradually increased, reaching a plateau at a slightly lower effectiveness of 91.2% (CI: 88.8%-93.1%).
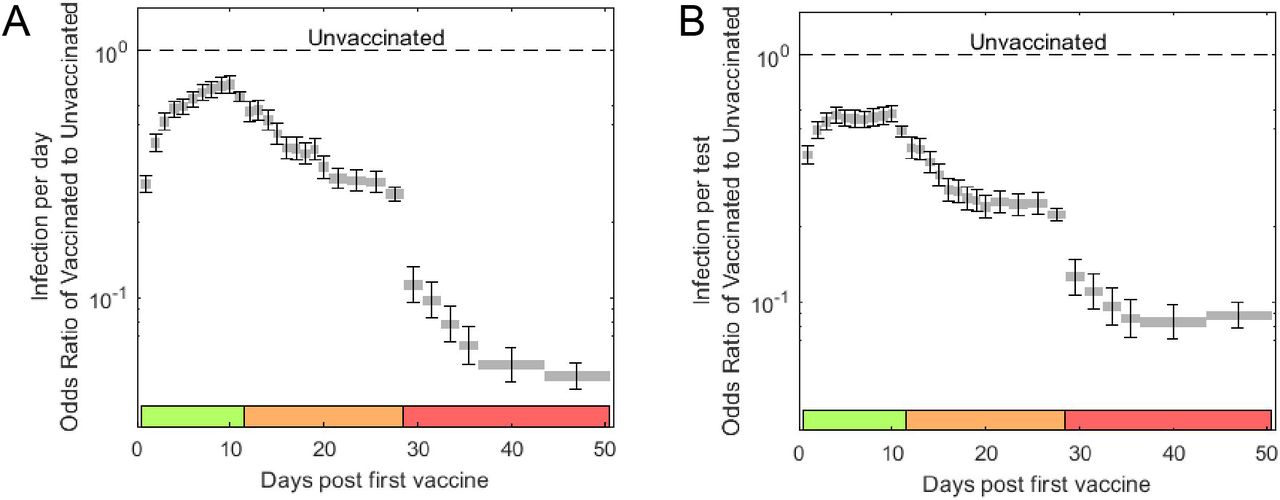
Odds ratio for per-day (a) and per-test (b) infections of vaccinated to unvaccinated, for different days post-vaccination. Error bars indicate one standard error of the corresponding logistic regression coefficients.
We next asked whether and to what extent vaccination effectiveness might vary across demographic characteristics and whether it may be associated with certain patient comorbidities. We considered the coefficients for interactions of sex, age and comorbidities with 3 distinct post-vaccination time ranges: 12-28 and 29-50 days, as well as with days 1-11 as a pre-immunization control period (where vaccination is not presumed to have a biological effect). In both the per-day and per-test models, the odds ratio of vaccine effectiveness with sex, age, and any of the comorbidities considered was at most two-fold, indicating that the vaccine remains effective across demographics and comorbidities (Fig. 2). For sex, vaccine effectiveness for men and women was highly similar (Odds ratio for male versus female of 1.20 [CI: 1.05-1.37] for per-day and 1.15 [CI: 1.00-1.32] for per-test infections). For age, considering the per-day model (incidence rate), vaccine effectiveness seemingly declined at older age (80-90 age group), yet similar associations also appeared for this age group in the pre-immunization period (Fig. 2a, top, green), suggesting an underlying behavioral effect (pre-existing tendency for increased testing in vaccinated versus unvaccinated patients was indeed amplified for older patients, Supplementary Fig. 1). Correcting for this effect, the per-test model diminished the interaction of age with vaccine, revealing a mild but significant decrease in vaccine effectiveness with age at the post-immunization periods (days 29-50, Odds ratio 0.68 [CI: 0.51-0.91] for 80-90 years old versus 1.23 [CI: 0.89-1.70] for 16-30 years old). For comorbidities, considering the per-day model, blood pressure, COPD, immunosuppression and type 2 diabetes reduce vaccine efficacy, yet they also interact, to a lesser extent, with vaccination at the control pre-immunization time period (Fig. 2b, top). In the per-test model, a reduction in vaccination effectiveness is seen uniquely for the later, post-immunization, time periods (Fig. 2b, bottom, days 29-50; Odds ratio 0.72, [CI: 0.60-0.86] for type 2 diabetes; 0.55 [CI: 0.46-0.66] for immunosuppression and 0.61 [CI: 0.45-0.82] for COPD).

Odds ratio of vaccine effectiveness for per-day (top) and per-test (bottom) infections, for age (a) and comorbidities (b) for three post-vaccination time periods: 1-11 (green), 12-28 (orange) and 29-50 days (red). Error bars indicate one standard error of the corresponding logistic regression coefficients. * p<0.05, ** p<0.01, *** p<0.001.
Vaccine was even more effective in preventing symptomatic infections. A subset of the tests had an associated physician referral indicating symptoms (referrals are not required and were usually not issued; only 2.2% of the tests had an associated referral which also indicated symptoms). We repeated the logistic regressions with the same features as above, but when limiting to tests with symptomatic referrals (Fig. 3). Vaccine protection against symptomatic infections was higher than the effectiveness observed for all infections both when considering risk of infection per day (effectiveness in days 44-50 post-vaccination was 99.5% [CI: 97.2%-99.9%] for symptomatic infections versus 95.2% [CI: 93.9%-96.2%] for all infections) and per test (99.3% [CI: 95.3%-99.9%] versus 91.2% [CI: 88.8%-93.1%]).

Per-day (a) and per-test (b) risk of all (solid bars) and symptomatic (hashed bars) infections at days 11 (green, before immunity control), 27-28 (orange) and 44-50 (red) post first vaccine inoculation.
Discussion
Our study has several limitations characteristic of observational studies. First, our data reflects uncontrolled non-random testing and non-random vaccination, both potentially biased across the population. Second, the vaccinated population may differ from the unvaccinated population in its general health status, in its risk of being infected and in its health-seeking behavior. These differences may be both inherent, pre-existing even prior to vaccination, and time-dependent as a result of vaccination itself. Third, during the study period, several viral variants were circulating in Israel. Although the vaccine is expected to be potent against B.1.1.711, which was the most common one12, it is possible that additional variants introduced biases to our estimations of effectiveness across subpopulations, especially if vaccinated at different phases of the epidemic. We address differences in behavior by using the per-test model, which adjusts for differences in the tendency to get tested9, while also comparing the associations identified for the immunization period (after day 28) with those identified in the pre-immunization period for the same population. Yet, behavioral differences which themselves vary with post-vaccination time are harder to correct for. These potential biases are also somewhat minimized due to the rapid pace of freely offered vaccination, together with laboratory results which are also offered free of charge to all members. The high disease rate during the study period also makes this dataset suited for analysis, especially as we consider calenderic dates to account for the dynamics of the epidemic wave.
Our analysis of the Pfizer BNT162b2 vaccination and infection records identifies an onset of infection prevention effectiveness at 12 days after the first-inoculation in a two-dose vaccine regimen, gradually increasing till a plateau at 91.2% [CI 88.8%-93.1%] for all infections and 99.3% [CI 95.3%-99.9%] for symptomatic infections. While the effectiveness against symptomatic infections is slightly higher than the efficacy reported in the clinical trial, providing daily time resolution, our analysis reveals that these high levels of vaccine effectiveness are only fully reached following day 35, in agreement with the expected period of two weeks after the second dose 13. Vaccine effectiveness was almost the same for males and females. Comparing effectiveness across age groups, we find that although vaccine effectiveness is relatively similar for age groups between 16-80 years old, a statistically significant lower effectiveness is observed for older patients. We also find that specific chronic comorbidities, including high blood pressure, COPD, immunosuppression and type 2 diabetes, are negatively associated with vaccine efficacy. These results add to previous reports regarding lower vaccine effectiveness for diabetic patients3 and patients with multiple coexisting conditions6. Our methodology provides a unified framework for analyzing vaccine effectiveness and its dependence on patient’s attributes from dynamic spatially distributed datasets.
Methods
Data collection
Anonymized electronic health records were retrieved for the study period December 1st 2020 - February 25th 2021 for all individuals older than 16 (1.79 million). These records include: (a) Patient demographics, indicating for each MHS member: a random ID used to link records, year of birth, sex, coded geographical location of residence at neighborhood resolution, and chronic comorbidities including: cardiovascular disease, type 2 diabetes, high blood pressure, immunosuppression, chronic kidney disease (CKD) and chronic obstructive pulmonary disease (COPD). (b) Test results, indicating for any SARS-CoV-2 RT-qPCR test performed for MHS members: the patient random ID, the sample date, and an indication of positive and negative results (total 1,163,799 tests, with 66,944 positive results). (c) Referral for SARS-CoV-2 test, indicating the patient random ID, the referral date and a reason for referral (83,714 referrals, 26,095 of which indicated symptomatic infection; most tests are performed without a referral). (d) Vaccination, indicating patient by random ID and their dates of first and second inoculations with the BNT162b2 mRNA COVID-19 (1.27 million vaccinees). We excluded from the study patients who had any one of the following indications: (a) a positive test prior to the study period, (b) more than 20 tests since March 2020 (to avoid patients participating in extensive surveys), (c) age above 90 or below 16.
Per-day multivariable logistic regression model for infection
We performed a logistic regression for the risk of a positive test for each patient in each calendar day. Given 1.79 million patients, and 67 calendar dates (Dec 20 - Feb 25), we have >120 million patient-cross-date observations (PxD, or number of lines in the logistic regression input matrix). For each PxD, the predicted variable is Y=0/1, indicating whether the specific patient had a positive result on the specific calendar date (1 - positive test, 0 - no test or a negative test). The features for each PxD observation (the “X” matrix) include: (a) Sex (0/1, Female/Male), (b) Age (length-6 dummy-variable vector designating 0/1 for age bins: 16-30, 31-40, [41-50], 51-60, 61-70, 71-80 and 81-90, with the [41-50] variable omitted such that all-zeros indicates this age bin as the reference), (c) comorbidities (length-6 binary vector indicating absence/presence of each comorbidity), (d) calendar date and neighborhood of residence (target encoding) and (e) post-vaccination time, encoded as post-vaccination period (PVP), and post-vaccination day (PVD). The PVP is a length-3 dummy-variable vector designating 0/1 for periods 1-11, 12-28, 29-59 days post first-dose inoculation (corresponding to the green, orange and red periods in Figures 1-3), with [0,0,0] indicating unvaccinated patients or patients at dates prior to their first-dose inoculation. The PVD is a dummy-variable vector representing post-inoculation days 1, 2, 3, 4, 5, 6, 7, 8, 9, 10, [11], 12, 13, 14, 15, 16, 17, 18, 19, 20, 21, 22, 23-24, 25-26, [27-28], 29-30, 31-32, 33-34, 35-36, 37-43, [44-50]. To avoid over-parameterization due to dependency among PVD and PVP, the last bins of PVD in each of the three periods (bins [11], [27-28], and [44-50]) are omitted, such that PVD is a length-28 binary vector and all-zero represents the first day of the period indicated by PVP (or unvaccinated if PVP is also all-zeros). This coding of post-vaccination day into period and days within the period allows quantifying interactions of Sex, Age and Comorbidities with vaccination, by including the interaction terms: Sex*PVP (length-3 binary vector), Age*PVP (length-18 binary vector), and Comorbidities*PVP (length-18 binary vector). Together, the model includes 83 features. In practice, to allow faster computation and to fit the data within a reasonable computer memory, only unique lines of this matrix are stored and, for each such unique line, the total number of PxD’s (or PxD’s with a test) and total positive result are calculated. The model is then solved in Matlab with the glmfit function.
Per-test multivariable logistic regression model for infection
Starting with the feature matrix and outcome described above, we omitted all PxD lines at which a test was not performed (namely keeping for each patient only observations on dates in which they were tested). We then performed the logistic regression as above on this trimmed input matrix. The model thereby calculates the probability for a positive result given that a patient had performed a test on a given date.
Regression model for rate of testing
We repeated the logistic regression with the full PxD input matrix, with the following changes: (a) the outcome Y specifying whether or not a test was performed for the patient at the specific date (0/1); (b) adding PVD bins corresponding to negative times (days prior to vaccination); (c) excluded PVD of patients with times prior to the most negative time bin, such that the unvaccinated control does not include patients at dates prior to vaccination; (d) ran the model separately on each age group. The results of this model, predicting the probability of testing rather than the test result, are presented in Supplementary Figure 1.
Model interpretation
Odds ratio for infection following vaccination (Fig. 1) were calculated as  , where
  and
and  are the regression coefficients of the model for the post-vaccination period i and post-vaccination day j (except substituting
  for j corresponding to the reference post-vaccination days 11, 27-28, or 44-50). For example, the odds ratio of infection in day 38 post-vaccination is
  , and for day 27, which is in bin 27-28 which is a reference bin for period 12-28, the odds ratio is
  . The effect of comorbidities on vaccine effectiveness was calculated as
  , where k designates one of the 6 comorbidities and i designates one of the 3 post-vaccination periods (green, orange, red; Fig. 2, bottom). Similarly, the effect of Age on vaccine effectiveness was calculated as
  , where k designates one of the 6 age bins and i designates one of the 3 post-vaccination periods (green, orange, red; Fig. 2, top). Finally, the effect of Sex on vaccine effectiveness for each of the 3 post-vaccination time periods was calculated as
  .
.
Ethics committee approval
The study protocol was approved by the ethics committee of Maccabi Healthcare Services, Tel-Aviv, Israel. The IRB includes an exempt from informed consent.
References


