
Abstract
The pandemic of the coronavirus disease 2019 (COVID-19) has become a global public health crisis. COVID-19 is marked by its rapid progression from mild to severe conditions, particularly in the absence of adequate medical care. However, the physiological changes associated with COVID-19 are barely understood. In this study, we performed untargeted metabolomic and lipidomic analyses of plasma from a cohort of COVID-19 patients who had experienced different symptoms. We found the metabolite and lipid alterations exhibit apparent correlation with the course of disease in these COVID-19 patients, indicating that the development of COVID-19 affected patient metabolism. Moreover, many of the metabolite and lipid alterations, particularly ones associated with hepatic functions, have been found to align with the progress and severity of COVID-19. This work provides valuable knowledge about blood biomarkers associated with COVID-19 and potential therapeutic targets, and presents important resource for further studies of COVID-19 pathogenesis.
Introduction
The outbreak of COVID-19, which emerged from Wuhan, China since December 2019, has rapidly spread to almost every corners of the world and been declared a pandemic by the World Health Organization (WHO). Up to the date of March 31, 2020, there are over 750,000 confirmed COVID-19 cases and about 36,000 deaths worldwide according to the situation report of WHO. Based on a recent study of 44,672 confirmed COVID-19 cases up to February 11 by Chinese Center for Disease Control and Prevention, over 19% COVID-19 patients developed severe or critical conditions (1). The global fatality rate is around 4.8% in all the confirmed cases until March 31, and has even reached 10% in some developed countries probably due to a more elderly population (2).
The main attacking organ of COVID-19 is lung, and some patients develop life-threatening acute respiratory distress syndrome (ARDS). Besides, the attacks of liver, muscle, gastrointestinal tract, lymph node, and heart by COVID-19 have also been found or proposed (3-6). On the other hand, although more than 80% COVID-19 patients experienced only mild symptoms, it has been found that the conditions can rapidly progress from mild to severe ones, particularly in the absence of adequate medical care. Moreover, the mortality rate of COVID-19 in critically ill cases can be over 60%, posing great pressure on treatment (7). However, the physiological changes associated with COVID-19 under different symptomatic conditions are barely understood.
Metabolites and lipids are major molecular constituents in human plasma. During critical illness, metabolic and lipid abnormalities are commonly observed, which are believed to contribute to physiology and pathology. Moreover, previous studies have demonstrated dramatic alterations of metabolome and lipidome in human plasma caused by various diseases including viral infections, such as Ebola virus disease (8, 9). Here, we performed the untargeted metabolomic and lipidomic profilings of plasma samples collected from a cohort of COVID-19 patients, including COVID-19 fatalities and survivors recovered from mild or severe symptoms. Our findings here show many of the metabolite and lipid alterations, particularly ones associated with hepatic functions, align with the progress and severity of the disease, which would provide valuable knowledge about blood biomarkers associated with COVID-19 as well as potential therapeutic targets, and shed light into the pathogenesis of COVID-19.
Results
Study design and patients
Blood samples were collected at Wuhan Jinyintan Hospital from COVID-19 patients with laboratory confirmed severe acute respiratory syndrome coronavirus 2 (SARS-CoV-2) infection. Serial samples were collected over the course of disease from 9 patients with fatal (F) outcome (F1-F4), 11 patients diagnosed as severe (S) symptoms (S1-S2), and 14 patients diagnosed as mild (M) symptoms (M1-M2) (Table S1). Of note, all the patients in the severe (S) and mild (M) groups had survived from COVID-19 and been discharged from hospital. F1 represents the first samples collected from the COVID-19 fatal patients, while F4 represents the last samples before additional samples could be collected. S1 or M1 represents the samples during the disease peak of the patients in the S or M group as being determined based on the Diagnosis and Treatment Protocol for Novel Coronavirus Pneumonia (6th edition) published by the National Health Commission of China (10), while S2 or M2 represents the last samples collected from patients in each group before their discharge from hospital. For comparison, the blood samples from 10 healthy volunteers were collected. Metabolites and lipids were extracted from the same plasma sample separated from the whole blood, and analyzed using liquid chromatography electrospray ionisation tandem mass spectrometry (LC-ESI-MS/MS) system. The orthogonal partial least-squares discriminant analysis (OPLS-DA) was used to discriminate metabolomics profiles between the groups of COVID-19 patients and healthy people (Figure S1-S4). In total, 431 metabolites and 698 lipids were identified and quantified, and both metabolome and lipidome showed dramatic alterations in the plasma of these COVID-19 patients (Table S2 and S3).
Plasma metabolomic alternations correspond to clinical symptoms of COVID-19
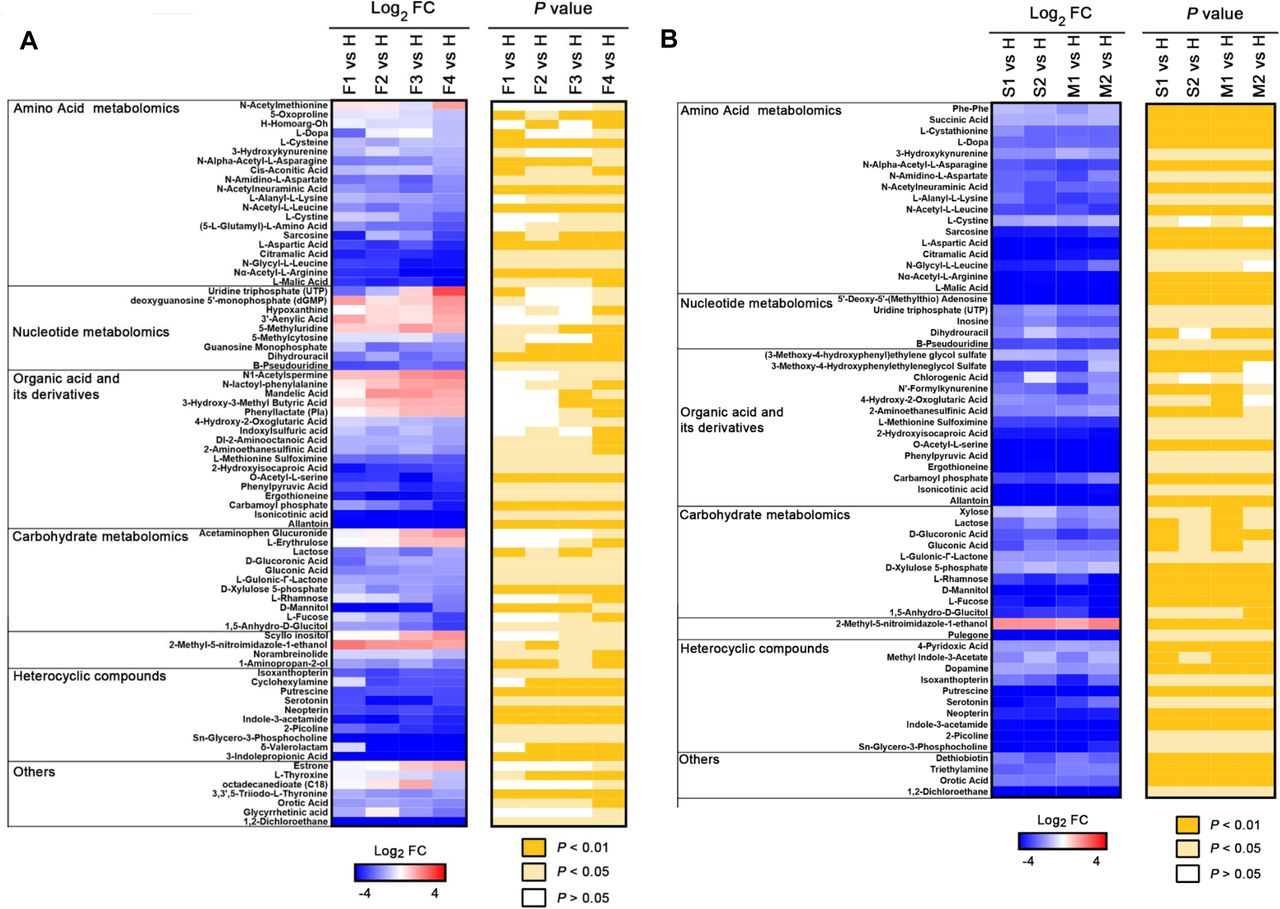
For different courses of fatal COVID-19 patients (F1-F4), we analyzed the metabolites that underwent significant change [F4 vs. H, >1 log2 fold change (FC) <-1, typically P <0.05]. For F vs. H, 87 of the total 431 metabolites were significantly different (P < 0.05) at F1, while the number of significantly altered metabolites were increased to 162 at F4 in the fatalities; and most of the changes are down-regulation (Table S2). We found a positive correlation between the alteration of metabolites and the course of disease deterioration in fatal patients (Figure 1A and Table S4), indicating that the development of disease affects the metabolism of metabolites. A prominent signature observed among fatal COVID-19 patients was an acute reduction of free amino acids in patient plasma over the course of COVID-19. For instance, L-Malic acid exhibited the greatest log2 FC (−5.2) among all significantly altered amino acids in the fatalities. These free amino acids are rapidly consumed in inflammatory states to provide energy and materials for the proliferation and phagocytosis of immune cells (11), indicating that immune system were activated in these cases.

Selected average plasma metabolite expression levels and associated p values for COVID-19 fatality patient group vs. healthy volunteer group (A), and severe or mild vs. healthy groups (B). F, fatalities, first, second, third and fourth samples, F1, F2, F3 and F4. S, severe patients, first and second samples, S1 and S2; M, mild patients, first and second samples, M1 and M2.
The changes in nucleotide and organic acid metabolisms of COVID-19 fatalities are complicated. We observed that the levels of some nucleotides and organic acids were significantly increased (e.g., hypoxanthine), whereas the levels of some nucleotides and organic acids were significantly reduced [e.g., Guanosine Monophosphate (GMP)]. Hypoxanthine-guanine phosphoribosyl transferase (HPRT) is an important enzyme involved in nucleotide recycle pathway and can covert hypoxanthine and guanine to inosine 5’-monophosphate (IMP) and GMP, respectively (12, 13). The observed abnormal levels of hypoxanthine and GMP suggested that the function of HPRT had become defective in these COVID-19 fatal patients, which could result in the disorders of purine and pyrimidine metabolism. In addition, we observed that the level of carbamoyl phosphate was significantly and gradually reduced over the course of COVID-19 fatalities. Carbamoyl phosphate is synthesized from free amino donors by carbamoyl phosphate synthetase I (CPSI) in mitochondria of liver cells, and participates in the urea cycle to remove excess ammonia and produce urea (14-17). Its reduction in fatal cases of COVID-19 suggests the possibility of liver damage, which could also impair amino acid metabolism.
We also profiled the metabolites in the different courses of severe and mild COVID-19 patients (S1 and S2; M1 and M2), and analyzed those that underwent the significant change [S1 vs. H, >1 log2 FC <-1, typically P <0.05; M1 vs. H, >1 log2 FC <-1, typically P <0.05] (Figure 1B and Table S5). There are apparently less metabolites with significant changes (>1 log2 FC <-1, typically P <0.05) observed in severe and mild patient groups when compared with those of fatal patients, and almost all the significantly altered metabolites were down-regulated. These results indicate that the alterations of metabolite metabolism were more dramatic in fatal COVID-19 cases than in severe and mild ones who finally survived.
In addition, it is noteworthy that although the patients in both severe and mild groups had met the hospital discharge criteria in the time points S2 and M2 as their COVID-19 nucleic acid tests turned negative twice consecutively, our metabolomic data clearly show that many of their metabolites had not returned to normal levels when compared with those in healthy volunteers (Figure 1B), indicating that these discharged patients had not been fully recovered from the impacts of this disease in physiology.
To further analyze the metabolomic data, the differentiated expressed metabolites (DEMs) were divided into those shared by all groups (F vs. H, S vs. H, and M vs. H) or those unique to the fatal group (F vs. H). Then, we performed Kyoto Encyclopedia of Genes and Genomes (KEGG) functional enrichment analysis to annotate the potential functional implication of these differently grouped DEMs (Figure 2). As shared by all the three symptomatic groups, DEMs were enriched in total 12 pathways and significantly enriched in 3 pathways including pyrimidine metabolism, fructose and mannose metabolism, and carbon metabolism (Figure 2A-B and Table S6).
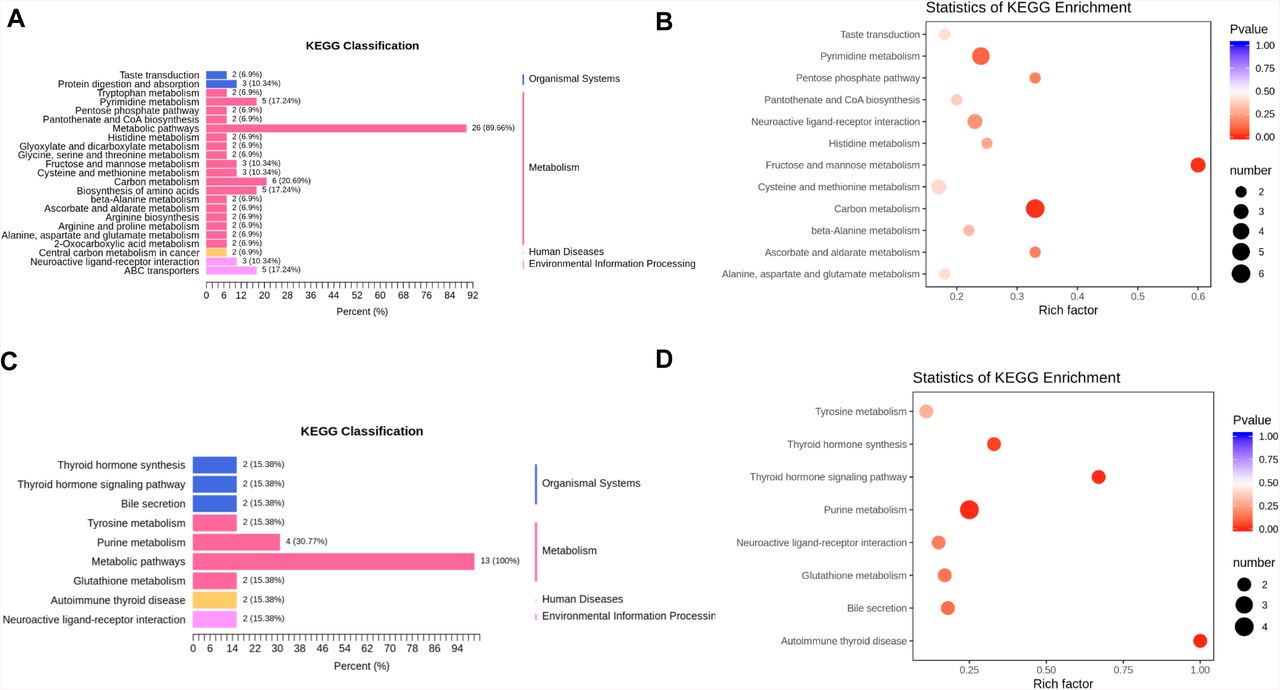
(A-B) KEGG pathway analysis of DEMs shared in all the groups. The color of bubbles represents the value of adjusted P value, and the size of bubbles represents the number of counts (sorted by gene ratio). (C-D) KEGG pathway analysis of DEMs shared unique to the fatal groups.
On the other hand, in the case of the fatality group, DEMs were significantly enriched in 4 pathways, including thyroid hormone synthesis, thyroid hormone signaling, purine metabolism, and autoimmune thyroid (Figure 2C-D and Table S7), suggesting that the alterations in these pathways are associated with the progress and deterioration of COVID-19.
Plasma lipidomic alternations correspond to clinical symptoms of COVID-19
We analyzed the lipids in different courses of fatal COVID-19 patients (F1-F4) that underwent significant change [F4 vs. H, >1 log2 FC <-1, typically P <0.05]. Most of the significantly changed lipids are up-regulated and a positive correlation between the alteration of lipids and the course of disease deterioration could be readily observed in the fatal patients (Figure 3A and Table S8). Lipid subclasses, DG, FAA, and TG, were identified in higher abundance in the fatality group (F vs. H), and the relative abundances of these lipids increased with the deterioration of the disease. Particularly, DG(16:0/20:2/0:0) exhibited the greatest log2 FC (+4.2) in DGs, and TG(14:0/22:1/22:3) exhibited the greatest log2 FC (+4.2) in all significantly altered TGs. The increases of DG, free fatty acid (FFA), and TG under pathological conditions have been previously reported. For instance, lipolysis of adipose tissue increases due to EBOV infection, which converts TG to FFA and DG, and also results in enhanced recycling of the fatty acids back into TGs (9).

Selected average plasma lipid expression levels and associated p values for COVID-19 fatality group vs. healthy volunteer group (A), and severe or mild vs. healthy groups (B). AA, arachidonic acid; BA, bile acid; CAR, carnitine; CE, cholesterol ester; Cer, ceramide; DG, diacylglycerides; TG, Triglycerides; FA, fatty acid; FFA, free fatty acids; LPA, lysophosphatidic acid; PC, phosphatidylcholine; LPC, lysophosphatidylcholine; PE, phosphatidylethanolamine; LPE, lysophosphatidyl ethanolamine; LPG, lysophosphatidylglycerol; PI, phosphatidylinositol; PS, phosphatidylserine; LPO, lipid peroxide.
Besides, we observed that PCs were gradually reduced over the course of COVID-19 fatalities. PCs are synthesized in the liver and are the only phospholipid necessary for lipoprotein (18); therefore, the COVID-19-associated decrease of PCs in the fatality group indicates hepatic impairments happened in the fatality group. Additionally, decreases in LPCs and PCs in blood plasma have been observed in sepsis, cancer, and Dengue infection (19-22).
We also analyzed the lipids in different courses of severe and mild COVID-19 patients (S1 and S2; M1 and M2) that underwent the significant change [S1 vs. H, >1 log2 FC <-1, typically P <0.05; M1 vs. H, >1 log2 FC <-1, typically P <0.05] (Figure 3B and Table S9). Similar to those of metabolites, the total numbers of significantly altered lipids (>1 log2 fold change (FC) <-1, typically P <0.05) in the severe and mild groups (S1 vs H, S2 vs H, M1 vs. H, and M2 vs H) were similar, which are significantly less than the number of altered lipids in the fatality group, indicating that the alterations of lipid metabolism were much more dramatic in fatal COVID-19 patients than in survivors. Besides, for either severe or mild groups of patients, many of their lipids had not returned to normal before their discharge from hospital (Figure 3B, S2 vs H and M2 vs H), even though SARS-CoV-2 could not be detected and the major clinical signs had disappeared in these patients based on official discharge criteria. Obviously, like the observations of metabolomic alterations, these discharged patients, no matter if they had experienced severe or mild symptoms, had not been fully recovered from the aftermath of COVID-19 in the aspects of both metabolite and lipid metabolisms.
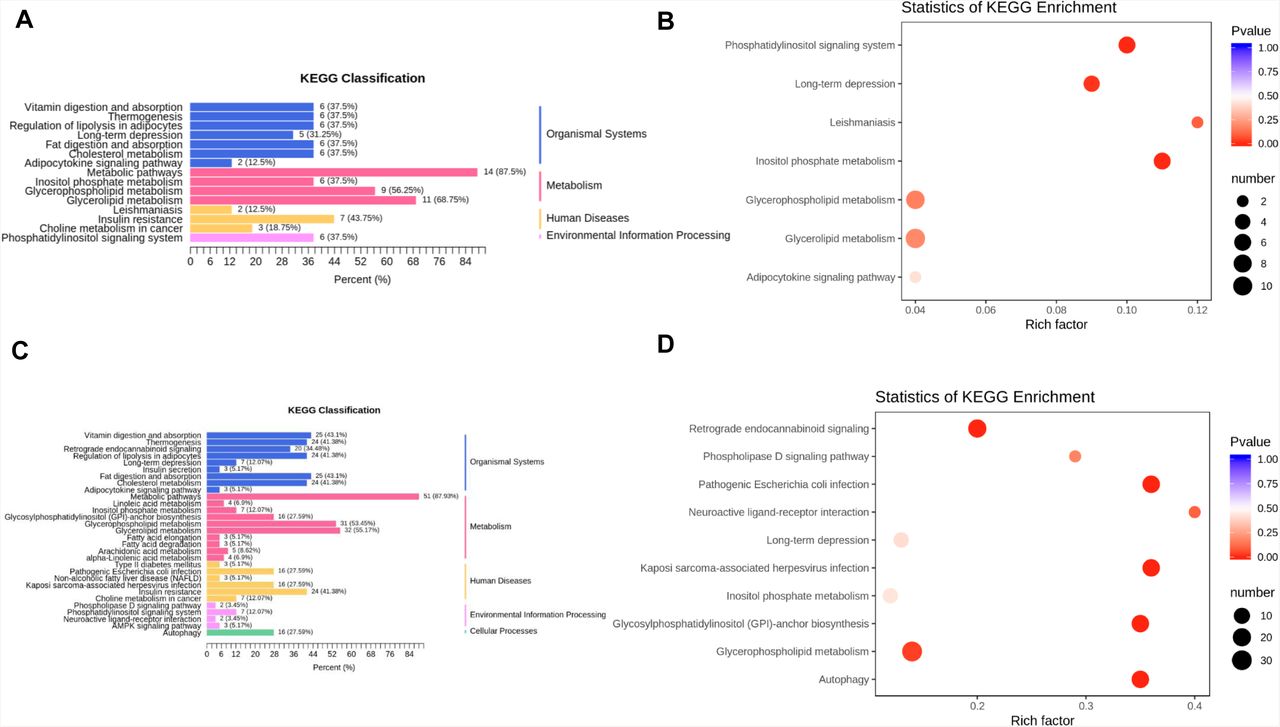
Furthermore, the differentiated expressed lipids (DEIs) were divided into those shared by all groups (F vs. H and S vs. H plus M vs. H) or those unique to the fatality group (F vs. H), and subsequently subjected to KEGG functional enrichment analysis. As shared by all the three symptomatic groups, DEIs were enriched in total 7 pathways and significantly enriched in 4 pathways, including phosphatidylinositol signaling system, long-term depression, leishmaniasis, and inositol phosphate metabolism (Figure 4A-B and Table S10). In the case of fatality group, DEIs were significantly enriched in 6 pathways, including retrograde endocannabinoid signaling, pathogenic Escherichia coli infection, Kaposi sarcoma-associated herpesvirus infection, glycosylphosphatidylinositol-anchor biosynthesis, glycerophospholipid metabolism and autophagy (Figure 4C-D and Table S11).

(A-B) KEGG pathway analysis of DEIs shared in all the groups. The color of bubbles represents the value of adjusted P value, and the size of bubbles represents the number of counts (sorted by gene ratio). (C-D) KEGG pathway analysis of DEIs shared unique to the fatal groups.
Biomarkers associated with COVID-19
We summarized 5 metabolites and 15 lipids altered significantly among COVID-19 patients and healthy people. All the 5 metabolites were significantly down-regulated in COVID-19 patient compared to those in healthy volunteers (Figure 5 and Table S12). On the other hand, 8 lipids were significantly down-regulated and 7 lipids were significantly up-regulated compared to those in the healthy group (Figure 6 and Table S12). Among them, L-malic acid and Glycerol 3-phosphate showed the greatest reduction when comparing the fatality patients with healthy volunteers, and also showed dramatic reduction in both severe and mild groups. L-malic acid has important physiological functions, as it can directly enter the circulation of tricarboxylic acid to participate in human metabolism. Besides, L-malic acid can accelerate metabolism of ammonia to lower ammonia concentration in liver and to protect liver (23, 24); therefore, the dramatic reduction of L-malic acid is consistent with the hepatic impairment associated with COVID-19. Moreover, L-malic acid has been found to protect endothelial cells of human blood vessels and resist damage to endothelial cells.

The normalized expression for each metabolite. Each dot represents a single patient sample, and each patient group is differently colored as indicated. F, fatalities; S, the patients with severe symptom; M, the patients with mild symptom; H, healthy volunteers. *P<0.05, *P<0.01.

The normalized expression for each lipid. Each dot represents a single patient sample, and each patient group is differently colored as indicated. F, fatalities; S, the patients with severe symptom; M, the patients with mild symptom; H, healthy volunteers. *P<0.05, **P<0.01.
D-Xylulose 5-phosphate (Xu-5-P) is a metabolite of the hexose monophosphate pathway that mediates glycolysis, as well as fatty acid and triglyceride synthesis. Xu-5-P is the coordinating signal that both activates phosphofructokinase in glycolysis and promotes transcription of the genes for lipogenesis, the hexose monophosphate shunt, and glycolysis, and is required for de novo synthesis of fat and hepatic energy utilization (25-28). The reduction of Xu-5-P indicates the downregulation of glycolysis and lipogenesis, which is also a reflection of hepatic impairment.
Carbamoyl phosphate is an important intermediate metabolite involved in removing excess ammonia in the urea cycle (14, 15). This metabolite is the downstream product of CPSI in mitochondria of liver cells. The observed downregulation of carbamoyl phosphate levels is associated with the severity of COVID-19, as its level in the mild patients were affected in the least extent. Importantly, the dramatic reduction of carbamoyl phosphate is usually associated with urea cycle disorder, raising the concern about the possibility of hyperammonemia and hyperammonemia-associated liver failure in COVID-19 patients.
Besides, the reductions of dihydrouracil, an intermediate breakdown product of uracil and GMP (29), are proposed to be caused by the defects of human metabolism. Glycerol-3-phosphate is a conserved three-carbon sugar and an obligatory component of energy-producing reactions including glycolysis and glycerolipid biosynthesis (30). Moreover, Glycerol-3-phosphate is an important mobile regulator of systemic acquired resistance, which provides broad spectrum systemic immunity in response to pathogenic infections (31). These metabolites and lipids show good correlation with the progress and severity of COVID-19, and can therefore serve as potential blood biomarkers for this disease.
Discussion
The main purpose of this study was to generate a high-quality resource of metabolomic and lipidomic datasets associated with COVID-19 to help understand the pathogenesis of COVID-19.
For these COVID-19 patients, the metabolisms of main amino acids, nucleotides, organic acids and carbohydrates were significantly decreased. Meanwhile, the lipids involved in glycerol metabolism pathway were upregulated, which maintain the balance of the energy metabolites of the body and are beneficial to the energy required for viral replication, suggesting that SARS-CoV-2 probably hijacks cellular metabolism like many other viruses (32). And we hypothesize that the course of COVID-19 is closely associated with the alternations of host pyrimidine metabolic, purine metabolic, and glycerol phospholipid metabolic pathways.
Importantly, many of the altered metabolites and lipids, including the proposed biomarkers L-malic acid, Xu-5-P, Carbamoyl phosphate, Glycerol-3-phosphate, PC, LPC, etc., correlate well with the progress and severity of COVID-19 and are closely associated with hepatic functions. Moreover, the downregulations of L-malic acid and Carbamoyl phosphate probably cause the abnormal accumulation of ammonia (i.e. hyperammonemia), which may in turn result in disease deterioration. In addition, the metabolisms of purine and thyroid hormones were significantly altered in the fatality group. Purine metabolism mainly occurs in human liver, and the thyroid hormone can affect hepatic protein synthesis and glycogen decomposition. Therefore, our findings show that the development of COVID-19 can cause hepatic impairment in these patients, which is consistent with the observations that a large number of COVID-19 patients showed liver function abnormalities (Table S13) (6).
Besides, our data show that the metabolic pathway of glycerophospholipids has been significantly changed, and glycerophospholipids are closely related with cardiovascular diseases. However, we did not find obvious pattern or significant difference of underlying diseases, such as hypertension, cardiac disease, diabetes, cerebrovascular disease, chronic hepatitis, and cancer, in the medical records of all the patient groups involved in this study. Therefore, this finding suggests that the fatality caused by COVID-19 might be related with cardiac impairment. Interestingly, COVID-19 has been recently reported to probably cause the loss of the smell and taste sense (https://www.npr.org/sections/goatsandsoda/2020/03/26/821582951/is-loss-of-smell-and-taste-a-symptom-of-covid-19-doctors-want-to-find-out), and the KEGG analysis also showed that the taste transduction pathway is affected.
The metabolomic and lipidomic analyses also show that, although the patients in both the severe and mild symptom groups had met the official hospital discharge criteria as their COVID-19 nucleic acid tests turned negative consecutively twice and major clinical signs disappeared, many of their fundamental metabolites and lipids failed to return to normal. This finding indicates that these discharged patients, regardless of the severity of their previous symptoms, had not been fully recovered from the disease in the aspect of metabolism, particularly hepatic functions. Therefore, even after the clearance of SARS-CoV-2 from patient bodies, these convalescent COVID-19 patients still need better nutrition and care that would be very helpful for their faster and full recovery from the disease.
The metabolomic and lipidomic alterations in patient plasma mainly reflect the systematic responses of the metabolisms of diverse cell types and organ systems that were affected by COVID-19. Therefore, the interpretations of the datasets should be integrated with other types of system studies, such as the transcriptome and proteome of specific tissue and body fluid samples, as well as clinical observations and laboratory examinations, to have a clearer and more comprehensive picture of the development of this disease. Moreover, such an integration would help us better understand the impacts of COVID-19 to specific cells and/or tissues infected by SARS-CoV-2.
In summary, the metabolomic and lipidomic datasets of the cohort of COVID-19 patients under different symptomatic conditions are highly valuable resources for better understanding the host metabolic responses associated with COVID-19, which expands our knowledge about the pathogenesis of COVID-19, accelerates identification of disease biomarkers and development of diagnostic assays, and provides hints of potential therapeutic strategies.
Author contributions
D.W., T.S., X.Y. and J.-X.S. performed experiments with the help of W.L., M.H., Y.Y., Q.Y., T.Z., J.X., Y.W., J.M., H.W., T.T., Y.R. Y.W.; M.Z. analyzed the metabolomics and lipidomics data with the help of D.W. and Y.Q.; Y.Q., D.-Y.Z., Y.S. and X.Z. performed the experimental design and data interpretation; X.Z, Y.Q., Y.S., and D.-Y.Z. designed the overall study, analyzed the data, and wrote the paper.
Competing Interests statement
The authors declare no conflicts of interest.
Supplementary Data
Methods and Materials
Ethics and Human Subjects
All work performed in this study was approved by the Wuhan Jinyintan Hospital Ethics Committee and written informed consent was obtained from patients. Diagnosis of SARS-CoV-2 infection was based on the New Coronavirus Pneumonia Prevention and Control Program (6th edition) published by the National Health Commission of China. Healthy subjects were recruited from healthcare workers and laboratory workers at Wuhan Jinyintan Hospital and Wuhan Institute of Virology, CAS, none of whom had previously experienced SARS-CoV-2 infection.
Patient Samples
SARS-CoV-2-positive patients were enrolled in the study after diagnosis. Blood sample (≤3mL) from fatal COVID-19 patients were collected over the course of their disease at intervals of 3-5 days. Blood sample (≤3mL) from the patients with severe and mild symptoms were collected at the time when the disease were most serious (3-7 days after hospitalization) and the time before discharge. Single samples were collected from healthy patients recruited from healthcare workers and laboratory workers at Wuhan Jinyintan Hospital and Wuhan Institute of Virology. All samples were collected using potassium-EDTA blood collection tubes. All samples used in this study are described in Table S1. All the blood samples were treated according to the biocontainment procedures of the processing of SARS-CoV-2-positive sample.
Methods for extraction of hydrophilic and hydrophobic compounds
To analysis hydrophilic compounds, sample was thawed on ice, 3 volumes of ice-cold methanol was added to 1 volume of plasma/serum, whirled the mixture for 3 min and centrifuge it with 12,000 g at 4°C for 10 min. Then the supernatant was centrifuged at 12,000 g at 4°C for 5 min, and then collected the supernatant and subjected them to LC-MS/MS analysis.
To analysis hydrophobic compounds, sample was thawed on ice, whirl around 10 s, and then centrifuge it with 3000 g at 4°C for 5 min. Take 50 μL of one sample and homogenized it with 1mL mixture (include methanol,MTBE and internal standard mixture). Whirled the mixture for 2 min. Then added 500 μL of water and whirled the mixture for 1 min, and centrifuged it with 12,000 g at 4°C for 10 min. Extracted 500 μL supernatant and concentrated it. Dissolved powder with 100 μL mobile phase B and subjected to LC-MS/MS analysis.
UPLC conditions of hydrophilic and hydrophobic compounds
The sample extracts of hydrophilic compounds were analyzed using an LC-ESI-MS/MS system (UPLC, Shim-pack UFLC SHIMADZU CBM A system, https://www.shimadzu.com/; MS, QTRAP® System, https://sciex.com/). The analytical conditions were as follows, UPLC: column, Waters ACQUITY UPLC HSS T3 C18 (1.8 µm, 2.1 mm×100 mm); column temperature, 40°C; flow rate, 0.4 mL/min; injection volume, 2μL; solvent system,water (0.1% formic acid): acetonitrile (0.1% formic acid); gradient program, 95:5 V/V at 0 min, 10:90 V/V at 11.0 min,10:90 V/V at 12.0 min, 95:5 V/V at 12.1.
The sample extracts of hydrophobic compounds were analyzed using an LC-ESI-MS/MS system (UPLC, Shim-pack UFLC SHIMADZU CBM A system, https://www.shimadzu.com/; MS, QTRAP® System, https://sciex.com/). The analytical conditions were as follows, UPLC: column, Thermo C30 (2.6μm, 2.1 mm×100 mm); solvent system, A: acetonitrile/water (60/40V,0.04% acetic acid, 5 mmol/L ammonium formate), B: acetonitrile/isopropanol (10/90 V, 0.04% acetic acid, 5 mmol/L ammonium formate); gradient program, A/B(80:20 V/V)at 0 min, 50:50 V/V at 3.0 min, 35:65 V/V at 5 min, 25:75 V/V at 9 min, 10:90 V/V at 15.5 min; flow rate, 0.35 ml/min; temperature, 45°C; injection volume: 2μL. The effluent was alternatively connected to an ESI-triple quadrupole-linear ion trap (QTRAP)-MS.
ESI-Q TRAP-MS/MS of hydrophilic and hydrophobic compounds
LIT and triple quadrupole (QQQ) scans were acquired on a triple quadrupole-linear ion trap mass spectrometer (QTRAP), QTRAP® LC-MS/MS System, equipped with an ESI Turbo Ion-Spray interface, operating in positive and negative ion mode and controlled by Analyst 1.6.3 software (Sciex). The ESI source operation parameters were as follows: ion source, turbo spray; source temperature 550 °C; ion spray voltage (IS) 5500 V; ion source gas I (GSI), gas II (GSII), curtain gas (CUR) were set at 55, 60, and 25 psi, respectively; the collision gas (CAD) was medium. Instrument tuning and mass calibration were performed with 10 and 100 μmol/L polypropylene glycol solutions in QQQ and LIT modes, respectively. QQQ scans were acquired as MRM experiments with collision gas (nitrogen) set to 5 psi. DP and CE for individual MRM transitions was done with further DP and CE optimization. A specific set of MRM transitions were monitored for each period according to the metabolites eluted within this period.
Plasma mentalities and lipids data analysis
The mass spectrum data were processed by Software Analyst 1.6.3. The repeatability of metabolite extraction and detection can be judged by total ion current (TIC) and multi peak MRM. Based on MWDB (metadata database) and other databases, qualitative analysis of information and secondary general data was carried out according to retention time (RT) and letter ion. Metabolite structure analysis referred to some existing mass spectrometry public databases, mainly including massbank (http://www.massbank.jp/), knapsack (http://kanaya.naist.jp/knapsack/), HMDB (http://www.hmdb.ca/), moto dB (http://www.ab.wur.nl/moto/) and metlin (http://metlin.scripps.edu/index.php).
Metabolite quantification was accomplished by using multiple reaction monitoring (MRM) of triple quadrupole mass spectrometry. Opened the mass spectrum file under the sample machine with multiquant software to integrated and calibrated the chromatographic peaks. The peak area of each chromatographic peak represented the relative content of the corresponding substance. Finally, exported all the integral data of chromatographic peak area to save, and used the self-built software package to remove the positive and negative ions of metabolites.
To maximize identification of differences in metabolic profiles between groups, the orthogonal projection to latent structure discriminant analysis (OPLS-DA) model was applied using the MetaboAnalyst R package. The OPLS-DA model was evaluated with the relevant R2 and Q2. And we used the permutation to assess the risk that the current OPLS-DA model is spurious.
Pathway Enrichment
We used the Kyoto Encyclopedia of Genes and Genomes (KEGG) database (http://www.genome.Jp/kegg/) to analyze the KEGG pathway enrichment to find highly enriched metabolic signal transduction pathways in differential metabolites or lipids. The p-value <0.05 was considered significantly changing pathways and was used for subsequent analysis.
Statistically Processed Datasets
Plasma metabolomics and lipidomics datasets (including fold-change and P-values for various group comparisons) are provided in Table S4-S5 and S8-S9. Plasma metabolomics pathway enrichment are provided in Table S6-S7. Plasma lipidomic pathway enrichment are provided in Table S10-S11.
Raw Data
All raw LC-MS/MS data has been deposited to the iProX under the accession number: PXD018307.

The orthogonal projection to latent structure discriminant analysis (OPLS-DA) showed the best possible discrimination of metabolites between fatal COVID-19 patients and healthy people as indicated. The x-axis represents the prediction component that shows differences between groups, and the y-axis represents the orthogonal component differences within the group. R2 represents goodness of fit, Q2 represents goodness of prediction, and P value shows the significance level of the model (x-axis = predictive components, y-axis = orthogonal component).
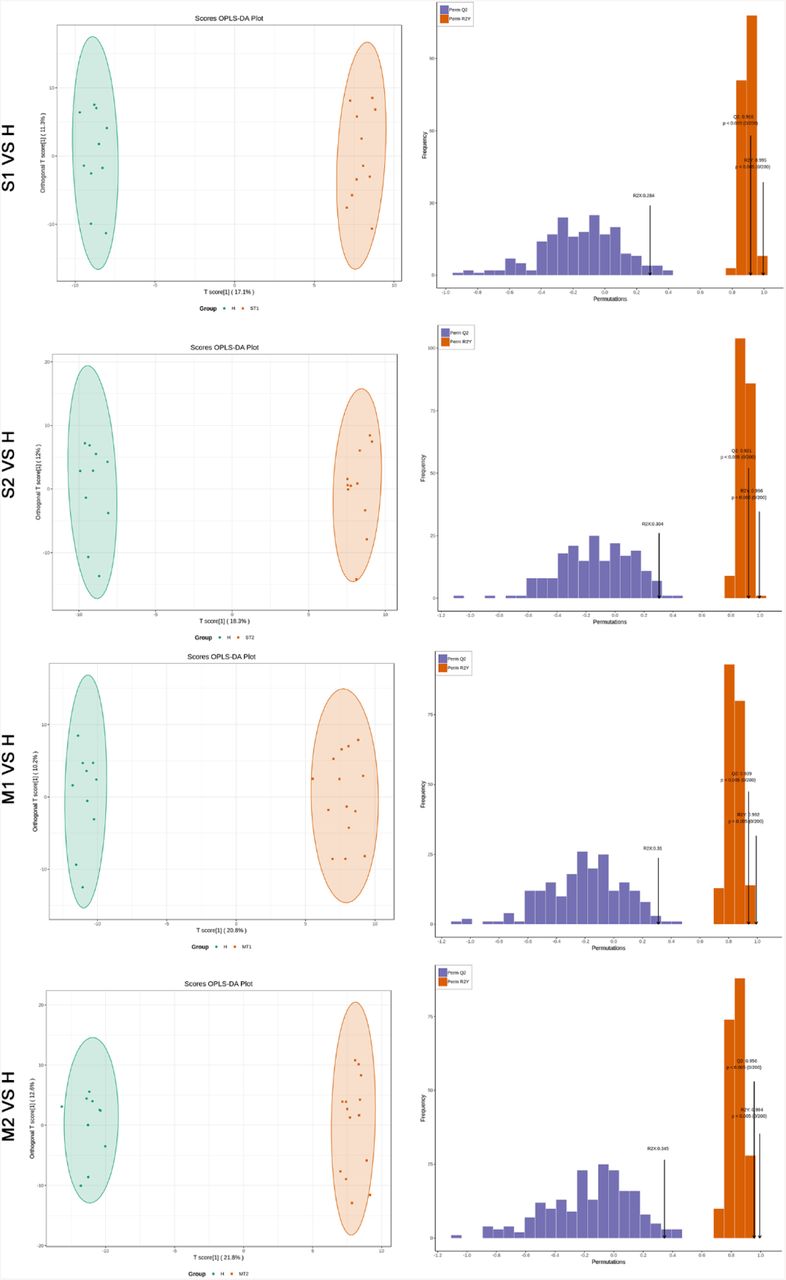
The OPLS-DA showed the best possible discrimination of metabolites between severe or mild COVID-19 patients and healthy people as indicated. The x-axis represents the prediction component that shows differences between groups, and the y-axis represents the orthogonal component differences within the group. R2 represents goodness of fit, Q2 represents goodness of prediction, and P value shows the significance level of the model (x-axis = predictive components, y-axis = orthogonal component).

The OPLS-DA showed the best possible discrimination of lipids between fatal COVID-19 patients and healthy people as indicated. The x-axis represents the prediction component that shows differences between groups, and the y-axis represents the orthogonal component differences within the group. R2 represents goodness of fit, Q2 represents goodness of prediction, and P value shows the significance level of the model (x-axis = predictive components, y-axis = orthogonal component).

The OPLS-DA showed the best possible discrimination of lipids between severe or mild COVID-19 patients and healthy people as indicated. The x-axis represents the prediction component that shows differences between groups, and the y-axis represents the orthogonal component differences within the group. R2 represents goodness of fit, Q2 represents goodness of prediction, and P value shows the significance level of the model (x-axis = predictive components, y-axis = orthogonal component).
Acknowledgments
We thank the patients, and the nurses and clinical staffs who are providing care for these patients. We thank the helpful discussions with Drs. Yan Wang and Yong Liu at Wuhan University. We also thank many staff members at Wuhan Jinyintan Hospital and Wuhan Metware Biotechnology Co., Ltd. for their contributions and assistance in this study. We sincerely pay tribute to our colleagues who are striving in the forefront of taking care of COVID-19 patients and studying this novel coronavirus in Wuhan and other places around the world.
This work was supported by the Strategic Priority Research Program of CAS (XDB29010300 to X.Z.), the National Science and Technology Major Project (2020ZX09201-001 to D.-Y.Z, and 2018ZX10101004 to X.Z.), and National Natural Science Foundation of China (81873964 to Y.Q., and 31670161 to X.Z.).
Footnotes
10 Lead Contact
References


