
ABSTRACT
Genes on the X-chromosome are extensively expressed in the human brain, resulting in substantial influences on brain development, intellectual disability, and other brain-related disorders. To comprehensively investigate the X-chromosome’s impact on the cerebral cortex, white matter tract microstructures, and intrinsic and extrinsic brain functions, we examined 2,822 complex brain imaging traits obtained from n = 34,000 subjects in the UK Biobank. We unveiled potential autosome-X-chromosome interaction, while proposing an atlas of dosage compensation (DC) for each set of traits. We observed a pronounced X-chromosome impact on the corticospinal tract and the functional amplitude and connectivity of visual networks. In association studies, we identified 50 genome-wide significant trait-locus pairs enriched in Xq28, 22 of which replicated in independent datasets (n = 4,900). Notably, 13 newly identified pairs were in the X-chromosome’s non-pseudo-autosomal regions (NPR). The volume of the right ventral diencephalon shared genetic architecture with schizophrenia and educational attainment in a locus indexed by rs2361468 (located ∼3kb upstream of PJA1, a conserved and ubiquitously expressed gene implicated in multiple psychiatric disorders). No significant associations were identified in the pseudo-autosomal regions (PAR) or the Y-chromosome. Finally, we explored sex-specific associations on the X-chromosome and compared differing genetic effects between sexes. We found much more associations can be identified in males (33 versus 9) given a similar sample size. In conclusion, our research provides invaluable insights into the X-chromosome’s role in the human brain, contributing to the observed sex differences in brain structure and function.
The genetic foundations governing gene regulation on the X-chromosome are inherently complex due to the XY sex-determination system1. In genetic females, who possess two X-chromosomes compared to males’ one, an X-chromosome is silenced, either at random or with a bias toward a particular parental copy, to equalize the transcriptional dosages of X-linked genes between the sexes2,3. This process, termed dosage compensation (DC) or X-chromosome inactivation (XCI), ensures that every female becomes a cellular mosaic, with each cell containing one of the two possible active X-chromosomes4. However, DC is not absolute. Only about 60-75% of X-linked genes undergo full silencing5, and the process can be tissue-specific6,7. Consequently, several factors, such as DC itself and individual variances in the expression of parent-of-origin genes, can influence female X-linked gene expression8. While most somatic cells in both sexes have only one active X-chromosome, the expression levels of genes on the X-chromosome can be amplified to match the expression levels of autosomal genes9 (Ohno’s hypothesis).
This compensatory elevation in the expression of X-linked genes has been noted across several species, including human10 and mouse10-12, and other species10.
The X-chromosome is home to a wealth of genes predominantly expressed in brain tissues10,13 as the chromosome-X to autosome expression ratio exceeds one10, underscoring the pronounced influence of the X-chromosome on brain anatomy, connection, and functions14-17. Mounting evidence has shown that the X-chromosome significantly impacts a myriad of neurological diseases and psychiatric disorders from both genetic and epigenetic viewpoints5,18-20. For instance, X-linked intellectual disability is a well-studied brain disorder and by 2022, 162 associated genes have been identified21. Remarkably, the concentration of genes on the X-chromosome is double that of intellectual disability-associated genes on the autosomes21. Chromosome mutations, such as sex chromosome aneuploidy, can have profound implications on brain structures14,22, cognitive capacities23,24, behaviors24, and both neurological24,25 and psychiatric disorders26,27. A combination of factors – including the dense presence of associated genes, varying gene expression between sexes, and the influence of epigenetic processes steered by sex steroid hormones – establishes the X-chromosome as a nexus for sex differences in the human brain across various age groups4,7,8,28-33. However, in spite of its pivotal role, the X-chromosome frequently goes unnoticed in genome-wide association studies (GWAS), as discussed by Wise et al.34 and Sun. et al.35.
In prior research, Smith et al.17 conducted a GWAS for 3,144 complex brain imaging traits (n = 22,138) and identified four genome-wide significant loci on the X-chromosome with the top SNP from each locus registering a p-value < 7.94 × 10⁻¹². They also characterized the genetic loci using eQTLs and examined the genetic co-architectures between brain traits and health-related disorders. Mallard et al.16 focused on investigating DC for regional brain measurements, including cortical volumes (CVs), cortical thickness (CT), and surface area (SA). They first observed a notable enrichment of X-chromosome influences on several regions of interest (ROIs) related to SA and then explored the genetic underpinnings of these ROIs through an X-chromosome-wide association study (XWAS36). However, the study of Smith et al.17 used a smaller discovery sample size (n = 22,138) than is currently available and the work of Mallard et al.16 was limited to brain anatomy. What is more crucial is that there remains a significant knowledge gap regarding the DC profile for brain imaging traits, as well as the extent to which sex differences in the human brain are influenced by the X-chromosome.
An overview of the present study is depicted in Fig. 1. We amassed 2,822 complex brain imaging traits derived from structural magnetic resonance imaging (sMRI) for cortical and subcortical structures of gray matter, diffusion MRI (dMRI) for microstructures of white matter tracts, resting-state functional MRI (rfMRI) and task-evoked functional MRI (tfMRI) for intrinsic and extrinsic brain functions, respectively (Table S1). Specifically, sMRI traits include BV, CT, and SA; dMRIs traits include axial diffusivity (AD), fractional anisotropy (FA), mean diffusivity (MD), mode of anisotropy (MO), and radial diffusivity (RD) along tracts and their tract-mean and functional principal component (PC) traits (hereafter DTI traits); and rfMRI and tfMRI traits generated using the Glasser36037 atlas (hereafter G360 traits).
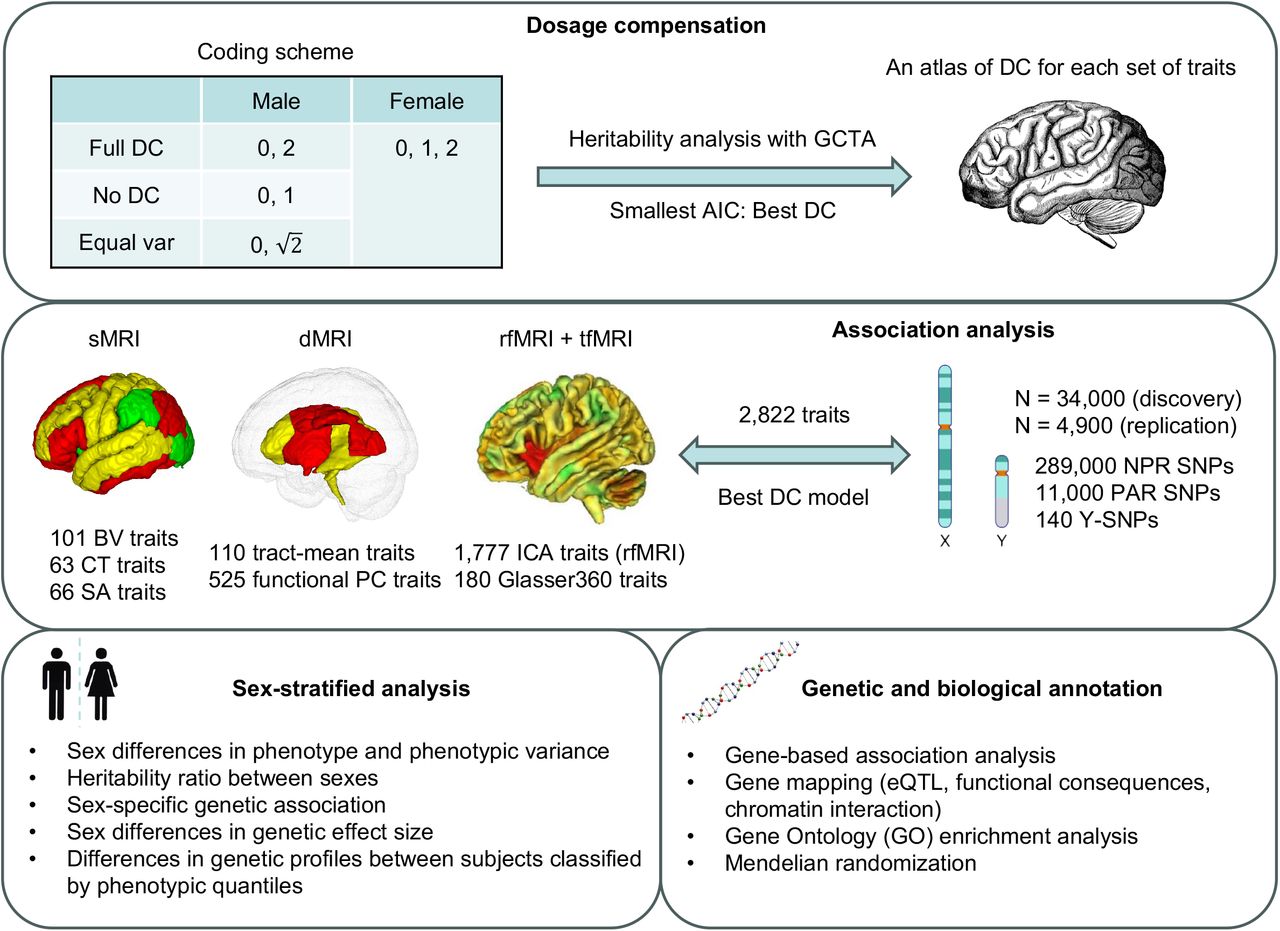
This study encompasses four main components: dosage compensation (DC), association analysis, sex-stratified analysis, and genetic and biological annotation. The unique challenge with X-chromosome analyses arises from the coding scheme uncertainty for males, rooted in the DC in females. We first identified the DC for each trait and established a comprehensive DC atlas for each trait set. Using this atlas, we undertook association analysis across 2,822 complex brain imaging traits. Through genetic and biological annotation, we bridged the association signals with other brain-related disorders and traits linked to sex hormones. In the sex-stratified analysis, we delved into the disparities in phenotype, phenotypic variance, X-linked heritability, and genetic associations between sexes.
Additionally, rfMRI images were subjected to whole-brain spatial independent component analysis (ICA, hereafter ICA traits). More details are in the Methods. A brief introduction and annotation of the DTI and ICA traits can be found in Table S1. The robustness and reproducibility of all trait measurements have been established in our previous studies38-41.
We first meticulously assessed the DC status of each trait using model selection, while gauging the narrow-sense heritability tied to the NPR SNPs of the X-chromosome by using a sex-agnostic analysis (Fig. 1). We then created a detailed DC atlas for every trait cluster. In association analysis, we tested the NPR and PAR SNPs on the X-chromosome, in addition to the SNPs on the Y-chromosome. By implementing the optimal DC model for the NPR SNPs, we aimed to enhance our statistical accuracy.
Interestingly, our brain imaging traits showed genetic overlaps with both brain-related disorders and educational benchmarks. Our further analyses probed into sex differences, focusing on facets like heritability, variance in phenotype, genetic associations, and genetic impact. These findings offer invaluable insights into the genetic factors influencing sex-based differences in the human brain’s structure and functions. With this research, our goal is to deepen the understanding of the X-chromosome’s role in human brain function and development. Our findings will pave the way for enriching future endeavors in biology, clinical sciences, and psychiatry.
RESULTS
Dosage compensation in the X-chromosome
We inferred a global DC status for each trait through model selection. Specifically, we employed three different model specifications: full DC, no DC, and equal variance to jointly estimate the narrow-sense heritability ascribed to autosomes  and the heritability credited to the NPR on the X-chromosome
  using GCTA42 (Methods). In these models, females were always coded as {0, 1, 2}, but males were coded as {0, 2} for full DC (known as random X-inactivation43), {0, 1} for no DC,
  for equal variance. These models illustrate the differing genetic variance between sexes, as males have twice the genetic variance as much as females in full DC, half in no DC, and identical in the equal variance model. For each trait, the model exhibiting the lowest Akaike information criterion (AIC) was selected as the best model. The DC status inferred in this way is not gene-specific but theoretically matches the DC based on the aggregated association statistics on the X-chromosome. Since the heritability attributable to the X-chromosome hinges on the inactivation status of the X-linked loci affecting a trait42,44, we can estimate the X-linked heritability more accurately and enhance the statistical power of our association analysis by designating the DC status for each trait. For clarity in subsequent discussions, we did not distinguish
  from their sample estimates
  if there was no confusion.
Out of the 2,822 traits analyzed, 2,810 exhibited a total heritability  that was positive, revealing that 69.4% favored full DC, 22.6% favored no DC, and 7.97% favored equal variance. Fig. 2A shows the distribution of DC status for each trait set (see Table S2 for detail). The traits MO, CT16, and ICA had the highest percentage of no DC preference. For the traits leaning towards full DC, no DC, and equal variance, the average
  estimates of 0.672% (se = 0.315%), 0.938% (se = 0.581%) and 0.250% (se = 0.417%), respectively (Fig. 2B). The differences in average
  across the three DC groups were statistically significant (Wilcoxon rank sum test, pairwise p-values < 5.5 × 10⁻¹⁴). Higher
  estimates are reasonable for traits favoring the no DC because when the cumulative gene expression dosage amplifies due to the evasion from XCI, the X-chromosome assumes a more dominant role in genetic regulation.
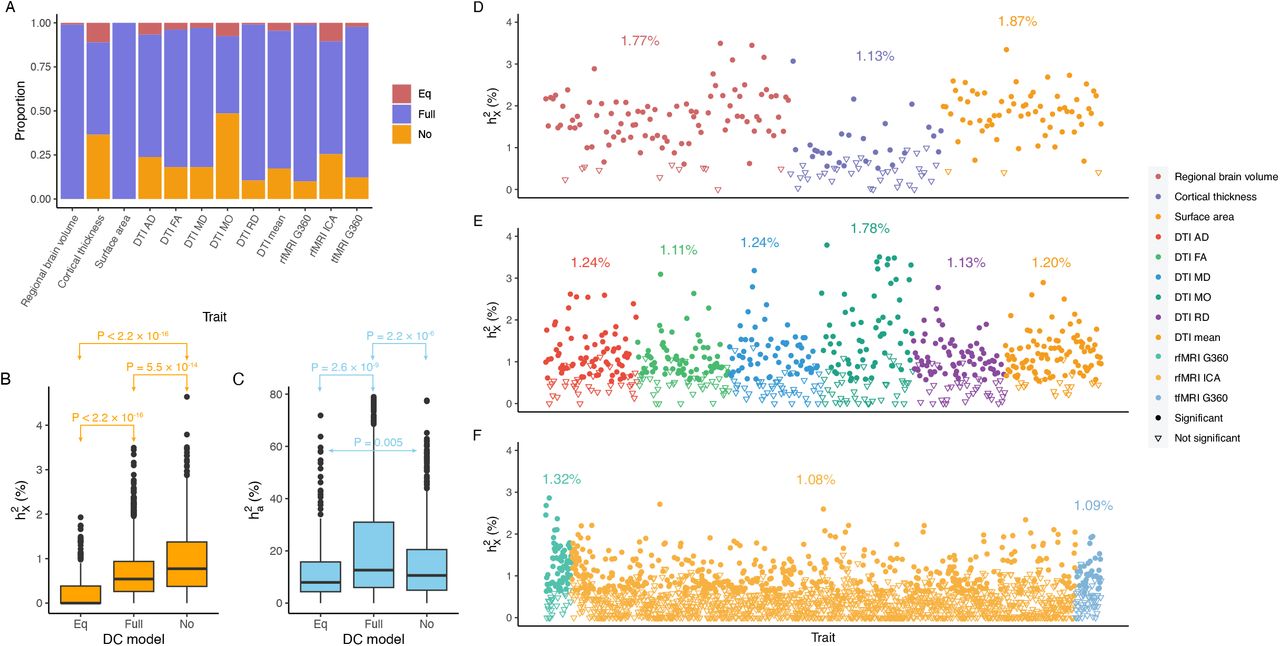
A) Distribution of the three DC groups across each trait set. B) Analysis of heritability attributed to the X-chromosome  among DC groups. The p-values are derived from pairwise comparisons through the Wilcoxon rank sum test. C) Examination of heritability contributed by autosomes
  among DC groups. The p-values are sourced from pairwise comparisons via the Wilcoxon rank sum test. D)-E) Scatter plots display
  for individual traits in sMRI, DTI, and fMRI, respectively. Different trait sets are color-coded, with traits having notable
  represented as filled circles. The average
  for significant traits is highlighted in its respective color.
Our analysis revealed that traits favoring full DC on the X-chromosome exhibited a stronger autosomal heritability compared to those favoring the alternative DC models (Wilcoxon rank sum test, pairwise p-values < 0.005, Fig. 2C). Specifically, traits with full DC exhibited an average heritability  . In comparison, no DC traits showed
  , and equal variance traits showed
  . This distinction was not caused by estimation bias, since for any given trait,
  estimated in different DC models were consistent (Fig. S1). The observed differentiation suggests a potential autosome-X-chromosome interaction, such as DNA methylation on autosomes which is trans regulated by the X-chromosome45. Concurrently, we theorize that traits aligned with no DC and equal variance models might be more influenced by non-genetic contributors, such as environmental factors.
Under the equal variance model, the ratio of  for a trait between males and females, denoted as
  , should be two for traits favoring full DC and 0.5 for those favoring no DC. To verify whether the inferred DC aligned with this assumption, we estimated sex-specific heritability for each trait, then calculated ρx (Methods). We observed that, ρx =1.94, 0.874, and 1.16 for traits favoring full DC, no DC, and equal variance, respectively (Fig. S2A). We further compared the heritability ratios stratified by sex for autosomes, denoted as
  , across traits based on their respective DC models for the X-chromosome. The observed differences among the three DC models were minor: ρa =0.983 for full DC, ρa =1.01 for no DC and ρa =1.01 for equal variance, all close to the expected value of one (Fig. S2B). Among these, only the X estimate for no DC notably strayed from the expected value (z-test p-values > 0.05/6). This implies that our model selection strategy is generally effective in identifying the appropriate model. The higher-than-expected value of X in the no DC category (when compared to 0.5) could potentially arise from classification errors and biological heterogeneity, such as variations in sex hormone levels4,44.
Patterns of dosage compensation and X-linked heritability for complex brain imaging traits
We jointly estimated  and
and  via the GREML analysis of GCTA42 based on the optimal DC model for each trait. Of the 2,810 traits with non-zero total heritability
  , 1,118 (39.8%) traits displayed significant heritability with an average of
  after adjusting for multiple comparisons by controlling false discovery rate (FDR) at the 0.05 level (Fig. 2D-F and Table S2). The majority of BV and SA traits were significant, succeeded by DTI tract-mean traits and rfMRI G360 traits. In contrast, CT and rfMRI ICA showcased the fewest traits with notable heritability estimates.
In the sex-stratified analysis, a larger number of traits demonstrated significant  for males compared to females (Fig. S3-4 and Table S3). We then assessed the relative contribution of the X-chromosome to the total heritability, denoted as
  (Fig. S5A). Generally, the X-chromosome was pivotal in accounting for genetic variance, especially for fMRI traits, with values ranging between 4.68% and 5.99%. Additionally, we evaluated the enrichment of
  by contrasting the observed
  with the expected ones The expected
  represents heritability attributed to a genome segment of a comparable size (Methods). Out of all the traits, 45 (1.60%) displayed enriched
  , while a substantial number of traits (476, 16.9%) exhibited depletion in
  (Fig. S5C-E and Table S2). The remaining traits did not demonstrate any significant deviation. Groups with different enrichment levels displayed varied mean
  (Fig. S5B), with Wilcoxon rank sum test yielding pairwise p-values < 1.68 × 10⁻¹¹. The limited presence of traits with enriched
  can be traced back to male haploidy and random XCI observed in females44, as both factors reduce the genetic variance attributed to the X-chromosome.
Differences were observed in patterns of DC across measures of brain anatomy. All SA traits favored full DC, while all but one BV trait (specifically the optic chiasm) also favored full DC. Contrastingly, about half of CT traits leaned towards either no DC or exhibited equal variance. While the mean CT favored full DC, those favoring no DC were spread across numerous cortical regions (Fig. 3A). Previous research has suggested that the CT of the motor cortex may be influenced by genes that escape typical regulations46. Our findings support this, as the CT for both the precentral and postcentral cortex (located near the motor cortex) showed patterns consistent with no DC.

A) DC atlas for CT: the left side showcases the left hemisphere while the right side displays the right hemisphere. Regions of Interest (ROIs) favoring no DC are annotated. B) DC Atlas for tract-mean characteristics assessed by MO, presented in six perspectives. The sequence from left to right, top to bottom includes superior, anterior, left, interior, posterior, and right views. Tracts that favor no DC are highlighted. “SFO” is in parenthesis since it is blocked by other tracts. C) DC Atlas for fMRI G360 traits: The upper triangle illustrates rfMRI, whereas the lower triangle depicts tfMRI. The diagonal, extending from the bottom left to the top right, divides into two sections—the upper triangle portrays DC for rfMRI intra-network connectivity and the lower for tfMRI. Cells on the left margin represent DC amplitude traits for rfMRI, while those at the bottom indicate DC amplitude traits for tfMRI.
The X-chromosome significantly impacts variations in brain anatomy. Of the 230 traits examined, 179 showed notable  estimates with average
  . Our
. Our  and
and  estimates for global brain measures echoed findings from previous studies16,38,47,48. We observed no significantly enriched traits for BV, but we identified one for CT (left caudal middle frontal) and three for SA (left banks of superior temporal sulcus, left rostral middle frontal, and right pars triangularis) (Fig. S6). Notably, the left caudal middle frontal showcased the highest X-chromosome heritability in CT
  , where the X-chromosome accounted for over 14% of total heritability. There are distinct differences in
  between CT traits and those of BV and SA. Firstly, the mean
  for BV and SA are double that of CT. Secondly, although the correlations of
  for traits in left and right hemispheres were comparable among BV, CT, and SA,
  showed the highest correlation for BV (r = 0.807, p-value = 2.05 × 10⁻¹¹), then SA (r = 0.585, p-value = 0.0003) and lastly CT (r = 0.204, p-value = 0.20) (Fig. S7), given the standard errors of
  estimates were similar among brain anatomy (se = 0.362%∼0.403%). Overall, the X-chromosome has a pronounced effect on BV and SA, but its influence on CT varies more between hemispheres, and the DC pattern of CT is more intricate. This suggests that CT undergoes unique biological processes during brain development compared to BV and SA30,49.
White matter tracts evaluated by MO predominantly favored no DC, whereas RD had the highest proportion of full DC traits (Fig. 3B for the DC alas of MO and Fig. S8 for other metrics). The DC patterns in the PCs of MO differed significantly from other metrics: MO displayed 51 no DC traits, whereas all other metrics exhibited fewer than 25 such traits (Fig. S9). Notably, all five PCs of MO associated with the anterior limb of the internal capsule, corticospinal tract, and splenium of corpus callosum favored no DC (Fig. S9D).
The corticospinal tract stood out with its distinct DC and heritability enrichment patterns. It was unique in consistently favoring no DC across all DTI metrics and PCs. Remarkably, of the seven functional PC traits enriched in  , four were linked to the corticospinal tract (Fig. S10). The
  of the fourth PC of the corticospinal tract, when assessed by AD, MD and RD, accounted for over 80% of total heritability, resulting in an enrichment ratio close to 20 (Fig. S5E). This heightened influence of the X-chromosome-coupled with its comparatively lower total heritability to other tracts-complements existing knowledge about significant sex differences in the development of the corticospinal tract50,51. Further evidence suggests that increased X-chromosome dosage can notably decrease the white matter volume of the corticospinal tract14. This unique heritability of the corticospinal tract might stem from the additional dosage of X-escapee genes. Comprehensive details about DC and heritability of DTI traits are available in the Supplementary Results.
G360 traits that favored no DC were predominantly associated with the two visual networks and the default network (Fig. 3C). For example, the mean amplitude of visual networks, as well as the mean connectivity both within and between primary visual and secondary visual networks, strongly favored no DC. Two of the mean connectivity traits showcased enriched heritability on the X-chromosome  , where
  represented over 21% heritability. Yet, when examining tfMRI, the
  of average functional connectivity linked to primary or secondary visual networks was more restrained, peaking at 1.28%. Two functional connectivity traits within the posterior-multimodal networks were significantly enriched (Fig. S11).
For the 1,777 rfMRI ICA traits generated by the whole-brain spatial independent component analysis, we classified the 76 amplitude traits into two groups40: within and outside the triple networks (central executive, default mode, and salience networks). Similarly, we classified the 1,701 functional connectivity traits into three groups: within, partially within, and outside the triple networks. We found that DC status was disproportionately distributed between within and outside-triple-network amplitude traits (Fisher’s exact test, p-value = 3.43 × 10⁻⁵). Specifically, 77.8% of the traits within the triple network were in favor of full DC (Fig. S12A), while the corresponding proportion was only 32.3% for traits outside the triple network (Fig. S12B). However, we did not observe a significant difference in DC among the three groups for the functional connectivity traits (Fisher’s exact test, p-value = 0.062).  was neither significantly different between within and outside triple-network amplitude traits (Wilcoxon rank sum test, p-value = 0.252 > 0.05/4, Fig S12C), nor was it significantly different among within, partially within, and outside triple-network functional connectivity traits (Wilcoxon rank sum test, minimum p-value = 0.016 > 0.05/4, Fig S12D). More results on the heritability of fMRI traits are in Supplementary Results.
Genetic loci on the X-chromosome associated with complex brain imaging traits
We carried out XWAS (n = 34,000) for 2,822 complex brain imaging traits on 300,000 SNPs on the X-chromosome (including 289,000 NPR SNPs and 11,000 PAR SNPs after imputation) using PLINK252 (www.cog-genomics.org/plink/2.0/). Table S4 shows a breakdown of the trait-specific sample size and number of SNPs. For NPR SNPs, we determined the best DC model for each trait following the model selection results in the dosage compensation section. Since the equal variance model (the two male hemizygous genotypes coded as 0 and  ) is not available for PLINK2, we set the full DC model (males coded as 0 and 2) for traits favoring equal variance. On average, 1.37 more significant SNPs at the genome-wide significant level (5.0 × 10⁻⁸) can be identified for no DC traits than if the full DC model would have been used. For completeness, we also conducted association analyses on the Y-chromosome for all the traits. No significant SNPs were identified at the genome-wide threshold, so we focused on the X-chromosome thereafter.
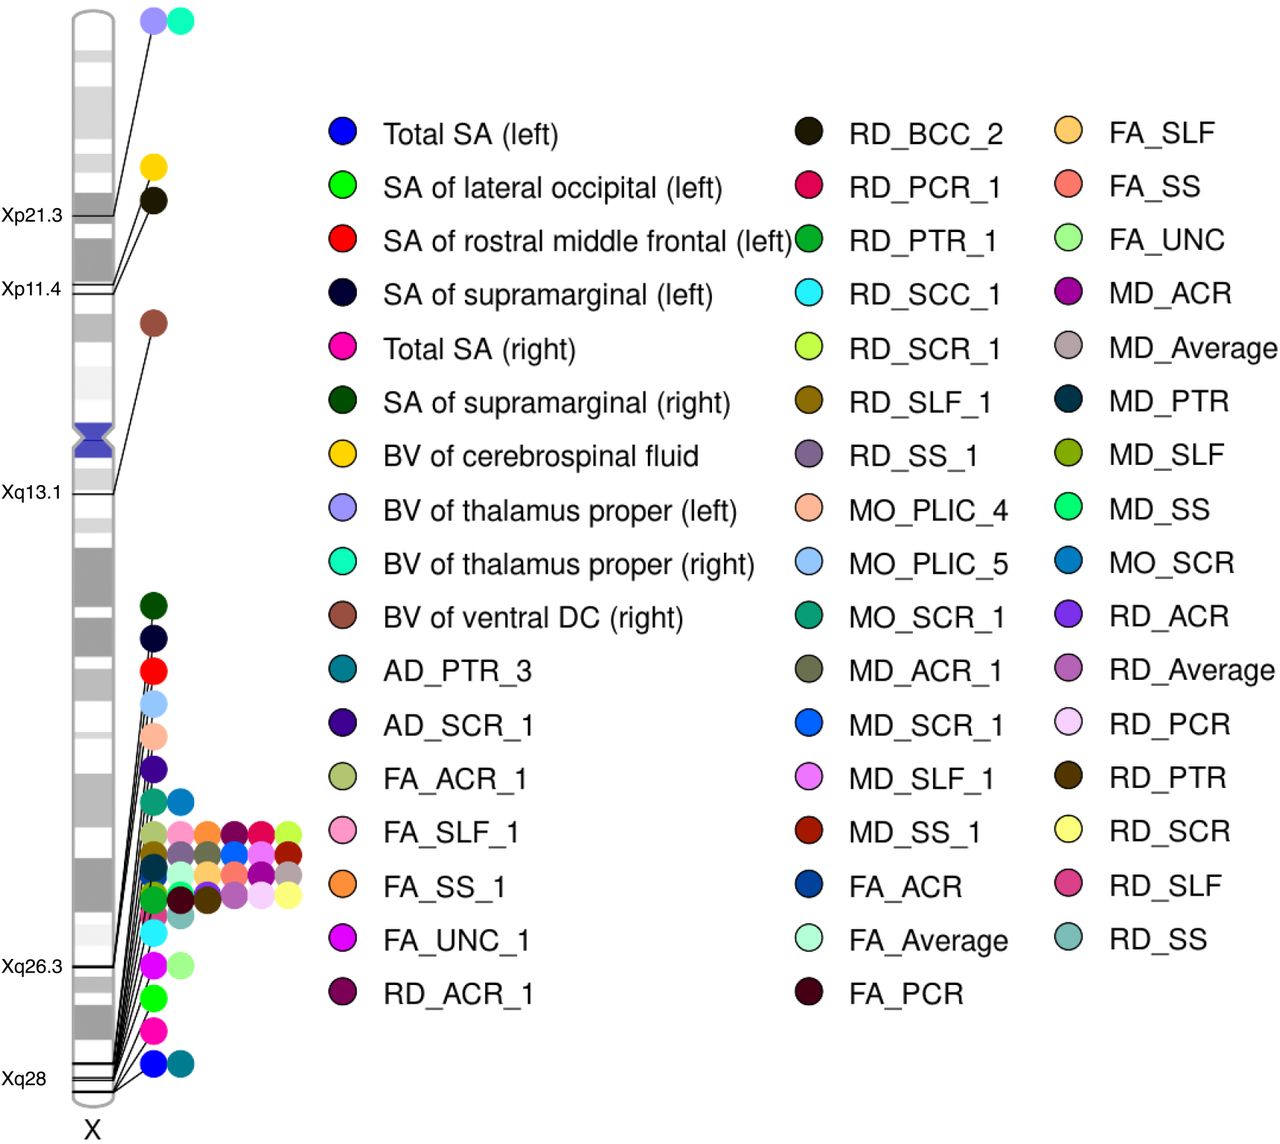
At the 5 × 10⁻⁸ threshold after using wild bootstrap53 to control for multiple comparisons due to analyzing 2,822 traits (Supplementary Methods), we identified 21 unique top NPR SNPs (linkage disequilibrium (LD) r2 < 0.1) in five genomic regions (Xp11.4, Xp21.3, Xq13.1, Xq26.3 and Xq28), associated with 50 different traits (6 SA, 4 BV, 2 AD, 4 FA, 8 RD, 3 MO, 4 MD, and 19 tract-mean), resulting in 50 trait-locus association pairs (Table S5-6, Fig 4). Three out of 50 traits favored no DC. We did not identify any significant locus in PARs (including the small ∼300kb PAR2 region within Xq28; the rest of Xq28 are in NPR). In general, traits of different modalities did not share the same loci.

Ideogram illustrating the genomic regions affecting brain imaging traits. Each trait is represented by a unique color, with the corresponding genomic region labeled directly on the ideogram. DTI PC traits follow the naming convention “metrics_tract_PC”, while DTI trait-mean traits are denoted as “metrics_tract”. The term “metrics_Average” refers to the comprehensive average trait for a metric, which is derived from the average of all voxels across all tracts.
Genetic loci were disproportionately enriched in Xq28 (hypergeometric test, p-value = 2.79 × 10⁻¹⁸) (Fig. 4). These loci were associated with the tract-mean traits of the anterior corona radiata, posterior corona radiata, superior longitudinal fasciculus, sagittal stratum, uncinate fasciculus, posterior thalamic radiation, and superior corona radiata. Splenium of the corpus callosum and posterior limb of the internal capsule were also associated with Xq28, but they were identified through functional PCs of RD and MO, respectively. Unlike other DTI traits that were only pointed to Xq28, the second PC of the body of corpus callosum evaluated by RD was associated with a locus in Xp11.4. Three SA traits: left and right total SA, and left lateral occipital were also associated with loci at the NPR-PAR boundary in Xq28. Moreover, the SA of left and right supramarginal and the SA of rostral middle frontal were linked to variants in Xq26.3. Loci associated with BV traits spanned a broader range, including Xp21.3 (left and right thalamus proper), Xp11.4 (cerebrospinal fluid, CSF), and Xq13.1 (right ventral diencephalon).
By performing association lookups in NHGRI-EBI GWAS catalog54, 13 trait-locus association pairs were newly identified (Table 1). We found evidence that some top SNPs were related to brain structures in previous studies. For instance, rs2272737 was associated with a variety of DTI measures17; rs12843772 was associated with BV, cortical areas17, and brain shape55.
The trait-locus pairs were compared with results on the NHGRI-EBI GWAS catalog (2023.06). The raw p-values are adjusted by using wild bootstrap. The physical locations of loci are according to GRCh37 release 13.
We verified the XWAS results from two aspects considering the unique features of the X-chromosome. First, we estimated genetic effects separately for males and females in a sex-stratified analysis and then conducted a meta-analysis via Metal (https://genome.sph.umich.edu/wiki/METAL) (Methods). Almost all significant trait-locus pairs in the sex-agnostic analysis were also discovered in the meta-analysis, and three new trait-locus pairs could only be identified through meta-analysis (Table S7). Second, we separately performed XWAS on UKB phase 4 subjects with European ancestry (UKBE, n = 4,181), UKB phase 1-4 subjects with South Asian ancestry and Chinese ancestry (UKBSAC, n = 462), and UKB phase 1-4 subjects with African ancestry (UKBA, n = 295) to replicate our discoveries (Table S8). Of the 50 top SNPs in discovery and replication, we observed that 100% had effect sizes with the same sign (proportion test against 0.5, p-value = 4.22 × 10⁻¹²) by using UKBE. Out of 50 trait-locus pairs, 11 (22.0%) could be replicated after multiple hypothesis correction at a conservative Bonferroni threshold (p-value < 0.05/50 = 0.001). None could be replicated by using UKBSAC and UKBA at the same threshold, possibly due to the limited sample size. We then conducted a meta-analysis (total n = 4,938) for the separate XWAS results on different ethnic groups, and 22 (44.0%) trait-locus pairs could be replicated. The effect direction of each replicated SNP was consistent across the ethnic groups. Finally, we meta-analyzed the XWAS results of UKB phase 1 to 3 (discovery) and UKB phase 4 (replication) in white subjects (n = 37,772), and 36 more trait-locus pairs were identified, including from new genomic regions of Xp22.2 and Xp11.23 (Table S9).
Shared genetic architectures with brain-related disorders and other phenotypes
The identified independent significant SNPs (along with SNPs in LD (r2 ≥ 0.6)) suggest genetic connections between the complex brain imaging traits and a spectrum of neurological diseases, psychiatric disorders, and cognitive functions (Table S10). The volume of the right ventral diencephalon (known as hypothalamus) was significantly associated with rs2361468 in the genomic region Xq13.1, where it tagged many variants in LD deeply linked to schizophrenia56-59. Additionally, rs62606709 in the same locus was related to educational attainment60 (Fig. 5A). Xq13.1 was enriched with variants related to neuroticism18 as well as to neuropsychiatric disorders, such as schizophrenia61,62, autism spectrum disorder (ASD)62,63, bipolar disorder (BD)62, major depressive disorder (MDD)62 and Parkinson’s disease (PD)64. Through further literature review, we found more evidence of connections between the volume of the ventral diencephalon and neuropsychiatric and other disorders. For instance, ventral diencephalon is involved in many pathways found disrupted in schizophrenia65 and enlargement of ventral diencephalon was observed in patients with schizophrenia66 and MDD67. Ventral diencephalon atrophy was linked to AD68,69, MDD70-72, late-life depression73, PD74, and spinocerebellar ataxias \ type 3 (SCA3)75.

The top lead SNP, defined as the SNP with the lowest p-value in its locus, surpasses the 5 × 10⁻⁸ threshold after adjusting for multiple comparisons using wild bootstrap. However, the p-values shown in the figure remain unadjusted. The top lead SNP along with all the SNPs in LD (r2 > 0.6) in the same locus are the targets for XWAS results lookup in the NHGRI-EBI GWAS catalog (2023.06). A) The volume of the right ventral diencephalon exhibits shared genetic links with educational attainment and schizophrenia, pinpointed at an Xq13.1 locus by rs2361468. B) The tract-mean trait of the Superior corona radiata, as assessed by MO, shares a genetic foundation with testosterone levels, identified at an Xq28 locus via rs67596711. C) A shared genetic influence was identified between the volume of cerebrospinal fluid and sex hormone-binding globulin (SHBG), situated at an Xp11.4 locus indexed by rs35318931.
We observed colocalization of a locus in Xq28 for tract-mean trait of superior corona radiata (SCR) for MO (termed by “SCR-MO”) and various types of testosterone levels (Fig. 5B). The top SNP rs67596711 exhibited a positive effect for both SCR-MO and total testosterone level76. SCR-MO favored full DC and had relatively small but significant X-linked heritability  and mild male: female variance ratio (1.04). Strikingly, the phenotypic difference between sexes was pronounced: males registered a 0.44 standard deviation increase in SCR-MO compared to females (p-value = 7.23 × 10−210), which can likely be attributed to the impact of testosterone. Our findings echo previous research suggesting that the increasing sex disparities in SCR during puberty are influenced by gonadal hormones51,77,78. Additionally, BV of CSF shared genetic architecture with sex hormone-binding globulin (SHBG) at Xp11.4 (Fig. 5C), indexed by rs35318931, and the effect directions were concordant. Although the gene expression of sex hormone-associated loci were not enriched in any brain cell type76 in GTEx79 (v7), it is worth mentioning that the brain tissue samples were sourced exclusively from gray matter. These insights underscore the crucial role of sex hormones in influencing brain functions and structrues.
Apart from brain-related disorders, we also identified colocalization between complex brain imaging traits and various conditions and health-related traits (Table S10). In Xq26.3, the genetic loci associated with SA of supramarginal also influenced the onset of myopia80 and refractive error81. In contrast, the genetic loci associated with DTI traits in Xq28 were mainly connected to type 2 diabetes82-86, blood-related traits including hemoglobin87, hematocrit87, red blood cell count87, serum uric acid levels88, serum creatinine levels88, blood urea nitrogen levels88, and factor VIII levels89, and cardiovascular disorders, such as venous thromboembolism90.
Gene-based analysis and functional mapping
MAGMA91 (v1.08) was applied to XWAS summary statistics for gene-based analysis. We identified 29 genes in NPR located in eight genomic regions (Xp11.21, Xp22.12, Xq13.1, Xq21,1, Xq21.2, Xq24, Xq26.3 and Xq28), associated with 78 traits using Bonferroni correction considering the effective number of independent traits92 and the number of protein-coding genes on the X-chromosome (p < 0.05/230/747 = 2.91 × 10⁻⁷, Methods, Table S11). CLIC2, DUSP9, RAB39B, TMLHE, VBP1, and PJA1 were previously seen being associated with regional SA phenotypes16. ZNF275, DACH2, and VMA21 were identified as being associated with brain connectivity measurement93 and brain shape55. FAAH2 was associated with neuroticism measurement18. Many detected genes were involved in intellectual disability, educational attainment, and neuropsychiatric disorders. For instance, RENBP94, TKTL158, and MAP7D258 were for schizophrenia; USP51 was for educational attainment5,60; DACH2 was for AD95. IRAK1 and TMEM187 were for Internet addiction disorder96. Some genes were linked to subtypes of autism. For instance, TMLHE deficiency, leading to a defect in carnitine biosynthesis, was a risk factor for nondysmorphic autism97,98. DACH2 was associated with ASD99.
We conducted eQTL mapping using significant independent SNPs based on datasets Genotype-Tissue Expression79 (GTEx v8) and CommonMind Consortium20 (CMC) (Table S12). We identified eQTLs in Xq28 associated with schizophrenia. For example, rs4370701, the eQTL of FAM3A, was associated with the left total SA. Mutations in FAM3A led to schizophrenia58, and its gene expression exerting an effect on the cerebellum, cortex, and hypothalamus was regulated by rs4370701. As discussed before, RENBP, a risk gene for schizophrenia among Han Chinese94, is regulated by rs12840700. The variant was proposed to be associated with FA of posterior corona radiata, superior longitudinal fasciculus, and mean FA of all tracts. Moreover, we identified the relationship between rs2361468 in Xq13.1 and the volume of the right ventral diencephalon. This variant also regulated gene expression of PJA1, for which the mutations increased the risk of schizophrenia59 and other neuropsychiatric disorders62.
We mapped the significant independent SNPs to genes based on functional sequences, resulting in 35 unique genes associated with 50 traits of brain anatomy and white matter microstructures. These genes exhibited diverse association patterns with SNPs that influenced brain measurements, neuropsychiatric disorders as well as cognitive abilities (Table S13). For instance, DCAF8L1 was linked to educational attainment60 and neuroticism18, EFNB1 was linked to schizophrenia61, Parkinson’s disease64 and educational attainment60, while both RN7SKP31 and RNU6-985P were linked to neuroticism100, cognitive function101 and educational attainment60, through SNPs in nearby intergenic regions. Moreover, SRPX was tagged by rs35318931 in its exonic region, correlating with CSF volume, which was a risk factor for anorexia nervosa102.
X-chromosome inactivation (XCI) status6 was determined for all protein-coding genes identified by FUMA (Table S14). Of the 105 genes, 71 (67.6%) were previously reported inactive, 13 (12.4%) were escaping, and 21 (20.0%) were variable. When compared with the reference provided by Tukiainen et al6, the identified genes were not enriched in any XCI category (hypergeometric test, p-value > 0.05/3).
Long non-coding RNAs (lncRNAs) have merged pivotal regulators. For example, XIST and TIST not only initiate XCI but also participate in subsequent complex processes103,104. We utilized two approaches – eQTL mapping and H-MAGMA105 to map significant SNPs to lncRNAs. H-MAGMA incorporates a chromatin interaction profile to aggregate SNPs to the nearest genes (Methods, Table S15). At a Bonferroni threshold considering the effective number of independent traits92 and the number of lncRNAs on the X-chromosome (p < 0.05/230/107 = 2.03 × 10⁻⁶), SNPs associated with 27 traits were mapped to three lncRNAs in regions Xq26.3, Xp11.21 and Xq28.
Finally, we conducted biological annotation via the DAVID Bioinformatics Database106 (https://david.ncifcrf.gov/home.jsp) and SynGO (https://syngoportal.org/) on all the prioritized genes identified through functional mapping (Table S16). For DAVID, 182 of these genes were cataloged and subsequently analyzed. At the FDR threshold of 0.05, the genes were enriched in transcription elongation (IPR021156 and PIRSF008633) and were associated with diseases such as autism (KW-1269) and intellectual disability (KW-0991). At the nominal significance level (p-value < 0.05), these genes were enriched in biological pathways such as “axon development” (GO:0061564), “neurogenesis” (UP_KW-0964), and “nervous system development” (GO:0007399). For SynGO, 14 genes were uniquely mapped to SynGO annotated genes, and 11 genes have a cellular component annotation (Fig. S13 and Table S17): four postsynaptic, two both pre- and postsynaptic, three presynaptic, and two could not be mapped to any specific compartment.
Mendelian randomization analysis for a causal effect of gene expression on the human brain
Through eQTL mapping, we have linked the significant variants to gene expression levels, but the causal influence of gene expression on the brain traits remained ambiguous. We employed summary statistics-based Mendelian randomization (SMR)107 to investigate whether XWAS traits could be modulated by gene expression. We also used the HEIDI test107 to distinguish pleiotropy of causal variants from linkage (Methods). The eQTL data containing NPR SNPs across 1,639 probes were derived from Sidorenko et al.’s44 CAGE whole-blood analysis. After controlling for FDR at 0.05 level, 11 genes showed evidence of the causal effect that can control the alteration of regional BV, SA, and white matter tracts, and some of them were also linked to neuropsychiatric diseases and neurodevelopmental disorders (Table S18). For instance, Parkinson’s disease-linked gene DNASE1L164 and schizophrenia-linked gene FAM50A58 exerted a causal effect on the SA of the left lateral occipital; nondysmorphic autism-linked gene TMLHE exerted a causal effect on the total SA of both hemispheres, the SA of left lateral occipital, and the third PC of AD of the posterior thalamic radiation. In contrast, the expression of ZNF275 affected the microstructure of the superior corona radiata evaluated by AD and MO. After applying the threshold p-HEIDI > 0.05107 to screen out linkage from pleiotropy of causal variants, the associations remained the same, which means the tagged SNPs can simultaneously affect gene expression and brain traits. This finding reinforces the genetic interplay between brain imaging traits and neurological disorders.
Disparity of genetic associations between sexes
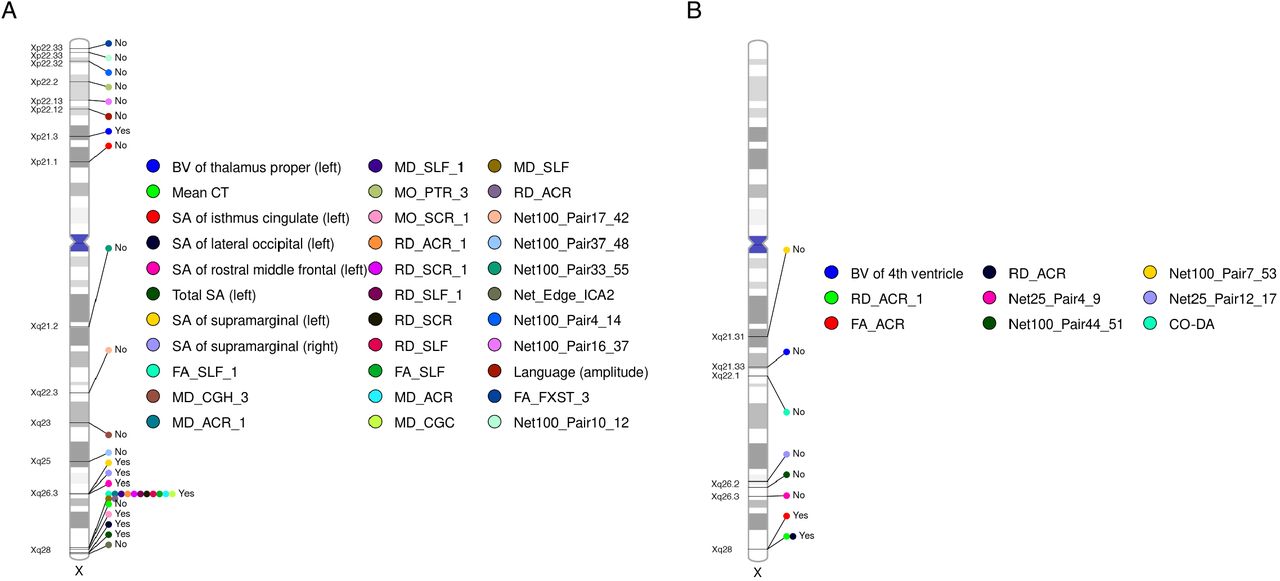
We observed substantial phenotypic differences between sexes in complex brain imaging traits (Supplementary results and Table S19). Specifically, 80.1% of traits showed significant phenotypic differences sexes after controlling an FDR level of 0.05. These gender disparities in the human brain may be influenced by X-chromosome genetic regions uniquely associated with either sex. To verify this hypothesis, we conducted sex-stratified XWAS on males (n = 16,094) and females (n = 17,558) separately. Due to reduced sample sizes post-split, we used a significance threshold of 1.0 × 10⁻⁸ for all analyses here, aligning with Bernabeu’s108 approach in a related study. Within the NPR for males, we identified 31 trait-locus pairs from 12 genomic regions spanning 31 traits (Fig. 6A and Table S20). Notably, 25 out of these 31 traits displayed significant intergender differences. However, for females in NPR, only nine trait-locus pairs from six genomic regions spanning nine traits were recognized (Fig. 6B), with each trait manifesting pronounced gender disparities. In the PAR for males, we found two trait-locus pairs in p22.33 related to the third PC of fornix and stria terminalis (FXST) as gauged by FA and an ICA functional connectivity trait tied to default mode and central executive networks. However, no findings merged from the female data. To fully utilize the available data, we further meta-analyzed the sex-stratified XWAS using UKB phase 1-3 and phase 4 subjects with European ancestry (Table S21). The final samples consisted of 18,025 for males and 20,054 for females. Male-specific trait-locus pairs in NPR doubled from 31 to 68 at the set threshold, whereas the female dataset only added two more pairs in NPR. In PAR, the male-specific pairs became insignificant, but one new significant pair emerged for females in Xp22.33, linked to an ICA functional connectivity trait concerning the triple networks.

Ideogram depicting genomic regions influencing brain imaging traits. Each trait is distinguished by a unique color, with the name of each genomic region clearly marked on the ideogram. Indicators “Yes” and “No” specify whether the same locus was pinpointed in sex-agnostic association analysis. DTI PC traits follow the naming format “metrics_tract_PC”, while DTI trait-mean traits adhere to “metrics_tract”. The term “metrics_Average” signifies an overall-average trait for a metric that encompasses the average across all voxels and tracts. For the naming convention of ICA traits, please refer to Table S1. The label “Language (amplitude)” denotes a rfMRI G360 trait measuring the mean amplitude of the language network. “CO-DA” stands for a rfMRI G360 trait that captures the functional connectivity between the cingulo-opercular and dorsal-attention networks. A) represents male-specific associations, while B) indicates female-specific associations.
Substantial discrepancies were evident in the association patterns across sexes. Only two genomic regions (Xq26.3 and Xq28) were simultaneously tagged by male and female-specific associations, but the related traits differed (Fig. 6). The only shared associated traits between genders in Xq28 were the first PC and mean RD of the anterior corona radiata. Notably, 19 of the 31 male NPR trait-locus pairs (61.3%) overlapped with findings from the sex-agnostic XWAS, but there were only three out of nine (33.3%) trait-locus pairs for females (Fig. 6). This suggests that the significant loci in the sex-agnostic XWAS predominantly driven by males. Most traits with significant loci (regardless of sex) favored full DC. The paucity of significant loci in females aligns with the observation that, for full DC-favoring traits, more genetic variance manifests in males than females. XWAS statistical methodologies should also account for heteroskedasticity between genders.
According to NHGRI-EBI GWAS catalog54, the third PC of posterior thalamic radiation evaluated by MO in males shared genetic underpinnings with cognitive performance in Xp22.2 (rs5934953). Additionally, the mean amplitude of language network (G360) in males had a genetic overlap with SHBG in Xp22.12 (rs7883287, Fig. S14).
Variants can have starkly different genetic effects between sexes, and the extent of these differences can vary based on traits and typically, tissues108,109. These variations might illuminate the observed disparities in human brain structures across sexes4,8,32,110 (Methods). We pinpointed nine trait-locus pairs across seven genomic regions (Fig. S15 and Table S22). All the traits displayed significant sex differences, including CT of left rostral middle frontal, PCs of anterior corona radiata evaluated by FA and RD, functional connectivity involving default mode, motor, subcortical cerebellum, central executive, and limbic networks. Notably, all the variants had moderate effect sizes but distinct directions between sexes, and therefore none of the trait-locus pairs overlapped with sex-specific associations. For example, rs12387759 in Xq27.3 revealed marked effect differences between sexes for CT of the left rostral middle frontal. Similarly, rs62589244 in Xp11.4 had divergent effects on the third PC of anterior corona radiata assessed by RD. Other genomic regions included Xp22.33, Xq21.31, Xp22.11, Xq22.1, Xp22.33 and Xq23.
Differences in genetic effects suggest an interaction between the variant and sex. Traditional XWAS which tests for the primary additive effect, can overlook these variants as effects with varying directions might negate each other in a linear model, leading to the “masking of genetic effect”108. Through meta-analysis using Stouffer’s method111, we identified variants overlooked in the sex-agnostic XWAS112 (Fig. S15). Four of the nine trait-locus pairs with varying effects were significant. This highlights the need for XWAS to account for interactions between variant and sex, reflecting XCI uncertainty43.
Finally, we hypothesized that there might be distinct genetic profiles for subjects that were consistently located at two tails of phenotypic distributions. Separating these subjects by gender, we compared their genetic profiles using Fisher’s exact test (Methods). For males, we identified 29 significant genetic loci (p-value < 1.0 × 10⁻⁸), but surprisingly, none for females (Fig. S16 and Table S23). These loci spanned the entire X-chromosome, rather than clustering in specific regions. Some coincided with loci from our sex-stratified analysis, such as an Xq28 locus related to CT. This suggests male brain phenotypic variations can be reflected by diverse X-chromosome genetic profiles, whereas other factors might drive variations in females.
DISCUSSION
Genes on the X-chromosome are extensively expressed in the human brain32. Evidence shows that mutations in X-linked genes resulting in intellectual disability are about 3.5-fold more than those in autosomal genes113. To comprehensively investigate the X-chromosome’s influence on brain anatomy, microstructure, and function, we conducted DC and heritability analysis, as well as XWAS for 2,822 complex brain imaging traits. By comparing the three DC models: full DC, no DC, and equal variance in GCTA-GREML42, we determined the DC status for each trait, which may be linked to the DC behaviors of effective genes in the early development. We proposed that the DC status can be adopted in the model for XWAS, and more significant variants can be identified for no DC traits compared with if a full DC model were used. Our research offers a detailed atlas of DC and an atlas of enrichment of X-linked heritability. And we identified 13 new trait-locus pairs in the NPR at a more reasonable genome-wide threshold accounting for the number of traits relative to the Bonferroni threshold. By further investigation, we found that the human brain measurements shared genetic co-architectures with educational attainment and various brain-related disorders, including autism spectrum disorder, bipolar disorder, major depressive disorder, and Parkinson’s disease. Notably, our data reveal sex-specific genetic association patterns, where each gender exhibits unique association signals, and for males, the NPR SNPs on the X-chromosome account for more phenotypic variance.
We discovered potential robust interactions between the X-chromosome and autosomes within the human brain. Traits favoring no DC displayed significantly larger X-linked heritability but diminished heritability from autosomes, compared to full DC traits. Consequently, the X-chromosome accounted for 11.5% of the total heritability for no DC traits, contrasting with only 6.57% for full DC traits (although it is still greater than the proportion of genomic base pairs located on the NPR of the X-chromosome, ∼5%). We postulate that the special feature of no DC traits is attributable to transcriptional, regulatory, and epigenetic processes in brain development31,33. For example, sex steroid receptors often signal through epigenetic actions114. Several epigenetic mechanisms, such as the levels of DNA methylation and acetylation, are sex-specific in the brain115. Recent studies have demonstrated that sex chromosomes can also induce sex differences in somatic gene expression in the absence of hormonal differences29. Further evidence indicates that some genes escaping XCI produce proteins that regulate chromatin structures, potentially influencing autosomal gene expression differences29. This includes the histone demethylases UTX and KDM5C116,117, the histone deacetylase 8118-120, and the histone acetyltransferase complex subunits male-specific lethal 3121 and mortality factor 4-like 2122. Such trans-modifications, which do not alter the nucleotide sequence, might not be reflected in the narrow-sense heritability, accounting for the reduced heritability ascribed to autosomes. In essence, our analysis offers insights into potential XCI escape at the trait level within the human brain.
The Xq28 genomic region was overly represented in association signals as it contains more than 40% of the identified protein-coding genes. A third of white matter tracts were linked to a compact 40kb band segment in Xq28 (152,876,000∼152,916,000). Moreover, many intellectual disabilities can be traced back to gene mutations in Xq28. For example, CLIC2 and VBP1 were related to the int22h-1/int22h-2-mediated duplication region in Xq28, believed to be a potential contributor to intellectual and developmental disability123-125. Loss-of-function mutations in MECP2 were associated with Rett syndrome126, which mainly affects brain development in girls. Conversely, in males, these mutations present a spectrum of clinical outcomes, from mild intellectual challenges to severe neonatal encephalopathy, and in some cases, premature death127. It is advisable to investigate the genetic co-architectures between the tracts as well as emphasize the exploration of the genetic origins of brain disorders in Xq28 in future studies.
In addition to sex-agnostic analyses, we systematically analyzed sex disparities in human brain characteristics, including phenotype, phenotypic variance, X-linked heritability, and genetic associations. We found that for most traits, males had both greater phenotypic variance and X-linked heritability than females, and more sex-specific associations can be identified in males. These results were concordant with the fact that one of the X-chromosomes is randomly silenced in females in most tissues and cells. We observed that genetic effects of some variants significantly differed between sexes, showing sex and variant interactions. Combined with the colocalization between brain measurements and sex-hormone related traits, such as testosterone levels and SHBG, we postulate that sex hormone plays an essential role in regulating human brain development and sexual dimorphism. However, verification of the hypothesis needs more data on transcriptome, proteome, and metabolome (termed as “multi-omics”128), which is currently barren for the X-chromosome. We earmark this line of inquiry for future research, emphasizing the necessity for both innovative methodologies and robust multi-omics data dedicated to the X-chromosome.
DATA AVAILABILITY
All UK Biobank data utilized in the study was acquired under application 22783. The eQTL summary statistics from the CAGE whole-blood study can be downloaded at https://cnsgenomics.com/content/data. All files to generate annotation used in H-MAGMA can be accessed at https://doi.org/10.5281/zenodo.5503876. The summary statistics generated by association analyses in the current study can be accessed at https://bigkp.org/.
CODE AVAILABILITY
All software and packages used in this study are publicly available. See the URLs and references cited. The code for generating specific results can be provided upon request.
WEB RESOURCES
GCTA (v1.93.2 beta, https://yanglab.westlake.edu.cn/software/gcta/#Overview); PLINK2 (v2.00a3LM, https://www.cog-genomics.org/plink/2.0/); METAL (v2020-05-05, https://genome.sph.umich.edu/wiki/METAL_Documentation); FUMA (v1.4.1, https://fuma.ctglab.nl); MAGMA (v1.08), and ANNOVAR (v2017-07-17) are embedded in FUMA; NHGRI-EBI GWAS
Catalog (2023.06, https://www.ebi.ac.uk/gwas/); SMR (https://yanglab.westlake.edu.cn/software/smr/); DAVID Bioinformatics Database (https://david.ncifcrf.gov); SynGO (https://www.syngoportal.org); H-MAGMA repository (https://doi.org/10.5281/zenodo.5503876).
AUTHOR CONTRIBUTIONS
Z.J., B.Z, and H.Z. designed the study. Z.J. analyzed the data. TF. L., X.W., TY.L., Y.Y., H.S., P.Y.G., J.C. processed the MRI data. L.S. carefully verified all statistical methods used in the study. P.F.S, Y.L., J.L.S., D.L., and H.Z. provided feedback on study design and results interpretations. Z.J. wrote the manuscript and made figures and tables with feedback from all authors.
COMPETING INTERESTS
The authors declare no competing interests.
METHODS
Image acquisition and processing
The raw structural MRI (sMRI), diffusion MRI (dMRI), resting-state functional MRI (rfMRI), and task-evoked functional MRI (tfMRI) raw images were acquired from the UK Biobank (http://www.ukbiobank.ac.uk/resources/) with application 22783. Detailed information for the image acquisition is available at https://biobank.ctsu.ox.ac.uk/crystal/crystal/docs/brain_mri.pdf. After processing the raw images, 2,822 imaging-derived traits for the human brain were utilized in the study. That is, 230 sMRI traits for cortical structures, 635 diffusion tensor imaging (DTI) traits from dMRI for microstructures of white matter tracts; and 1,957 rfMRI and tfMRI traits for intrinsic and extrinsic brain functions, respectively. For each trait and continuous covariate variable (discussed later), we removed values greater than five times the median absolute deviation from the median value.
We processed the sMRI locally using consistent procedures via advanced normalization tools (ANTs, http://stnava.github.io/ANTs) and conducted multi-atlas cortical parcellation based on the manually edited labels of the publicly available MindBoggle-101 dataset129. We removed three ROIs (5th ventricle, left, and right lesion) due to a high missing rate. More details can be found in ref38. There were 101 traits for regional BVs, including three global traits – gray matter volume (GMV), white matter volume (WMV), and total BV. We picked up 62 cortical ROIs and generated 62 regional traits for CV as well as the global mean CV. The 66 SA traits used in our analysis were directly downloaded from UKB Category 193. The traits were generated with Freesurfer (https://surfer.nmr.mgh.harvard.edu) by parcellation of the pial surface using Desikan-Killiany130 parcellation.
DTI evaluated dMRI in a tensor model and analyzed water molecular diffusions in all directions. Five metrics of DTI: Axial diffusivity (AD), fractional anisotropy (FA), mean diffusivity (MD), mode of anisotropy (MO), and radial diffusivity (RD) were applied to each voxel of the image. Given a metric, a tract-mean trait was generated by taking the average of all voxels in a tract. In total, we got 110 tract-mean traits, including 105 tract-mean traits for all tract-metric pairs and 5 overall-mean traits across all tracts (21*5 + 5 = 110). We also applied functional principal component analysis (FPCA) to the voxels in a tract and picked up the top five functional PCs for the tract-metric pair. We generated 525 (= 5*5*21) functional PC traits for all tracts and metrics. The five DTI metrics can reflect different patterns of water diffusion in white matter tracts. For example, AD is the eigenvalue of the principal direction; FA is related to directionality; MD quantifies the magnitude of absolute directionality; MO is the third moment of a tensor; and RD is the average of the eigenvalues of secondary diffusion directions. The tracts were labeled by the ENIGMA-DTI pipeline131,132. Check Table S1 for the full names of the 21 tracts, and ref39 for details of trait generation based on ENIGMA-DTI pipeline and FPCA.
We applied parcellation-based methods with Glasser36037 atlas to generate 90 mean amplitude and functional connectivity traits for both rfMRI and tfMRI. We first projected the rfMRI and tfMRI data on the Glasser360 atlas and generated 360×360 functional connectivity matrices. The 360 functional areas were grouped into 12 functional networks133. Then 12 mean amplitude traits and 78 (=12+11×122) mean pairwise functional connectivity traits were extracted from the 12 functional networks. Refer to the Supplementary Note in ref41 for detailed steps of the parcellation-based dimension reduction procedure. In addition, we locally used the whole brain spatial independent component analysis (ICA) approach to estimate functional brain regions for rfMRI. The detailed procedures were documented in UKB imaging pipeline134. We generated 76 node amplitude traits for spontaneous neuronal activity, 1,695 pairwise functional connectivity traits for coactivity for node pairs, and six global connectivity measures for all pairwise functional connectivity135. We also manually labeled the 76 node amplitude traits using the automated anatomical labelling atlas136 (refer to Table S24 in ref40) and then mapped them onto major functional networks137,138. The assigned location and functional networks are available in Table S1.
Discovery and replication data processing for association analyses
In X-chromosome association analysis (XWAS), we analyzed the UKB phase 1-3 imaging data (up to February 2020) for discovery purposes, encompassing 36,000 samples. For replication, we employed the phase 4 imaging data, which included 3,100 samples. We downloaded the version 3 of imputed genetic data from UKB. Details regarding genotyping and imputation are available in the UKB documentation. For data processing, we utilized PLINK252 (v2.00a3LM, https://www.cog-genomics.org/plink/2.0/) and treated each imaging trait set individually. Blow is a brief introduction to data preprocessing, for more details please refer to Supplementary Methods.
In our discovery data, we prioritized subjects of non-Hispanic white ancestries (Field 21000). Based on UKB-provided quality control details, we filtered out subjects based on specific criteria: excessive heterozygosity (Field ID 22027), inconsistencies between reported and genetic gender (Field ID 22001), potential sex chromosome anomalies (Field ID 22019), and a missing genotype rate exceeding 5%. We further refined our SNP data based on imputation score, minor allele frequency (MAF), and a Hardy-Weinberg equilibrium test. In addition, multiallelic sites were excluded. To address potential relatedness among subjects, we employed GCTA42 (v1.93.2 beta, https://yanglab.westlake.edu.cn/software/gcta/#Overview). We calculated the genetic relationship matrix (GRM) for each autosome and merged them. Subjects with a high degree of relatedness (--grm-cutoff 0.05) were pruned; about 1,800 subjects were excluded in this step.
The resulting discovery dataset consisted of 33,591 subjects, with a range of 29,078 to 35,793 across various imaging traits. This included 15,939 males and 17,652 females. For our analyses, 289,866 NPR SNPs and 11,508 PAR SNPs on the X-chromosome were considered. We did not impute the Y-chromosome genetic data, but after the above filters, 140 SNPs remained for analysis.
For replication, the genetic data encompassed UKB phase 4 non-Hispanic white subjects (UKBE, n = 4,181), phases 1-4 South Asian and Chinese subjects (UKBSAC, n = 462), and phases 1-4 African subjects (UKBA, n = 295). To optimize our sample size, we combined white subjects previously excluded from the discovery phase due to relatedness with phase 4 white subjects. Subsequently, we executed another round of relatedness pruning (--grm-cutoff 0.05). Both Asian and African subjects underwent relatedness pruning at the same threshold. All other quality control measures remained consistent with prior steps.
Dosage compensation and heritability analysis
We employed the GREML analysis tool from GCTA42 for heritability analysis on NPR SNPs. Three distinct model assumptions for GRMs on the X-chromosome are acknowledged: full DC (--dc 1), no DC (--dc 0), and equal variance (without specifying --dc)42. These models differ in their coding schemes between sexes, affecting genetic relationships. For instance, females are consistently coded as {0, 1, 2}. The full DC model codes males as {0, 2}, leading to double the genetic variance of females. In contrast, the no DC model codes males as {0, 1}, halving their genetic variance. The equal variance model codes males similarly to females in terms of genetic variance.
We produced GRMs for the X-chromosome under various assumptions to determine the optimal model for each trait. By default, we presumed a consistent allele frequency distribution between causal and genotyped SNPs, adjusting for imperfect LD (--grm-adj 0). Both GRMs for autosomes and the X-chromosome were included in one model to jointly estimate their respective heritabilities, as this method can identify more total heritability compared to analyzing them separately16.
For sMRI and dMRI traits, we accounted for various predictors like the indicator of phase 3 data (1 if the subject was released in phase3 and 0 otherwise), the UK Biobank assessment center (Field 54), genotype measurement batch (Field 22000), top 40 genetic principal components (Field 22009), age at imaging, age-squared, sex, age-sex interaction, and age-squared-sex-interaction. Additionally, for sMRI’s non-global traits, we adjusted for measurements like total BV, mean CT, and left/right total SA. For fMRI traits, we adjusted for head size (Field ID 25000), scan position X (Field ID 25756), scan position Y (Field ID 25757), scan position Z (Field ID 25758), scan table position (Field ID 25759), mean rfMRI head motion (Field ID 25741), and mean tfMRI head motion (Field ID 25742), as well as scan position X squared, scan position Z squared, mean rfMRI head motion squared and mean tfMRI head motion squared by following Alfaro-Almagro et al.139.
We employed the likelihood-ratio-test (LRT) with a specific null distribution  to assess the X-chromosome’s variance component. The significance of
  across traits was determined after adjusting for the false discovery rate (FDR) using the Benjamini-Hochberg procedure at an α = 0.05 level. The Akaike information criterion (AIC) was computed to compare the three model assumptions. We selected the model with the smallest AIC as the optimal DC model, subsequently creating an atlas of DC for complex brain imaging traits.
Enrichment analysis for heritability
Building on the methodology of Mallard et al.16, we characterized enrichment as the ratio of  to the proportion of genetic variants on the X-chromosome. Variant counts for each chromosome were sourced from the Genome Reference Consortium Human Build 37 (GRCh37 release 13), accessible at https://www.ncbi.nlm.nih.gov/assembly/GCF_000001405.13. Specifically, the measurement for
  enrichment is
  . We then tested if
  was enriched or depleted by using a two-sided Z-test with statistic
  , where expected
  , and standard error of
  was computed by using GCTA. After calculating the p-value from the Z-test, it was adjusted using FDR at the level α = 0.05. If the resulting Z-statistic for a trait exceeded 0, it indicated
  enrichment for that trait; if not,
  depletion.
Sex-stratified heritability and phenotypic variance analysis
We conducted a sex-stratified heritability analysis to directly contrast the  differences between males and females. Within the GREML framework, we accounted for the same covariates as in the sex-agnostic analysis, excluding sex and its related interactions. We adopted the equal variance model in GCTA for all traits. This model presumes males and females to have equivalent heritability. Any deviation of the ratio
  from 1 indicates evidence of full DC or no DC. For each DC group, we calculated average heritability estimates for both sexes and then derived the ratio
  , where p represents the number of traits with non-zero total heritability in sex-agnostic analysis (a total of 2,810). We used bootstrap methods (employing R’s “boot” function over 5,000 iterations) to determine the standard error of
  . The GCTA output provides the phenotypic variance, denoted as Vp for both sexes. We subsequently computed the phenotypic variance ratio for each trait as
XWAS, sex-stratified XWAS, and meta-analysis
We conducted linear association tests for NPR, PAR, and Y-chromosome SNPs using PLINK2 (v2.00a3LM). For traits favoring full DC or equal variance, we adopted the full DC model (--xchr-model 2); otherwise, we used the no DC model (--xchr-model 1). The direction of the effect size corresponded to the minor allele in the input data. However, the minor allele for a particular variant might differ between datasets. In the discovery analysis, we adjusted for the same covariates as in the heritability analysis. For replication, adjustments were made for phase 3 and phase 4 indicators, the UK Biobank assessment center, the top 10 genetic PC, and all other imaging-related covariates. We then adjusted the raw p-values using wild bootstrap across all traits (Supplementary Methods). SNPs achieving a genome-wide threshold of 5 × 10⁻⁸ were considered significant. For LD pruning, we used FUMA (v1.4.1, https://fuma.ctglab.nl/), incorporating both sexes for LD computation. SNPs in LD > 0.6 were grouped under one independent significant SNP. Those in LD > 0.1 were consolidated under a single top SNP. LD blocks defined by adjacent independent significant SNPs within 250kb of each other were merged into one genetic locus. For sex-stratified XWAS, we partitioned males and females in the discovery cohort and carried out separate XWAS for each. The covariate adjustments remained consistent, excluding sex and its interactions.
We employed a meta-analysis to integrate separate XWAS results using METAL (version released on 05.05.2020, https://genome.sph.umich.edu/wiki/METAL_Documentation). Inputs to the software included effect alleles, effect sizes, p-values, and sample sizes from individual analyses. The default procedure was adopted. Initially, p-values were transformed into Z-statistics. Then, to align all studies to a consistent reference allele, the effect alleles and the direction of the effect sizes were utilized. An overarching Z-statistic was derived by taking a sample-size weighted sum of each individual statistic. The weighting was based on the square root of the participant count in each study. In our research, the meta-analysis combined the outcomes of sex-stratified XWAS, replication XWAS from UKBE, UKBSAC, and UKBA cohorts, and both discovery and replication XWAS from UKBE participants.
Gene-level analysis and biological annotation
We executed a gene-based association analysis on 747 protein-coding genes on the X-chromosome using MAGMA (v1.08) within FUMA (v1.4.1). We employed GRCh37 to map SNPs to genes by their physical locations, excluding upstream and downstream regions from our consideration. A Bonferroni correction was applied for significance, factoring in both the number of genes and the effective number of independent traits92, resulting in a threshold of p-value < 0.05/747/230. For the phenotype matrix comprising 2,822 traits, we utilized singular value decomposition (SVD). The effective number was determined using the squared sum of the singular values (si) relative to the fourth power of their sum,  . Independent significant SNPs, along with SNPs in LD > 0.6 (including some not in XWAS but from the 1000G dataset), were passed to positional mapping (ANNOVAR140, version 2017-01-11), eQTL mapping (with reference database: CommonMind Consortium20, GTEx v8 brain79, BRAINEAC141), and 3D chromatin interaction mapping (built-in chromatin interaction data: adult cortex, fetal cortex, dorsolateral prefrontal cortex, and hippocampus142; annotate enhancer/promoter regions: E053-E082 (brain)). For biological annotation, we utilized the DAVID Bioinformatics Database106 (https://david.ncifcrf.gov/home.jsp) and SynGO (https://syngoportal.org/). Inputs for this annotation consisted of significant genes identified through the three functional mapping methods, with all other parameters retained as default.
H-MAGMA105 uses chromatin interaction profiles to map SNPs to the closest genes. We created an annotation file for the X-chromosome according to the protocol143 and applied MAGMA (v1.08) for H-MAGMA execution. While all necessary files were provided in the protocol, we made minor modifications to the R code to retain only the X-chromosome annotation.
Summary data-based Mendelian randomization (SMR)
The summary statistics of the XWAS and the summary statistics of eQTL analysis using CAGE whole-blood data provided by Sidorenko et al.44 were utilized in the SMR analysis. The genetic data in XWAS was used as a reference for LD estimation. There were 1,639 probes for genes in the NPR of the X-chromosome, and significant trait-gene pairs were identified by controlling FDR at 0.05 level. The significance indicates that the gene expression level may have a causal effect on the trait. Then we did the HEterogeneity In Dependent Instrument (HEIDI) test to distinguish the pleiotropy of causal SNPs from linkage for the significant trait-gene pairs. A non-significant result at the nominal level (p-value > 0.05) corresponds to no linkage effect and, thus, pleiotropy.
Sex differences in genetic effect
The sex difference in genetic effect of each NPR SNP was tested by a two-sided z-test. The null hypothesis is H0: βm = βf, where βm and βf are true per-allele genetic effects for males and females, respectively. We coded males {0, 2} for a full DC trait, and {0, 1} for a no DC trait while always coded females {0, 1, 2}. The test statistic was
 regardless of assumption of DC, where b is a genetic effect estimate, se is the corresponding standard error. Both b and se were adjusted for each sex’s trait standard deviation, which was determined by the square root of the phenotypic variance. This was achieved by dividing the original SNP effect size and its standard error by the trait’s standard deviation.
Differences in genetic profiles between subjects classified by phenotypic quantiles
We initially segregated the data by sex due to significant confounding effects from sex-related phenotypic differences. For every trait, we calculated both the upper and lower 10th percentile scores. Using these scores, we then selected subjects based on their quantile rankings. For instance, with a specific set of traits (e.g., RBV), if a subject’s scores for over 25% of the traits surpassed the upper 10th percentile for those traits, that subject was categorized into the “upper outlier” group. Conversely, if a subject’s scores for more than 25% of the traits fell below the lower 10th percentile, they were placed in the “lower outlier” group. We then extracted the genetic profiles of these subjects using PLINK2 (--geno-counts). Male genetic profiles were coded as 0 or 2, while female profiles were coded as 0, 1, or 2. We employed Fisher’s exact test to compare genetic profiles between the “upper outlier” and “lower outlier” groups for each sex.
ACKNOWLEDGEMENTS
Research reported in this publication was partially supported by the National Institute On Aging (NIA) of the National Institutes of Health (NIH) under Award Number RF1AG082938 (H.Z. and B.Z) and NIH MH116527 (TF.L. and H.Z.). The content is solely the responsibility of the authors and does not necessarily represent the official views of the National Institutes of Health. We thank the individuals represented in the UKB study for their participation and the research teams for their work in collecting, processing and disseminating these datasets for analysis. We would like to thank University of North Carolina at Chapel Hill and the Research Computing groups for providing computational resources and support that have contributed to the research results. This research has been conducted using the UK Biobank resource (application number 22783), subject to a data transfer agreement. The UKB has obtained ethics approval from the North West Multi-Centre Research Ethics Committee (MREC, approval number: 11/NW/0382), and obtained written informed consent from all participants prior to the study.
REFERENCES
- 1.↵
- 2.↵
- 3.↵
- 4.↵
- 5.↵
- 6.↵
- 7.↵
- 8.↵
- 9.↵
- 10.↵
- 11.
- 12.↵
- 13.↵
- 14.↵
- 15.
- 16.↵
- 17.↵
- 18.↵
- 19.
- 20.↵
- 21.↵
- 22.↵
- 23.↵
- 24.↵
- 25.↵
- 26.↵
- 27.↵
- 28.↵
- 29.↵
- 30.↵
- 31.↵
- 32.↵
- 33.↵
- 34.↵
- 35.↵
- 36.↵
- 37.↵
- 38.↵
- 39.↵
- 40.↵
- 41.↵
- 42.↵
- 43.↵
- 44.↵
- 45.↵
- 46.↵
- 47.↵
- 48.↵
- 49.↵
- 50.↵
- 51.↵
- 52.↵
- 53.↵
- 54.↵
- 55.↵
- 56.↵
- 57.
- 58.↵
- 59.↵
- 60.↵
- 61.↵
- 62.↵
- 63.↵
- 64.↵
- 65.↵
- 66.↵
- 67.↵
- 68.↵
- 69.↵
- 70.↵
- 71.
- 72.↵
- 73.↵
- 74.↵
- 75.↵
- 76.↵
- 77.↵
- 78.↵
- 79.↵
- 80.↵
- 81.↵
- 82.↵
- 83.
- 84.
- 85.
- 86.↵
- 87.↵
- 88.↵
- 89.↵
- 90.↵
- 91.↵
- 92.↵
- 93.↵
- 94.↵
- 95.↵
- 96.↵
- 97.↵
- 98.↵
- 99.↵
- 100.↵
- 101.↵
- 102.↵
- 103.↵
- 104.↵
- 105.↵
- 106.↵
- 107.↵
- 108.↵
- 109.↵
- 110.↵
- 111.↵
- 112.↵
- 113.↵
- 114.↵
- 115.↵
- 116.↵
- 117.↵
- 118.↵
- 119.
- 120.↵
- 121.↵
- 122.↵
- 123.↵
- 124.
- 125.↵
- 126.↵
- 127.↵
- 128.↵
- 129.↵
- 130.↵
- 131.↵
- 132.↵
- 133.↵
- 134.↵
- 135.↵
- 136.↵
- 137.↵
- 138.↵
- 139.↵
- 140.↵
- 141.↵
- 142.↵
- 143.↵


