
Abstract
Objective The growing number of Coronavirus Disease-2019 (COVID-19) survivors who are affected by Post-Acute Sequelae of SARS CoV-2 infection (PACS) represent a worldwide public health challenge. Yet, the novelty of this condition and the resulting limited data on underlying pathomechanisms so far hampered the advancement of effective therapies. Using electronic health records (EHR) data, we aimed to characterize PASC-associated diagnoses and to develop risk prediction models.
Methods In our cohort of 63,675 COVID-19 positive patients seen at Michigan Medicine, 1,724 (2.7 %) had a recorded PASC diagnosis. We used a case control study design comparing PASC cases with 17,205 matched controls and performed phenome-wide association studies (PheWASs) to characterize enriched phenotypes of the post-COVID-19 period and potential PASC pre-disposing phenotypes of the pre-, and acute-COVID-19 periods. We also integrated PASC-associated phenotypes into Phenotype Risk Scores (PheRSs) and evaluated their predictive performance.
Results In the post-COVID-19 period, cases were significantly enriched for known PASC symptoms (e.g., shortness of breath, malaise/fatigue, and cardiac dysrhythmias) but also many musculoskeletal, infectious, and digestive disorders. We found seven phenotypes in the pre-COVID-19 period (irritable bowel syndrome, concussion, nausea/vomiting, shortness of breath, respiratory abnormalities, allergic reaction to food, and circulatory disease) and 69 phenotypes in the acute-COVID-19 period (predominantly respiratory, circulatory, neurological, digestive, and mental health phenotypes) that were significantly associated with PASC. The derived pre-COVID-19 PheRS and acute-COVID-19 PheRS had low accuracy to differentiate cases from controls; however, they stratified risk well, e.g., a combination of the two PheRSs identified a quarter of the COVID-19 positive cohort at a 3.5-fold increased risk for PASC compared to the bottom 50% of their distributions.
Conclusions Our agnostic screen of time stamped EHR data uncovered a plethora of PASC-associated diagnoses across many categories and highlighted a complex arrangement of presenting and likely pre-disposing features – the latter with a potential for risk stratification approaches. Yet, considerably more work will need to be done to better characterize PASC and its subtypes, especially long-term consequences, and to consider more comprehensive risk models.
Introduction
Coronavirus Disease-2019 (COVID-19) has posed unprecedented challenges to the public health and healthcare system. As of September 30, 2022, there were 96,158,524 confirmed COVID-19 cases in the US [1]. Studies suggest that 20 to 40% of COVID-19 survivors may be affected by Post-Acute Sequelae of COVID-19 (PASC) [2-4] — also termed Post COVID conditions (PCC), [5, 6], Long COVID [7], Post-Acute COVID-19 Syndrome (PACS) [8], Chronic COVID-19 Syndrome [9], and Long Haul COVID-19 [10]. PASC is an aggregate term for a highly heterogeneous group of post-COVID-19 problems, including persistent symptoms of acute infection (e.g., cough, fatigue, loss of smell [11-13]), new chronic disorders, (e.g., chronic lung or neurologic disease [3, 14-21]), and late post-COVID complications (e.g., autoimmune complications). COVID-19 vaccinations might decrease the risk for PASC by 13% - 22% [22, 23]; however, with a massive number of breakthrough infections and a relaxation of mitigation measures across the world, the high prevalence of PASC during an ongoing pandemic might present a tremendous burden for healthcare systems worldwide.
Several demographic factors, pre-existing conditions, and biomarkers have been associated with PASC. For example, severe acute COVID-19, female sex, older age, pre-existing diabetes, or the experience of specific symptoms during the acute COVID-19 phase, including fatigue, headache, hoarse voice, etc., were reported to increase the risk for PASC [24-27]. Carlo et al. reported an immunoglobulin (Ig) signature, based on total IgM and IgG3, to be a predictor for PASC [28]. Emily et al. identified a series of features including the rate of health care utilization, patient age, dyspnea, and other diagnosis and medication information to be predictive of PASC [29]. In Su et al.’s study four risk factors: type 2 diabetes, SARS-CoV-2 RNAemia, Epstein-Barr virus viremia, and specific auto-antibodies were identified [30].
Together these studies highlight the possibility but also the need to uncover and understand PASC risk factors with the goal to identify and protect vulnerable individuals. Furthermore, a better understanding of PASC might allow the identification of PASC subtypes and their specific risk profiles. Yet, the novelty of this condition and the sparsity of studies has so far hampered the development of risk-prediction models for PASC.
In our current study we aim to fill this gap by identifying PASC pre-disposing diagnoses through phenome-wide association studies (PheWAS) of the pre-COVID-19 and acute-COVID-19 time periods and then use the identified pre-existing conditions to develop and evaluate integrated and usable Phenotype Risk Scores (PheRS) [31] for predicting PASC [32, 33]. To do this, we leverage a cohort of over 60,000 COVID-19 positive patients cared for at Michigan Medicine (MM), a large academic medical center in the Midwestern US, between March 2020 and August 2022. This cohort includes 1,724 patients that were subsequently diagnosed with PASC using diagnostic codes or clinical problem lists. Together with its rich retrospective EHR data that includes socioeconomic status (SES), demographics, and other relevant variables, this cohort offers a unique opportunity to study PASC.
Subjects and Methods
Study cohort
Eligible individuals included patients of Michigan Medicine (MM), who had a recorded COVID-19 diagnosis or a positive real-time reverse transcriptase chain (RT-PCR) test for SARS-CoV-2 infection performed / recorded at MM between March 10, 2020, and August 31, 2022. Diagnoses were recorded at clinic visits and hospital encounters. RT-PCR testing data was collected for routine screening at hospital admission, prior to procedures, and for employee screening. Tests included both symptomatic and asymptomatic individuals.
For each subject, the date of their first COVID-19 diagnosis or RT-PCR positive test, whichever came first, was considered the index date. Dates were considered protected health information and operationalized as days since birth; however, the quarter of the year of the index date was obtained. To allow sufficient follow-up time for diagnosing PASC, we limited the analysis to patients who had one encounter at MM at least 2 months after being COVID-19 positive. PASC cases (see definition below) without a prior positive test were excluded, because the timepoint of the test was crucial for defining the pre-COVID-19 and acute-COVID-19 time periods (Figure 1).
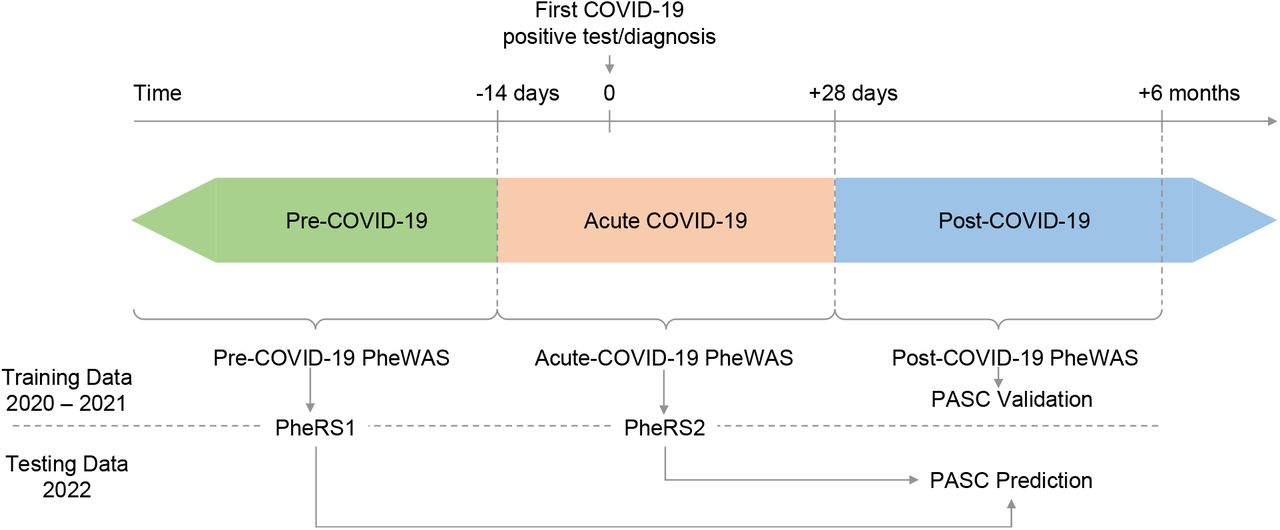
Three time periods were defined relative to the 1. positive COVID-19 test or diagnosis (index date): pre-COVID-19 until -14 days, acute-COVID-19 from - 14 to +28 days, and post-COVID-19 from +28 days onwards. The post-COVID-19 PheWAS is used to validate features of PASC cases compared to COVID-19 cases without PASC diagnoses. The Pre-COVID-19 and acute-COVID-19 PheWAS on the training data (index date in 2020 – 2021) inform on phenotype risk scores (PheRS) that will be used to predict PASC in the testing data (index date in 2022).
We further stratified the remaining COVID-19 positive patients in patients with a recorded diagnosis for a Post-Acute Sequelae of SARS CoV-2 infection (PASC) and in patients without any recorded PASC diagnosis (“no PASC”).
PASC diagnoses were either based on an entry of PASC in the diagnosis section of the EHR database’s Problem Summary List (PSL, Table S1) or on observations of the ICD-10-CM codes U09.9 (“Post COVID-19 condition, unspecified”) or B94.8 (“Sequelae of other specified infectious and parasitic diseases”). The latter was recommended by the CDC as a temporary alternative to the PASC-specific U09.9 code which was implemented on October 1, 2021 [34]. PSL diagnoses represent both active and resolved patient problems entered by health care providers. The age at the first observed ICD- or PSL-based PASC diagnosis was considered the age of onset of PASC.
We also categorized PASC patients based on ICD10 diagnoses that were concurrently recorded with their first PASC diagnosis and that mapped to 29 phenotype concepts previously reported as common PASC symptoms [3]. In addition, we manually mapped detailed PSL diagnoses to these 29 PheCodes (Table S1 and S2).
Definition of demographics, socioeconomic status, and other covariates
To examine and adjust for confounding by patient characteristics, socioeconomic status and other variables, we obtained the following data for each participant: age, self-reported gender, self-reported race/ethnicity, Neighborhood Disadvantage Index (NDI) without proportion of Black (coded as quartiles, with larger quartiles representing more disadvantaged communities) [35, 36], and population density measured in persons per square mile (operationalized as quartiles).
Additional covariates included vaccination status, the Elixhauser comorbidity score [37, 38], COVID-19 severity (non-severe [not hospitalized] and severe [hospitalized or deceased]), health-care worker (HCW) status, time span of records in the EHR before and after the COVID-19 test/diagnosis, time span of records in the EHR before 2020 (referred to as “pre-pandemic” time period). These time spans were based on the first or last recorded encounter in the EHR data. Additional details and definitions of these covariates can be found in Text S1 and Table S3.
We assumed completely at random missingness of the covariates included in our adjusted analyses and performed complete case-analyses for each adjustment.
Ethical review and approval were waived for this study due to its qualification for a federal exemption as secondary research for which consent is not required. Determination for exemption made by the University of Michigan Medical School Institutional Review Board (IRBMED) (study ID: HUM00180294).
Time-restricted phenomes
We constructed each subject’s medical phenome by extracting available International Classification of Diseases (ICD; ninth and tenth editions) codes from the EHR and mapping them to 1,813 broader phenotype concepts (PheCodes) using the R package “PheWAS” [39, 40]. In short, individuals with ICD codes that map to a specific PheCode were coded as “1”, then individuals with ICD codes that map to the PheCode’s specific exclusion criteria were coded as missing and finally all remaining individuals were coded as “0” for that specific PheCode (further details are described elsewhere [40]). We applied time thresholds to create various versions of medical phenomes: a post-COVID-19 phenome (PheCodes recorded between 28 days and 6 months after the index date), a pre-COVID-19 phenome (PheCodes recorded at least 2 weeks before the index date [first positive COVID-19 test/diagnoses]), and acute COVID-19 phenome (PheCodes recorded between -14 and +28 days relative to the index date; Figure 1).
Matching
To minimize confounding when we compare PASC (case) versus no PASC (control) we matched each PASC COVID-19 patient to up to 10 “No PASC” COVID-19 patients using the R package “MatchIt” [41]. Nearest neighbor matching was applied for age at index date, pre-COVID-19 years in EHR and post-COVID-19 years in EHR. Exact matching was applied for sex, primary care visit at Michigan Medicine within the last 2 years (yes/no), race/ethnicity, and year quarter of the index date. We retained the case-control matching throughout all analyses.
Statistical analysis
PASC associated PheCodes in Post COVID-19 Period
To characterize diagnoses enriched in COVID-19 patients with PASC, we also conducted PheWAS to identify phenotypes associated with PASC in the post-COVID-19 period (at least 28 days after the COVID-19 index date, see Figure 1) using Firth bias-corrected logistic regression by fitting the following model for each PheCode of the post-COVID-19 period phenome:
 Where covariates were pre-COVID-19 Elixhauser Score (AHRQ), NDI, Population density, HCW, vaccination status, and severity. Details are summarized in Table S3.
Pre-disposing PheCodes
We conducted PheWAS to identify PheCodes pre-disposing to PASC using either PheCodes from the pre-COVID19 period or PheCodes from the acute-COVID-19 period. We conducted Firth bias-corrected logistic regression by fitting the following model for each PheCode of the corresponding time-restricted phenome:
 We applied a similar set of covariate adjustments as before (Table S3).
The phenomes were split into a training set, individuals who were COVID-19 positive in 2020 and 2021 and a testing set, individuals who tested positive or were diagnosed for COVID-19 in 2022. This choice was to retain the true spirit of future prediction using past data. The training set was used to identify pre-disposing PheCodes in phenome-wide association studies (PheWAS), while the testing set was used to evaluate prediction models based on the PheWAS results.
To evaluate the robustness of effect sizes of pre-disposing PheCodes we performed several sensitivity analyses across subsets defined by (retaining the case-control matching): (1) females only, (2) males only, (3) COVID-19 index date in 2020, (4) COVID-19 index date in 2021, (5) those who experience non-severe COVID-19-related outcomes, (6) severe COVID-19 related outcomes; and with additional time-thresholds: For Pre-COVID-19 PheWAS (7) PheCodes recorded within 2 years before the index date, and (8) PheCodes recorded before the COVID-19 pandemic (before 2020). For the acute-COVID-19 PheWAS we excluded PASC cases whose first recorded PASC diagnosis was observed less than 28 days after the index date. The sample sizes of the complete case analyses for various analyses are listed in Table S4.
PheWAS analyses were restricted to phecodes of a phenome that occurred at least 5 times among PASC cases as well as among “No PASC” COVID-19 cases. For all PheWAS, we excluded PheCode 136 “Other infectious and parasitic diseases” as it included the ICD-10 code “B94.8” which was used to record a PASC diagnosis.
To adjust for multiple testing, we applied the conservative phenome-wide Bonferroni correction according to the total number of analyzed PheCodes (Table S4). In Manhattan plots, we present –log10 (p-value) corresponding to tests for association of the underlying phenotype. Directional triangles on the PheWAS plot indicate whether a trait was positively (pointing up) or negatively (pointing down) associated.
We also tested for difference between effect sized of three subgroup comparisons (non-severe vs. severe outcome, female vs. male and infected in 2020 vs. infected in 2021) using the following t-statistics:
 where β A and β B are the subgroup-specific beta-estimates with corresponding standard errors SE(β A) and SE(β B).
Phenotype Risk Scores (PheRS)
PheRS Generation
To generate PheRS, we considered two sets of PheCodes: PheCodes that were phenome-wide significant in the pre-COVID-19 PheWAS (considered for the pre-COVID-19 PheRS [PheRS1]) or PheCodes that were phenome-wide significant in the acute-COVID-19 phenome (considered for the acute-COVID-19 PheRS [PheRS2]).
For each of the two sets of PheCodes, we performed ridge penalized logistic regression using the R Package package “glmnet” [42, 43] to obtain the weights per PheCode from the training data before calculating the PheRS as the weighted sum of the presence/absence (coded as 1 and 0) of a PheCode in the testing data.
PheRS Evaluation
To evaluate each of the PheRS, we fit the following Firth bias-corrected logistic regression model adjusting for age, gender, race/ethnicity, Elixhauser Score, population density, NDI, HCW, vaccination status, pre-COVID19 years in EHR and severity using a complete case analysis:
 For each PheRS, we assessed the following performance measures relative to the PASC status: (1) overall performance with Nagelkerke’s pseudo-R2 using R packages “rcompanion” [44], (2) accuracy with Brier score using R package “DescTools” [45]; and (3) ability to discriminate between PASC cases and matched controls as measured by the area under the covariate-adjusted receiver operating characteristic (AROC; semiparametric frequentist inference) curve (denoted AAUC) using R package “ROCnReg” [46]. Firth’s bias reduction method was used to resolve the problem of separation in logistic regression (R package “brglm2”) [47]
To also evaluate models with both predictors (PheRS1-Ridge + PheRS2-Ridge), we combined them by first fitting a logistic regression with the predictors in the training set to obtain the linear predictors that we used to obtain the combined score in the testing data.
Unless otherwise stated, analyses were performed using R 4.2.0 [48].
Results
Patient characteristics
Among 63,675 COVID-19 positive patients who were seen in MM at least two months after their first COVID-19 diagnosis or positive RT-PCR test, 1,724 (2.7%) received a PASC diagnosis. The prevalence of clinically diagnosed PASC within 3 months of testing positive for COVID-19 ranged from 0.18% (Q3 of 2020) to 1.8% (Q3 of 2021). The highest quarterly number of PASC cases was observed in Q4 of 2021 (n = 134), coinciding with the second peak of individuals who tested positive at MM (Table 1; Figure S1).
Patient characteristics of COVID-19 patients with (cases) and without observed PASC diagnosis (controls). Case control matching was based in nearest neighbor matching (age at index date, pre-test years in EHR, post-test years in EHR) and exact matching (gender, primary care at MM, race/ethnicity, quarter of year at COVID-19 index date).
We observed that PASC cases compared to controls were on average older at their index date (mean age 47.9 versus 41.7 years), had a slightly longer timespan covered in the pre-test EHRs (11.7 versus 10.4 years), were more likely female (64.5% versus 56.7%), more likely to have received primary care at MM in the last 2 years (60.7% versus 46.4%) and showed different distributions across the year quarters over time (Table 1).
PASC symptoms / post-COVID-19 PheWAS
We used the concurrent diagnoses at the time of the first PASC diagnosis to categorize cases into 29 subtypes of PASC that were previously reported [3] (Table S2). Among the 1,362 cases with concurrent diagnoses (362 of the 1,724 cases had no concurrent diagnoses), the ten most common diagnoses were: shortness of breath (34.3%), anxiety (30.6%), malaise and fatigue (28.5%), depression (27.2%), sleep disorders (25.4%), asthma (23.6%), headaches (21.4%), migraine (13.8%), cough (13.0%) and joint pain (12.6%) (Table S5).
To formally quantify the enrichment of these post-COVID-19 diagnoses among PASC cases compared to controls, we performed a phenome-wide association study (PheWAS) on diagnoses recorded in the post-COVID-19 period (i.e., between 28 days and 6 months after first being positive COVID-19) comparing 1,256 cases versus 12,492 matched controls. Among the 29 analyzed PASC symptoms (Table S2), all were enriched (OR > 1) of which 27 reached phenome-wide significance (P < 0.05/960 tested PheCodes; P < 5.2e-05) while 2 were not significant (Table S6).
Besides the significant enrichment of these and related diagnoses previously reported for PASC (e.g., shortness of breath: OR = 9.03 [7.77, 10.50], P = 2.94E-181; malaise and fatigue: OR = 6.17 [5.33, 7.14], P = 2.32E-132; and cardiac dysrhythmias: OR = 2.75 [2.37, 3.18], P = 3.95E-41), the PheWAS also indicated enrichment of many additional diagnoses, among others musculoskeletal disorders (e.g., costochondritis: OR = 6.88 [95%: 3.05, 14.8], P = 6.72e-08), infectious diseases (e.g., septicemia: OR = 2.31 [1.66, 3.16] P = 2.67e-07), and digestive disorders (e.g., GERD: OR = 1.72 [1.50, 1.99], P = 5.10e-14) (Figure 2, File S1A).

PheWAS on symptoms that occurred between 28 days and 6 months after the first COVID-19 test (Outcome: post-COVID-19 symptoms / phecodes; predictor: PASC diagnosis yes/no). Among phecodes that reached phenome-wide significance (red dashed line, P <= 0.05/960 = 5.2e-05) only the strongest association per PheCode category was labeled. The analysis was adjusted using the following covariates: age at key date, gender, race/ethnicity, Elixhauser Score AHRQ, population density (quartiles), NDI (quartiles), health care worker status, vaccination status, post-test years in EHR, and severity. Summary statistics can be found in File S1.
Pre-COVID-19 PheWAS
To identify potential pre-COVID-19 conditions that predispose COVID-19 cases to PASC, we performed a PheWAS using only diagnoses that were recorded at least 2 weeks before being COVID-19 positive and comparing 1,212 cases versus 11,919 matched controls.
Among 1,405 tested PheCodes, seven reached phenome-wide significance (P < 3.56e-05): irritable bowel syndrome (IBS; OR = 1.78 [1.44, 2.18], P = 4.00e-8), concussion (OR = 1.95 [1.51, 2.49], P = 1.24e-07), nausea and vomiting (OR = 1.45 [1.26, 1.67], P = 2.90e-07), shortness of breath (OR = 1.51 [1.29, 1.76] 3.38e-07), respiratory abnormalities (OR = 1.39 [1.22, 1.59], P = 1.10e-06), allergic reaction to food (OR = 1.94 [1.42, 2.60], P = 1.66e-05) and general circulatory disease (OR = 1.52 [1.24, 1.85], P = 3.30e-05; Figure 3, File S1B).

PheWAS on symptoms that occurred at least 14 days before the first positive COVID-19 test (Outcome: PASC diagnosis yes/no; predictors: phecodes). Among phecodes that reached phenome-wide significance (red dashed line, P <= 0.05/1404 = 3.56e-05) only the strongest association per PheCode category was labeled. The analysis was adjusted using the following covariates: age at index date, gender, race/ethnicity, Elixhauser Score, population density (quartiles), NDI (quartiles), health care worker status, vaccination status, pre-test years in EHR, and severity. Summary statistics can be found in File S1.

Acute-COVID-19 PheWAS on symptoms that occurred between -14 and +28 days relative to testing positive for COVID-19 (Outcome: acute-COVID-19 symptoms / phecodes; predictor: PASC diagnosis yes/no). Among phecodes that reached phenome-wide significance (red dashed line, P <= 0.05/663 = 7.5e-05) only the strongest association per PheCode category was labeled. The analysis was adjusted using the following covariates: age at index date, gender, race/ethnicity, Elixhauser Score AHRQ, population density (quartiles), NDI (quartiles), health care worker status, vaccination status, post-test years in EHR, and severity. Summary statistics can be found in File S1.
Additional sensitivity analyses indicated overall robustness of the observed associations across various settings (females only, males only, 2020 only, 2021 only, non-severe acute COVID-19, severe COVID-19, limiting to the last 2 years of pre-existing conditions, or pre-pandemic conditions, Figures S3 A-G, File S1D-F).
Acute-COVID-19 PheWAS
To identify symptoms of the acute-COVID-19 period, we performed another PheWAS this time only using diagnoses that were recorded between -14 to + 28 days relative to the index date. To not identify actual PASC symptoms compared to pre-PASC symptoms, we excluded cases whose PASC diagnosis was recorded less than 28 days after their index date and only retained their matched controls. In this PheWAS we compared 874 cases with 8,671 controls and among 664 analyzed PheCodes identified a total of 69 significantly associated PheCodes (P < 7.54e-05). The associated 69 PheCodes included among others 22 respiratory phenotypes (e.g., shortness of breath, respiratory failure/insufficiency/arrest, dependence on respirator or supplemental oxygen, and cough), 13 circulatory system phenotypes (orthostatic hypotension, hypotension), 7 neurological phenotypes (e.g., sleep disorder, migraine, pain), 6 digestive phenotypes (e.g., GERD, IBS), 5 mental health phenotypes (e.g., anxiety, depression), and other symptoms (e.g., malaise and fatigue, myalgia and myositis). (Figure 4, File S1C).
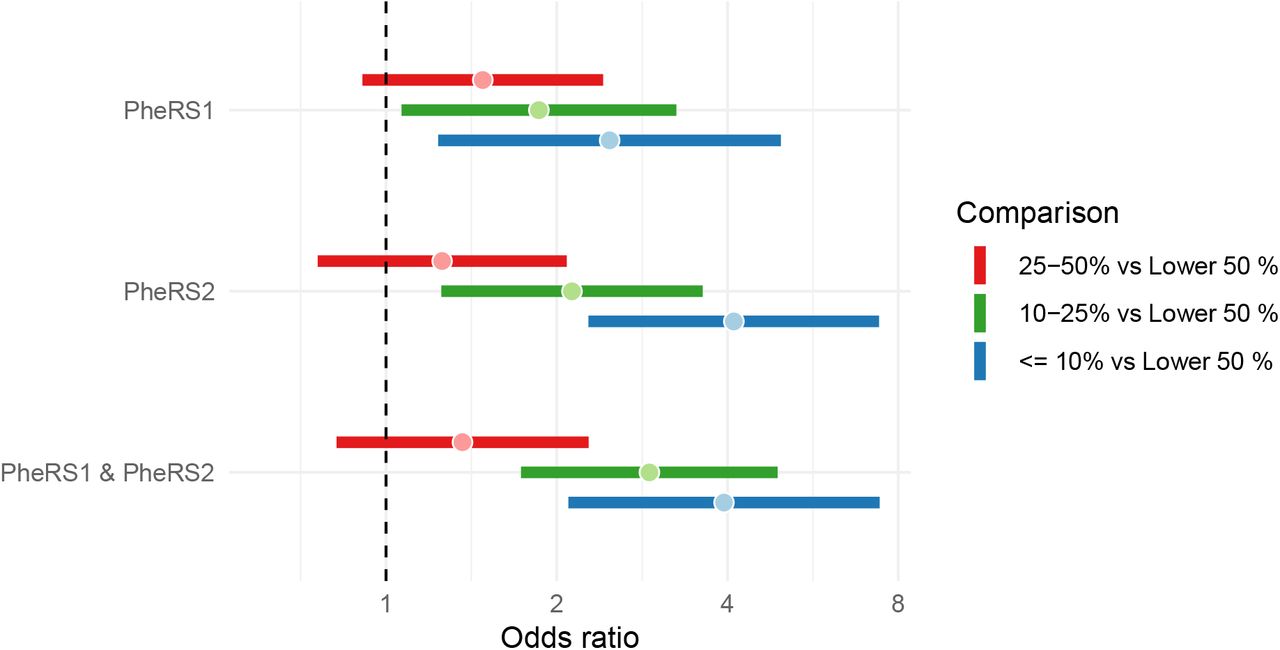
PheRS-based risk stratification in the testing data. Enrichment of PASC cases in risk bin compared to lower 50% for three top risk bins of PheRS1, PheRS2, and the combination of the two PheRS. Analysis is based on COVID-19 positive individuals in 2022 with at least 28 days between first COVID-19 and first PASC diagnosis; 123 cases and 1154 controls. Odds ratios (dots) and their 95% confidence intervals (horizontal bars) are shown. Analyses were adjusted for age at index date, gender, race/ethnicity, Elixhauser Score, population density, NDI, health care worker status, vaccination status, pre-test years in EHR, and severity (see also Table 3).
Again, our sensitivity analyses indicated overall robustness of the observed associations across various settings (females only, males only, 2020 only, 2021 only, non-severe acute COVID-19, severe COVID-19), i.e., most associations remained nominally significant in each sub analyses or had overlapping confidence intervals in their sensitivity analyses, though effect sizes were not as consistent (Figures S4 A-AK, File S1G-I). Most notable was a significant effect size difference for shortness of breath between the individuals who had a COVID-19 infection 2020 compared to 2021 (COVID-19 infection in 2020: OR = 2.20 [1.60, 2.99], P = 7.8e-7 compared to COVID-19 infection in 2021: OR = 4.59 [3.62, 5.81], P = 9.37e-37; PDifference = 0.000234), though they were significantly associated with PASC in both years (Figure S4AA, File S1C&I). Despite the relatively low numbers of analyzed individuals with severe outcomes (160 PASC cases and 150 controls), six of the 69 significantly associated phenotypes of the acute-COVID-19 period only had sufficient observations in individuals with severe outcomes but were underrepresented and not tested in the much larger group of individuals with non-severe outcomes (724 PASC cases and 6799 controls; Table S4 and File S1C&G). This suggested that these six phenotypes (aspergillosis, bacterial pneumonia, MRSA pneumonia, hyperosmolality and/or hypernatremia, septic shock, and voice disturbances) might be hospital-acquired complications. None of the 49 significantly associated phenotypes that were tested among individuals with non-severe outcomes and individuals with severe outcomes showed significant effect size differences (Pdifference >= 0.001 [0.05/49 tests]). All phenotypes with nominal effect size differences (Pdifference < 0.05) were all strongly and positively associated in individuals with non-severe outcomes, thus unlikely to merely represent hospital-acquired complications (File S1G).
Comparison of “pre-PASC” associated PheCode across three PheWAS
To investigate whether the PASC associated phenotypes of the pre- and acute-COVID-19 periods (“pre-PASC” phenotypes) are causing novel PASC symptoms or if they themselves become long-term features that manifest as PASC, we explored their frequencies and their association signals across all three PheWAS (Figure S5). What stood out in these comparisons was that almost all associated “pre-PASC” phenotypes were also significantly enriched in the post-COVID-19 PheWAS. The only exceptions were “allergic reaction to food” of the pre-COVID-19 PheWAS and “candidiasis” and “inflammation and edema of the lung” in the acute-COVID-19 PheWAS though their ORs were all positive (File S1–3). Since many more acute-COVID-19 phenotypes than pre-COVID-19 phenotypes remain associated also as post-COVID-19 phenotypes, this finding suggests that some of the documented PASC diagnoses, or subtypes thereof, might represent short-term consequences of an acute infection and not necessarily PASC symptoms.
Developing Phenotype Risk Scores for Predicting PASC
The pre- and acute-COVID-19 PheWASs indicated pre-disposing conditions for PASC. To study if these conditions might be useful for predicting PASC among COVID-19 positives, we generated two PheRSs: a pre-COVID-19 PheRS “PheRS1” and an acute-COVID-19 PheRS “PheRS2”. We avoided overfitting by using PheWAS results and PheRS weights obtained from individuals who tested positive in the years 2020 or 2021, while the evaluations were performed in individuals who tested positive in 2022 (Figure 1, Figure S2 and File S1J). To limit the impact of potential hospital-acquired complications of an acute-COVID-19 infection, we excluded the six phenotypes that were only tested / observed in the individuals with severe outcomes (see “Acute-COVID-19 PheWAS” above).
We found that PheRS1 and PheRS2 both could discriminate cases and controls, yet only with low accuracy (AAUC < 0.7). PheRS1 performance was comparable in the full testing data (AAUCPheRS1 = 0.548 [95% CI: 0.516, 0.580]) and the testing data that was reduced to PASC cases that had at least 28 days between their index date and the PASC diagnosis (AAUCPheRS1 = 0.555 [95% CI: 0.496, 0.612]). PheRS2 was only analyzed in the latter data (AAUCPheRS2 = 0.605 [95% CI: 0.549, 0.663]), but performed better than PheRS1, which was also evident from its pseudo-R2 which was almost 5-fold higher (0.0116 and 0.0547, respectively). A combination score further improved discrimination of cases and controls but its accuracy remained low (AAUCCombined = 0.615 [0.561, 0.670]; Table 2). We also explored if PheRSs based on additional suggestively associated PheCodes (defined as P < 1E-3) could further improve prediction of PASC but found their individual or combined predictive ability slightly worse compared to the PheRSs that were based on phenome-wide significant hits (e.g., AAUCCombined = 0.601 [0.548, 0.658]; Table S8).
PheRS Evaluation in the testing data (COVID-19 positive in 2022). PheRS1 was based on the significant hits of the PheWAS with the pre-COVID-19 training data (1,256 cases and 11,674 controls; COVID-19 positive in 2020/2021) while PheRS2 was based on the significant hits of the PheWAS with the acute-COVID-19 training data (874 cases and 8,144 controls; COVID-19 positive in 2020/2021 & at least 28 days between first COVID-19 and first PASC diagnosis). Underlying weights can be found in File S2 and Table S8.
PheRS-based risk stratification in the testing data. Analysis is based on COVID-19 positive individuals in 2022 with at least 28 days between first COVID-19 and first PASC diagnosis; 123 cases and 1154 controls.
While the use for individual level prediction seemed very limited, we found that PheRS1 and PheRS2 both were able to significantly enrich PASC cases in their top 10% and top 10-25% risk bins compared to the lower 50% of their distributions (Table 3). For example, the individuals in the top 10% of the PheRS1 showed an almost 2.5-fold enrichment (OR = 2.48 [95% CI: 1.24, 4.97]) and the top 10% of the PheRS2 more than 4-fold enrichment of PASC cases (OR = 4.10 [2.28, 7.4]). Moreover, the combination of the two PheRSs further improved enrichment especially for in the top 10-25% risk bin compared to the lower 50% (PheRS1 and PheRS2 combined: OR = 2.91 [1.73, 4.90]) indicating that both PheRSs can individually or jointly identify a fourth of all COVID-19 cases with 100% increased risks for PASC (OR > 2.0).
Discussion
In this study, we used data from a relatively large cohort of COVID-19 positive individuals from MM, a single medical center, and applied a PheWAS approach across time-restricted phenomes to identify phenotypes that may predispose to PASC. We found 7 phenotypes (e.g., IBS, concussion, shortness of breath) of the pre-COVID-19 period and 69 phenotypes (predominantly respiratory and circulatory symptoms) of the acute-COVID-19 period to be significantly enriched among PASC cases. Most of them were also observed enriched among PASC cases in the post-COVID19 period indicating that some of these phenotypes might have become longer lasting or even chronic conditions. When incorporating these findings into PheRSs, we found that both the pre-COVID-19 PheRS and the acute-COVID-19 PheRS were able to predict PASC only with low accuracy among COVID-19 positive individuals, even when combined. However, both PheRSs could identify a quarter of the COVID-19 positive cohort that had an at least two-fold increased risk for PASC.
A comparison of our findings with previous studies confirmed many pre-existing conditions that predispose to PASC. For example, in the pre-COVID-19 period PheWAS, we identified several respiratory symptoms that predisposed to PASC, including shortness of breath and other respiratory abnormalities, findings that are consistent with previous works [15, 27, 49]. The literature on IBS as a pre-disposing diagnosis for PASC seems sparse; however there might be a connection between gut microbiota and the clinical course of COVID-19 [50] and a mediation of risk factors effects for COVID-19 [51, 52]. Similiarly little seems to be known of concussion as a pre-disposing diagnosis for PASC; yet, pre-existing cognitive risk factors like mild traumatic brain injury were reported as enriched among cognitive PASC cases compared to non-cognitive PASC patients [53]. Future studies are needed to substantiate our findings and to investigate how such pre-disposing diagnoses are related to PASC. In addition to the results from the pre-COVID-19 period conditions, our findings from the acute-COVID-19 period also accord with previous studies. Among the 69 PASC-associated phenotypes, the majority were respiratory symptoms and in line with previous reports (e.g., cough [54, 55], dyspnea [56], respiratory insufficiency [57]). Also, the identified muscle-related symptoms, including myalgia, malaise and fatigue, were supported by previous PASC studies [58, 59]. Similar to the findings of Xie et al., we found circulatory diseases to play an important role as a predisposing factor for PASC. While not all observed associations were previously reported, our sensitivity analyses indicated overall robustness across various settings [61, 62].
An overlap between the enriched symptoms in the three periods implies the possibility of PASC to be recurring symptoms of pre-existing conditions [17]. The difference of subsiding rate between cases and controls in some symptoms (e.g., respiratory symptoms) potentially indicates the development of chronic conditions [9, 63].
There are several limitations to our analysis. First, we focused on predisposing diagnoses and performed matching, incl. on age, gender and race/ethnicity to adjust for potential confounding; however, these demographic characteristics were previously implicated as pre-disposing factors [64-66]. So, while matching and adjusting for these covariates might have effectively increased the power to identify pre-existing phenotypes that increase the risk for PASC, we disregarded these demographic factors as PASC predictors. Future studies are needed to evaluate the combined contributions of these variables in more comprehensive prediction models. Second, although a clinical diagnosis of PASC was used, many of the reported symptoms are vague, unspecific, and subtle [67], and awareness about PASC only recently increased. This might lead to an underdiagnosis of PASC [68, 69]. For example, we only observed 2.7% PASC diagnosed patients in our COVID-19 positive cohort, which is far lower than PASC studies from the US which estimated a prevalence between 19% and 35% [70]. As a result, our predictions of PASC might be overly conservative. The available diagnosis codes for PASC lacked specificity to reliably stratify PASC cases into PASC subtypes. Future studies that incorporate natural language processing of clinical notes and that have larger sample sizes will likely improve the identification of PASC cases and subtypes [71]. Third, the analysis was restricted to the COVID-19 positive individuals who were also seen at MM during the pre-COVID-19 and the post-COVID-19 periods; due to this selection bias both cases and controls might be less healthy and older compared to randomly chosen COVID-19 positive individuals [72]. Moreover, it has been reported that around 15% - 40% of the confirmed COVID-19 population were asymptomatic [73, 74]. Using data from a health system caused our cohort to be enriched for symptomatic COVID-19 patients, while asymptomatic COVID-19 cases may be underrepresented. Such biases and omissions might limit the generalizability to the overall population. Although this study included a large size of COVID-19 patients, attention might be given to expanding and diversifying the collection and analysis of data.
Our study used a clinical definition of PASC. In addition to the commonly used ICD code U09.9 (“Post COVID-19 condition, unspecified”) or B94.8 (“Sequelae of other specified infectious and parasitic diseases”), we applied the information from the EHR internal problem list database (PSL, Table S1) to categorize PASC patients, which enabled us to collect patients whose diagnosis were recorded even before official ICD-10 recommendations/codes became available. The post-COVID-19 period PheWAS validated our PASC definition in that we enriched diagnoses consistent with subtypes of PASC that were previously reported (e.g., shortness of breath, neurological disorders, malaise, fatigue and dysphagia) [3, 71, 75]. Furthermore, given the benefit of rich retrospective EHR data, we could adjust for important confounders in our models, including race, Elixhauser comorbidity score, vaccination status, etc., that might have affected PASC outcomes. We expect that our approach and the resulting prediction models will improve over time with increasing sample sizes and by doing so will likely facilitate an earlier detection of PASC cases or improve risk stratification. Furthermore, a better characterization of PASC mechanism might inform on distinct PASC form that differ in their profiles of pre-existing conditions.
Conclusion
PASC represents a worldwide public health challenge affecting millions of people. While effective therapies for PASC are still in development [76-79], prediction and risk models can help to more reliably identify individuals at increased risk for PASC and its subcategories, and potentially inform preventive or therapeutic efforts.
The aim of the present research was to identify PASC pre-disposing diagnoses from the pre- and the acute-COVID-19 medical phenomes and to explore them as predictors for PASC. We identified known and potentially novel associations across various disease categories in both phenomes and could show that these phenotypes when aggregated into PheRSs have predictive properties for PASC, especially when considered for risk stratification approaches. Future studies might consider applying more complex non-linear models, like machine learning, to further improve prediction models. A next opportunity will be to incorporate additional, more complex data like laboratory measurements or medication data into such prediction models, as they have proven relevant for PASC but were not fully investigated yet [2, 80, 81]. The presented PheRS framework can also be adapted to explore alternative outcomes like survival and by doing so offer comprehensive insights into the long-term consequences of COVID-19.
Data Availability
Electronic Health Record Data cannot be shared publicly as a result of patient confidentiality. Summary statistics are contained in the supplementary material of the manuscript.
Acknowledgement
The authors acknowledge Precision Health at the University of Michigan, and the University of Michigan Medical School Data Office for Clinical and Translational Research for providing data storage, management, processing, and distribution services. This work does not represent the views of the US Government or the Department of Veterans Affairs. This material is based in part upon work supported by the National Institutes of Health/NIH (NCI P30CA046592 [LGF, BM]; NHLBI, K08HL155407 [AJA]), by the University of Michigan (UM-Precision Health Investigators Award U063790 [LGF]), and by the National Science Foundation under grant number DMS-1712933. Any opinions, findings, and conclusions or recommendations expressed in this material are those of the authors and do not necessarily reflect the views of the National Science Foundation.
References
- 1.↵
- 2.↵
- 3.↵
- 4.↵
- 5.↵
- 6.↵
- 7.↵
- 8.↵
- 9.↵
- 10.↵
- 11.↵
- 12.
- 13.↵
- 14.↵
- 15.↵
- 16.
- 17.↵
- 18.
- 19.
- 20.
- 21.↵
- 22.↵
- 23.↵
- 24.↵
- 25.
- 26.
- 27.↵
- 28.↵
- 29.↵
- 30.↵
- 31.↵
- 32.↵
- 33.↵
- 34.↵
- 35.↵
- 36.↵
- 37.↵
- 38.↵
- 39.↵
- 40.↵
- 41.↵
- 42.↵
- 43.↵
- 44.↵
- 45.↵
- 46.↵
- 47.↵
- 48.↵
- 49.↵
- 50.↵
- 51.↵
- 52.↵
- 53.↵
- 54.↵
- 55.↵
- 56.↵
- 57.↵
- 58.↵
- 59.↵
- 60.
- 61.↵
- 62.↵
- 63.↵
- 64.↵
- 65.
- 66.↵
- 67.↵
- 68.↵
- 69.↵
- 70.↵
- 71.↵
- 72.↵
- 73.↵
- 74.↵
- 75.↵
- 76.↵
- 77.
- 78.
- 79.↵
- 80.↵
- 81.↵


