
Abstract
Objective To examine whether SARS-CoV-2 reinfection risk has changed through time in South Africa, in the context of the emergence of the Beta, Delta, and Omicron variants
Design Retrospective analysis of routine epidemiological surveillance data
Setting Line list data on SARS-CoV-2 with specimen receipt dates between 04 March 2020 and 27 November 2021, collected through South Africa’s National Notifiable Medical Conditions Surveillance System
Participants 2,796,982 individuals with laboratory-confirmed SARS-CoV-2 who had a positive test result at least 90 days prior to 27 November 2021. Individuals having sequential positive tests at least 90 days apart were considered to have suspected reinfections.
Main outcome measures Incidence of suspected reinfections through time; comparison of reinfection rates to the expectation under a null model (approach 1); empirical estimates of the time-varying hazards of infection and reinfection throughout the epidemic (approach 2)
Results 35,670 suspected reinfections were identified among 2,796,982 individuals with laboratory-confirmed SARS-CoV-2 who had a positive test result at least 90 days prior to 27 November 2021. The number of reinfections observed through the end of the third wave was consistent with the null model of no change in reinfection risk (approach 1). Although increases in the hazard of primary infection were observed following the introduction of both the Beta and Delta variants, no corresponding increase was observed in the reinfection hazard (approach 2). Contrary to expectation, the estimated hazard ratio for reinfection versus primary infection was lower during waves driven by the Beta and Delta variants than for the first wave (relative hazard ratio for wave 2 versus wave 1: 0.75 (CI95: 0.59–0.97); for wave 3 versus wave 1: 0.71 (CI95: 0.56–0.92)). In contrast, the recent spread of the Omicron variant has been associated with a decrease in the hazard coefficient for primary infection and an increase in reinfection hazard coefficient. The estimated hazard ratio for reinfection versus primary infection for the period from 1 November 2021 to 27 November 2021 versus wave 1 was 2.39 (CI95: 1.88–3.11).
Conclusion Population-level evidence suggests that the Omicron variant is associated with substantial ability to evade immunity from prior infection. In contrast, there is no population-wide epidemiological evidence of immune escape associated with the Beta or Delta variants. This finding has important implications for public health planning, particularly in countries like South Africa with high rates of immunity from prior infection. Urgent questions remain regarding whether Omicron is also able to evade vaccine-induced immunity and the potential implications of reduced immunity to infection on protection against severe disease and death.
Box 1
What is already known on this topic
What is already known on this topic
Prior infection with SARS-CoV-2 is estimated to provide at least an 80% reduction in infection risk (1,2).
Laboratory-based studies indicate reduced neutralization by convalescent serum for the Beta and Delta variants relative to wild type virus (3–6); however, the impact of these reductions on risk of reinfection is not known, and laboratory assessments of Omicron are still underway.
What this study adds
What this study adds
We provide two methods for monitoring reinfection trends to identify signatures of changes in reinfection risk.
We find no evidence of increased reinfection risk associated with circulation of Beta or Delta variants compared to the ancestral strain in routine epidemiological data from South Africa.
In contrast, we find clear, population-level evidence to suggest substantial immune evasion by the Omicron variant.
One sentence summary Analysis of routine surveillance data from South Africa suggests that, in contrast to the Beta and Delta, the Omicron variant of SARS-CoV-2 demonstrates substantial population-level evidence for evasion of immunity from prior infection.
Introduction
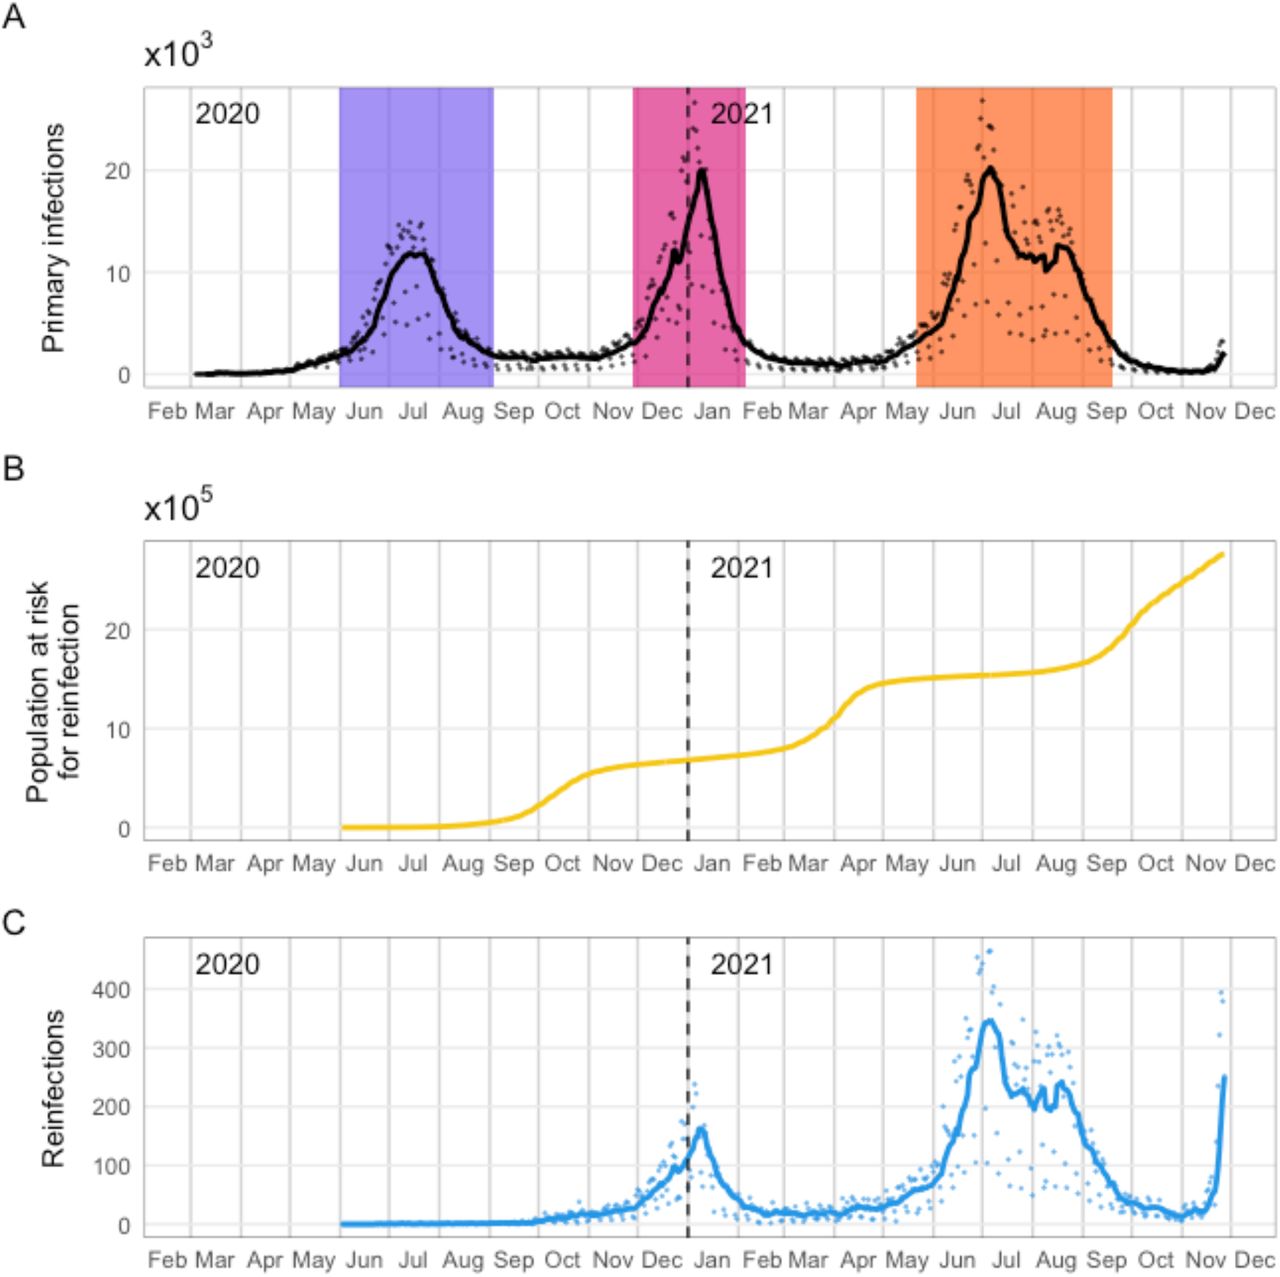
As of 27 November 2021, South Africa had nearly three million cumulative laboratory-confirmed cases of SARS-CoV-2, concentrated in three waves of infection (Figure 1). The first case was detected in early March 2020 and was followed by a wave that peaked in July 2020 and ended in September. The second wave, which peaked in January 2021 and ended in February, was driven by the Beta (B.1.351 / 501Y.V2 / 20H) variant, which was first detected in South Africa in October 2020 (7). The third wave, which peaked in July and ended in September 2021, was dominated by the Delta (B.1.617.2 / 478K.V1 / 21A) variant (8). In late November 2021, the Omicron (B.1.1.529 / 21K) variant was detected in Gauteng Province and associated with rapidly increasing case numbers (9). The estimated effective reproduction number in Gauteng based on PCR-confirmed cases was 2.3 as of 18 November, which is as high as has been seen at any point during the three waves to date (10). While the proportion of positive PCR tests with S-gene target failure (SGTF) associated with Omicron has subsequently increased in most provinces, as of 30 November 2021 Gauteng is the epicenter of the Omicron resurgence.

Daily numbers of detected primary infections, individuals eligible to be considered for reinfection, and suspected reinfections in South Africa. A: Time series of detected primary infections. Black line indicates 7-day moving average; black points are daily values. Colored bands represent wave periods, defined as the period for which the 7-day moving average of cases was at least 15% of the corresponding wave peak (purple = wave 1, pink = wave 2, orange = wave 3). B: Population at risk for reinfection (individuals whose most recent positive test was at least 90 days ago and who have not yet had a suspected reinfection). C: Time series of suspected reinfections. Blue line indicates 7-day moving average; blue points are daily values.
The Omicron variant is characterized by between 26 and 32 mutations in the spike protein many of which are located within the receptor binding domain (RBD). In addition Omicron has 3 deletions and one insertion in the spike protein, and mutations outside of the spike protein. Many of the mutations are either known or predicted to contribute to escape from neutralizing antibodies, and work on earlier variants of concern (VOC) has demonstrated that such variants can be antigenically very distinct (6).
Following emergence of three variants of concern in South Africa, a key question remains of whether there is epidemiologic evidence of increased risk of SARS-CoV-2 reinfection with these variants (i.e., immune escape from natural infection). Laboratory-based studies suggest that convalescent serum has a reduced neutralizing effect on the Beta and Delta variants compared to wild type virus in vitro (3–6); however, this finding does not necessarily translate into immune escape at the population level. Laboratory neutralization studies for Omicron are ongoing.
To examine whether reinfection risk has changed through time, it is essential to account for potential confounding factors affecting the incidence of reinfection: namely, the changing force of infection experienced by all individuals in the population and the growing number of individuals eligible for reinfection through time. These factors are tightly linked to the timing of epidemic waves. We examine reinfection trends in South Africa using two approaches that account for these factors to address the question of whether circulation of the Beta, Delta, or Omicron variants has been associated with increased reinfection risk, as would be expected if their emergence was driven by immune escape.
Methods
Data sources
Data analysed in this study come from two sources maintained by the National Institute for Communicable Diseases (NICD): the outbreak response component of the Notifiable Medical Conditions Surveillance System (NMC-SS) deduplicated case list and the line list of repeated SARS-CoV-2 tests. All positive tests conducted in South Africa appear in the combined data set, regardless of the reason for testing or type of test (PCR or antigen detection), and include the large number of positive tests that were retrospectively added to the data set on 23 November 2021 (11).
A combination of deterministic (national ID number, names, dates of birth) and probabilistic linkage methods were utilized to identify repeated tests conducted on the same person. In addition, provincial COVID-19 contact tracing teams identify and report repeated SARS-CoV-2 positive tests to the NICD, whether detected via PCR or antigen tests. The unique COVID-19 case identifier which links all tests from the same person was used to merge the two datasets. Irreversibly hashed case IDs were generated for each individual in the merged data set.
Primary infections and suspected repeat infections were identified using the merged data set. Repeated case IDs in the line list were identified and used to calculate the time between consecutive positive tests for each individual, using specimen receipt dates. If the time between sequential positive tests was at least 90 days, the more recent positive test was considered to indicate a suspected new infection. We present a descriptive analysis of suspected third and fourth infections, although only suspected second infections (which we refer to as “reinfections”) were considered in the analyses of temporal trends. Incidence time series for primary infections and reinfections are calculated by specimen receipt date of the first positive test associated with the infection, and total observed incidence is calculated as the sum of first infections and reinfections. The specimen receipt date was chosen as the reference point for analysis because it is complete within the data set; however, problems have been identified with accuracy of specimen receipt dates for tests associated with substantially delayed reporting from some laboratories. For these tests, which had equivalent entries for specimen receipt date and specimen report date that were more than 7 days after the sample collection date, the specimen receipt date was adjusted to be 1 day after the sample collection date, reflecting the median delay across all tests.
All analyses were conducted in the R statistical programming language (R version 4.0.5 (2021-03-31)).
Timing of reinfections
We calculated the time between successive infections as the number of days between the last positive test associated with an individual’s first identified infection (i.e., within 90 days of a previous positive test, if any) and the first positive test associated with their suspected second infection (i.e., at least 90 days after the most recent positive test). We analyzed the distribution of these times for all second infections, and for the subset of second infections occurring since 1 October.
Statistical analysis of reinfection trends
We analysed the NICD national SARS-CoV-2 routine surveillance data to evaluate whether reinfection risk has changed since emergence of the Beta, Delta, or Omicron variants. We evaluated the daily numbers of suspected reinfections using two approaches. First, we constructed a simple null model based on the assumption that the reinfection hazard experienced by previously diagnosed individuals is proportional to the incidence of detected cases and fit this model to the pattern of reinfections observed before the emergence of the Beta variant (through 30 September 2020). The null model assumes no change in the reinfection hazard coefficient through time. We then compared observed reinfections after September 2020 to expected reinfections under the null model.
Second, we evaluated whether there has been a change in the relative hazard of reinfection versus primary infection, to distinguish between increased overall transmissibility of the variants and any additional risk of reinfection due to potential immune escape. To do this, we calculated an empirical hazard coefficient at each time point for primary infections and reinfections and compared their relative values through time.
Approach 1: Catalytic model assuming a constant reinfection hazard coefficient
Model description
For a case testing positive on day t (by specimen receipt date), we assumed the reinfection hazard is 0 for each day from t + 1 to t + 90 and λĈτ for each day τ > t + 90, where Ĉτ is the 7-day moving average of the detected case incidence (first infections and reinfections) for day τ. The probability of a case testing positive on day t having a diagnosed reinfection by day x is thus  , and the expected number of cases testing positive on day t that have had a diagnosed reinfection by day x is
  , where
  is the detected case incidence (first infections only) for day t. Thus, the expected cumulative number of reinfections by day x is
  . The expected daily incidence of reinfections on day x is Dx = Yx – Yx−1.
Model fitting
The model was fitted to observed reinfection incidence through 30 September 2020 or 28 February 2021 assuming data are negative binomially distributed with mean Dx. The reinfection hazard coefficient (λ) and the inverse of the negative binomial dispersion parameter (κ) are fitted to the data using a Metropolis-Hastings Monte Carlo Markov Chain (MCMC) estimation procedure implemented in the R Statistical Programming Language. We ran 4 MCMC chains with random starting values for a total of 1e+05 iterations per chain, discarding the first 2,000 iterations (burn-in). Convergence was assessed using the Gelman-Rubin diagnostic (12).
Model-based projection
We used 1,500 samples from the joint posterior distribution of fitted model parameters to simulate possible reinfection time series under the null model, generating 100 stochastic realizations per parameter set. We then calculated projection intervals as the middle 95% of daily reinfection numbers across these simulations.
We applied this approach at the national level, as well as to Gauteng, KwaZulu-Natal, and Western Cape Provinces, which were the only provinces with a sufficient number of reinfections during the fitting period to permit estimation of the reinfection hazard coefficient.
Approach 2: Empirical estimation of time-varying infection and reinfection hazards
We estimated the time-varying empirical hazard of infection as the daily incidence per susceptible individual. This approach requires reconstruction of the number of susceptible individuals through time. We distinguish between three “susceptible” groups: naive individuals who have not yet been infected (S1), previously infected individuals who had undiagnosed infections  , and previously infected individuals who had a prior positive test at least 90 days ago (S2). We estimate the numbers of individuals in each of these categories on day t as follows:
 where N is the total population size, Ci. is the number of individuals with their first positive test on day i, pobs is the probability of detection for individuals who have not had a previously identified infection,
  is the probability of detection for individuals who have had a previously identified infection, and Xi. is the number of individuals with a detected reinfection on day i. For the main analysis, we assume pobs = 0.1 and
  , although the conclusions are robust to these assumptions (see Figure S8).
Individuals in  and S2, are assumed to experience the same daily hazard of reinfection, estimated as
  . The daily hazard of infection for previously uninfected individuals is then estimated as
  .
.
If we assume that the hazard of infection is proportional to incidence (It), h1(t) = λ1(t)It and h2(t) = λ2(t)It, we can then examine the infectiousness of the virus through time as:
 We also used this approach to construct a data set with the daily numbers of individuals eligible to have a suspected second infection (S2(t)) and not eligible for suspected second infection
  by wave. Wave periods were defined as the time surrounding the wave peak for which the 7-day moving average of case numbers was above 15% of the wave peak. We then analyzed these data using a generalized linear mixed model to estimate the relative hazard of infection in the population eligible for suspected second infection, compared to the hazard in the population not eligible for suspected second infection.
Our primary model was a Poisson model with a log link function,
 The outcome variable (groupinc) was the daily number of observed infections in the two groups. Our main interest for this analysis was in whether the relative hazard was higher in the second wave, third wave, and/or the post-third-wave period in which Omicron has emerged (defined as 01 November 2021 to the end of the data set on 27 November 2021), relative to during the first wave, thus potentially indicating immune escape. This effect is measured by the interaction term between group and wave. The offset term is used to ensure that the estimated coefficients can be appropriately interpreted as per capita rates. We used day as a proxy for force of infection and reporting patterns and examined models where day was represented as a random effect (to reflect that observed days can be thought of as samples from a theoretical population) and as a fixed effect (to better match the Poisson assumptions). As focal estimates from the two models were indistinguishable, we present only the results based on the random effect assumption.
Finally, we conducted a sensitivity analysis to assess the potential impact of vaccine rollout on the observed trend in the primary infection hazard coefficient. The approach used and results are presented in the Supplementary Material.
Results
We identified 35,670 individuals with at least two suspected infections (through 27 November 2021), 332 individuals with suspected third infections, and 1 individual with four suspected infections.
Descriptive analysis
Time between successive positive tests
The time between successive positive tests for individuals with suspected reinfections was bimodally distributed with peaks near 180 and 360 days (Figure 2A). The shape of the distribution was strongly influenced by the timing of South Africa’s epidemic waves. The first peak corresponds to individuals initially infected in wave 1 and reinfected in wave 2 or initially infected in wave 2 and reinfected in wave 3, while the second peak corresponds to individuals initially infected in wave 1 and reinfected in wave 3.
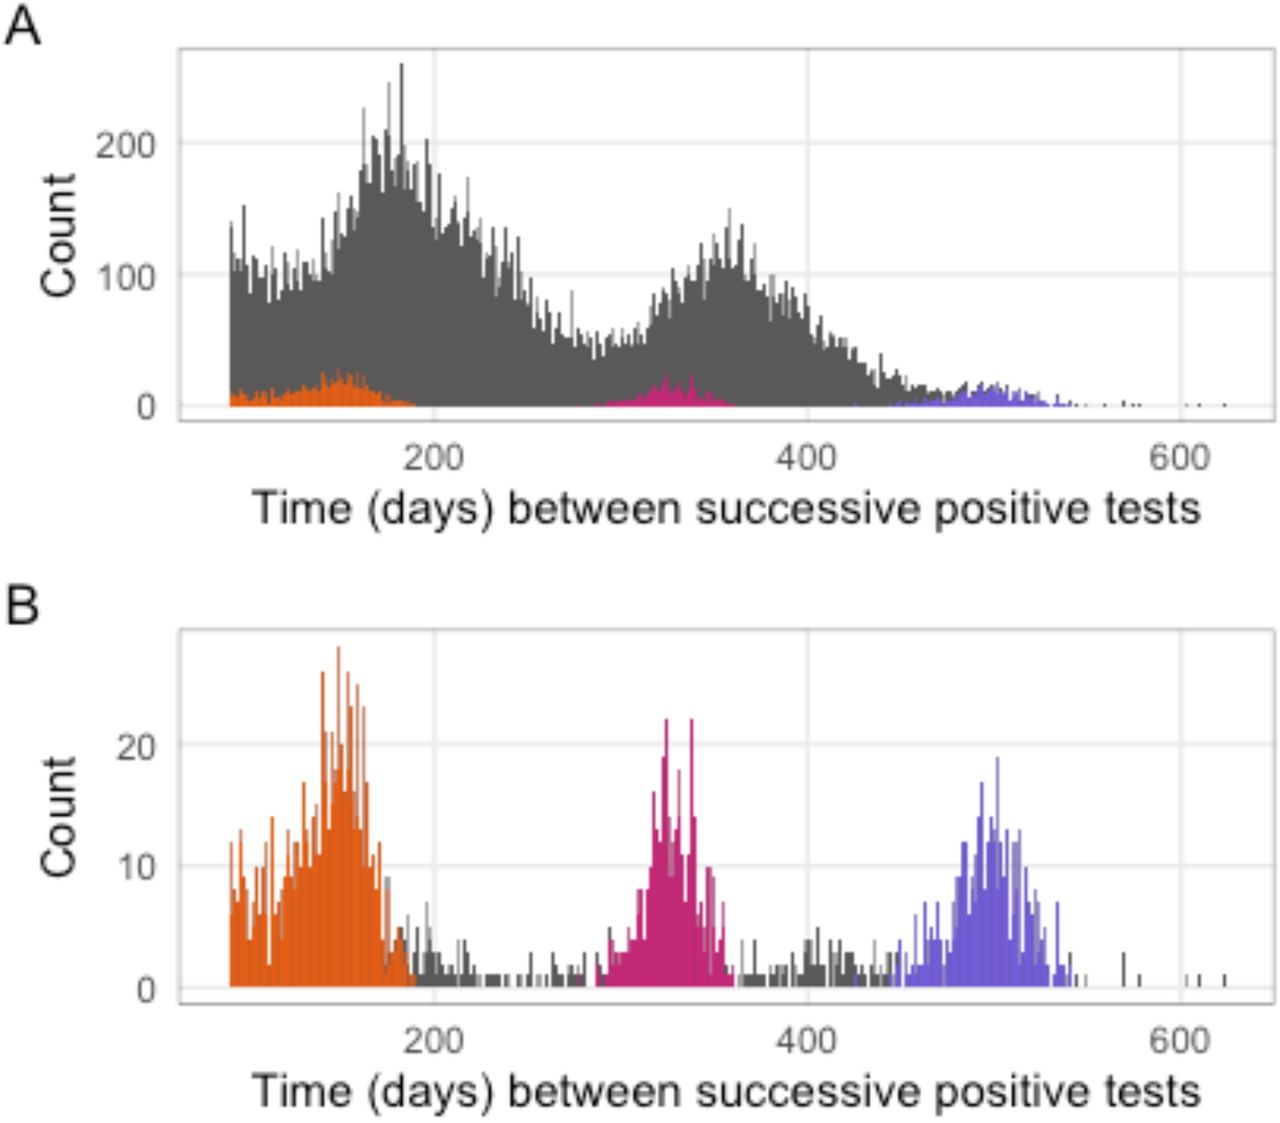
Time between detection of first and second infections. A: Time in days between infections for individuals with suspected reinfection. Note that the time since the previous positive test must be at least 90 days. Colors represent suspected reinfections diagnosed since 1 November 2021. B: Time in days between infections for individuals with suspected reinfections diagnosed since 1 November 2021. Bars for these individuals are colored by the wave during which the primary infection occurred in both panels (purple = wave 1, pink = wave 2, orange = wave 3).
More recent second infections (i.e., those occurring after 31 October 2021) show a slightly different pattern (Figure 2B), with the highest number of these reinfections occurring in individuals whose primary infection occurred during the third wave but also, since mid-November, reinfections in individuals whose primary infection occurred during the first and second waves.
Individuals with multiple suspected reinfections
332 individuals were identified who had three suspected infections. Most of these individuals initially tested positive during the first wave, with suspected reinfections associated with waves two and three (Figure 3). One of these individuals had four suspected infections. Among the individuals who have had more than one reinfection, 47 (14.2%) experienced their third infection in November 2021, which suggests that many third infections are associated with transmission of the Omicron variant (Figure 3).

Timing of infections for individuals with multiple suspected reinfections. Circles represent the first positive test of the first detected infection; triangles represent the first positive test of the suspected second infection; squares represent the first positive test of the suspected third infection. Colored bands represent wave periods, defined as the period for which the 7-day moving average of cases was at least 15% of the corresponding wave peak (purple = wave 1, pink = wave 2, orange = wave 3).
Reinfection trends
The population at risk of reinfection has risen monotonically since the beginning of the epidemic, with relatively rapid increases associated with each wave, following a 90-day delay (Figure 1B). The first individual became eligible for reinfection on 02 June 2020 (i.e., 90 days after the first case was detected). No suspected reinfections were detected until 23 June 2020, after which the number of suspected reinfections increased gradually. The 7-day moving average of suspected reinfections reached a peak of 162.6 during the second epidemic wave and a maximum of 349.1 during the third wave, as of 19 September 2021 (Figure 1). Reinfections have begun to increase again since the end of the third wave, with the 7-day moving average of suspected reinfections reaching 250.7 as of 27 November 2021.
Approach 1: Comparison of data to projections from the null model
We first used a fitting window of 02 June 2020 to 30 September 2020 to parameterize the null model of no change in the reinfection hazard coefficient through time, and project the number of reinfections through 30 June 2021. Based on this, the number of incident reinfections was expected to be low prior to the second wave and to increase substantially during the second and third waves, peaking at a similar time to incident primary infections. The observed time series of suspected reinfections closely followed this pattern (Figure S5), although it fell slightly below the prediction interval during the third wave. Provincial-level analyses suggest that this deviation was driven primarily by the Western Cape, where the observed time series of suspected reinfections fell below the prediction interval near the peak of both waves two and three (Figure S5). In contrast, the observed time series of suspected reinfections consistently falls within the prediction interval for Gauteng and KwaZulu-Natal (Figure S5). This pattern may result from policies implemented only in the Western Cape that limited testing during the wave peaks. Alternatively, this deviation from the projection interval may have resulted from the narrow fitting window, which led to poor convergence of the estimate for the negative binomial dispersion parameter and poor coverage of the projection intervals (Figure S7).
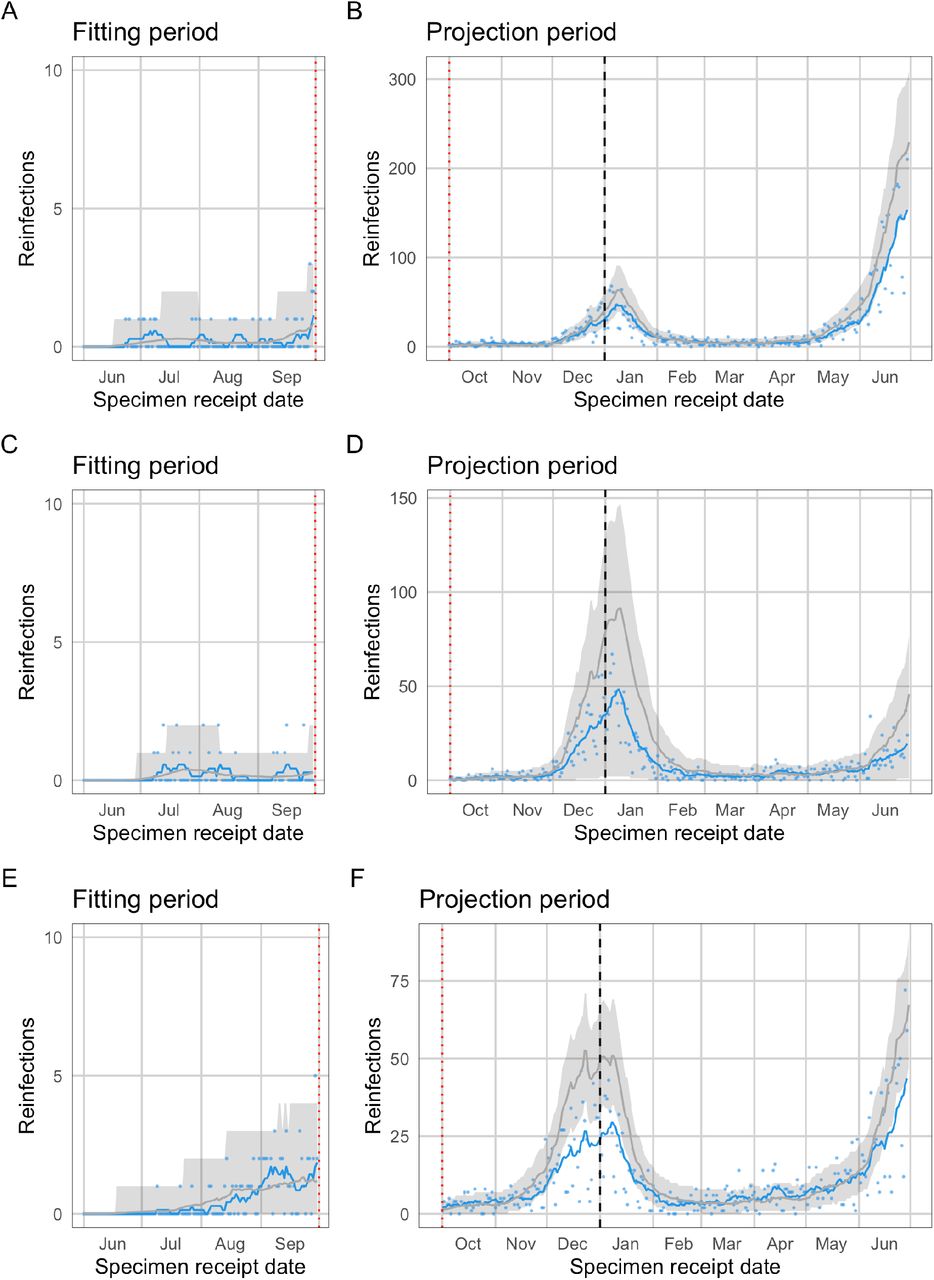
Given that there was no evidence of divergence from the null projection during the second wave, and to improve convergence of the MCMC fitting algorithm, we repeated the fitting process using a fitting window of 02 June 2020 to 28 February 2021. This substantially improved convergence with regard to estimation of the negative binomial dispersion parameter (Figure S6), as well as coverage of the projection interval, with the 7-day moving average of observed reinfections and most individual daily values falling within the projection interval from the beginning of the projection period though the end of the third wave (Figure 4). Since the beginning of November 2021, however, the 7-day moving average of observed reinfections has reached the upper bound of the projection interval, with most individual daily numbers well above the projection interval and increasing levels of deviation toward the end of the time series (Figure 4). This observed deviation from the projection under the null model is a signature of immune escape and the timing of this deviation suggests it is associated with the emergence of the Omicron variant. A similar pattern is seen in Gauteng as nationally, and high individual daily numbers of reinfections toward the end of the time series in KwaZulu-Natal suggest that a similar pattern may be emerging (Figure S4). No signature of immune escape is seen yet in the observed reinfections from Western Cape. If the high number of reinfections in Gauteng and nationally indicates that Omicron is able to evade immunity from prior infection, this pattern should become clear across provinces in by early-to-mid December.
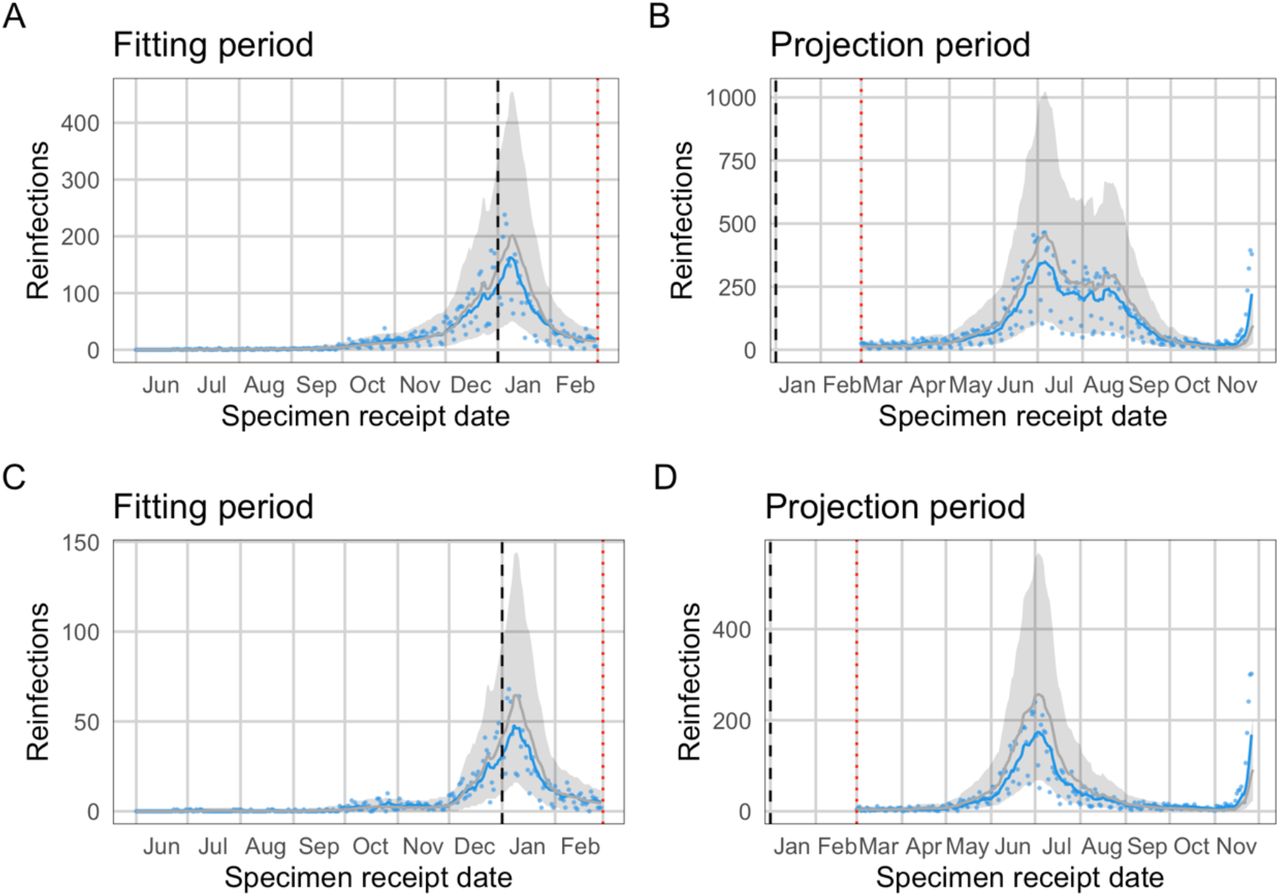
Observed and expected temporal trends in reinfection numbers. Blue lines (points) represent the 7-day moving average (daily values) of suspected reinfections. Grey lines (bands) represent mean predictions (95% projection intervals) from the null model. The null model was fit to data on suspected reinfections through 28 February 2021. Comparison of data to projections from the null model over the projection period. The divergence observed reinfections from the projection interval in November is suggestive of immune escape. A and B: National. C and D: Gauteng.
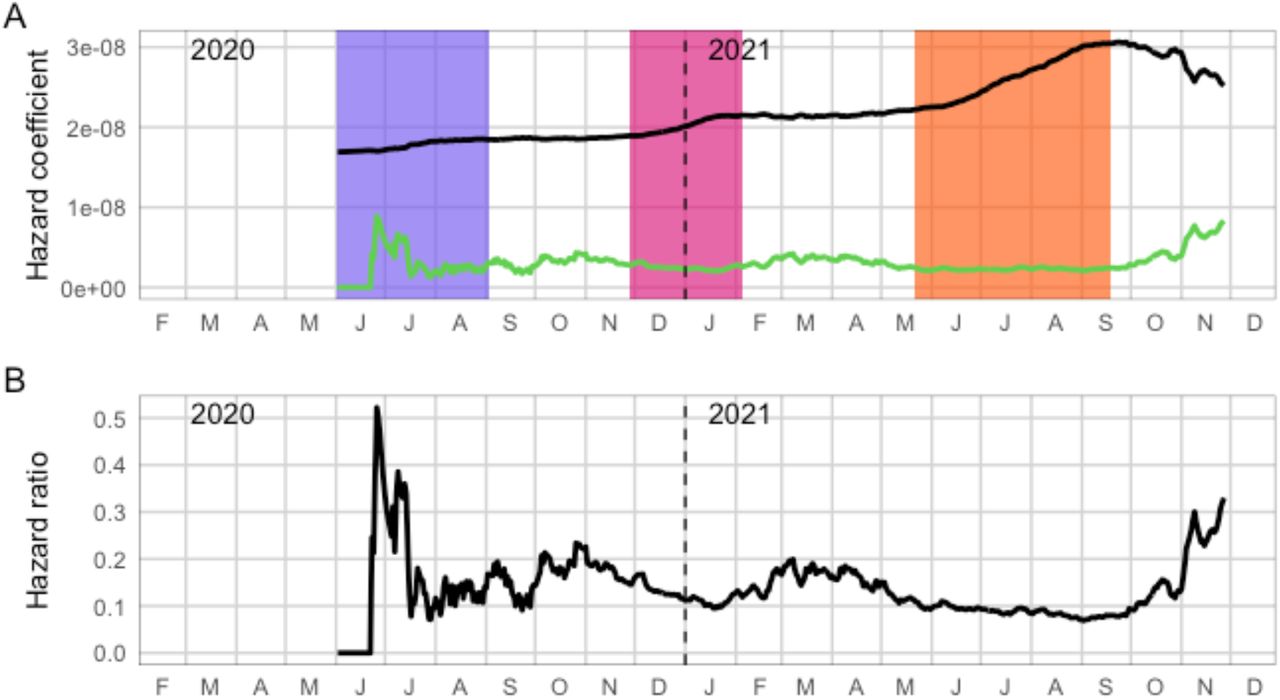
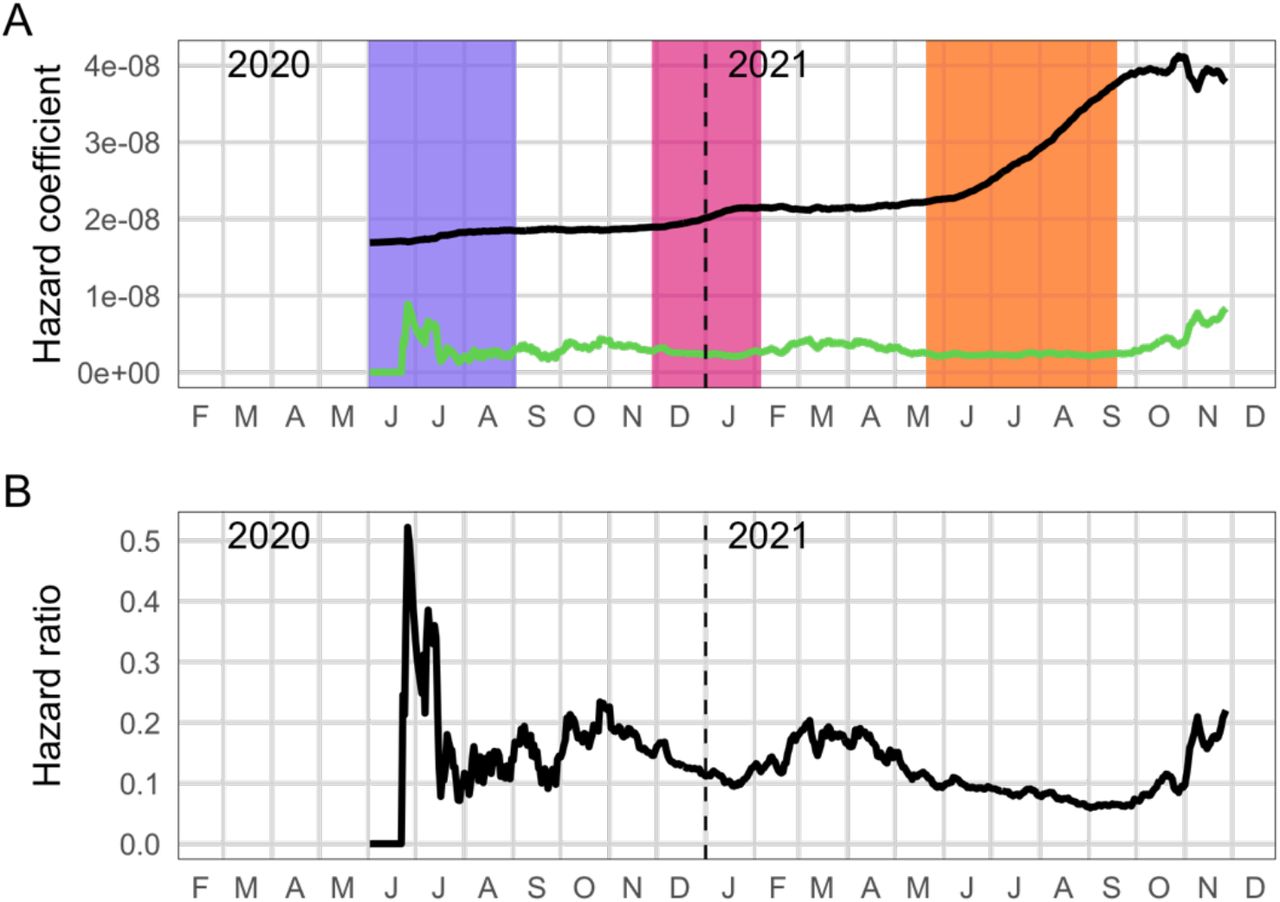
Empirical estimates of infection and reinfection hazards. A: Estimated time-varying hazard coefficients for primary infection (black) and reinfections (green). Colored bands represent wave periods, defined as the period for which the 7-day moving average of cases was at least 15% of the corresponding wave peak (purple = wave 1, pink = wave 2, orange = wave 3). B: Ratio of the empirical hazard for reinfections to the empirical hazard for primary infections
Approach 2: Empirical estimation of time-varying infection and reinfection hazards
The estimated hazard coefficient for primary infection increases steadily through the end of the third wave, as expected under a combination of relaxing of restrictions, behavioural fatigue, and introduction of variants with increased transmissibility (Beta and Delta). The estimated hazard coefficient for reinfection, in contrast, remains relatively constant throughout this period, with the exception of an initial spike in mid-2020, when reinfection numbers (and the population eligible for reinfection) were very low. The mean ratio of reinfection hazard to primary infection hazard decreased slightly with each subsequent wave, from 0.15 in wave 1 to 0.12 in wave 2 and 0.09 in wave 3. The absolute values of the hazard coefficients and hazard ratio are sensitive to assumed observation probabilities for primary infections and reinfections; however, temporal trends are robust (Figure S5).
The picture has changed following the end of the third wave. Since early October, the estimated hazard coefficient for primary infection has started to decrease, and the estimated reinfection hazard coefficient has simultaneously increased. This change became more marked since the beginning of November and is robust to the increases in vaccination coverage (Figure S9). The mean ratio of reinfection hazard to primary infection hazard for the period from 01 November 2021 to 27 November 2021 is 0.25.
These findings are consistent with the estimates from the generalized linear mixed model based on the reconstructed data set. In this analysis, the relative hazard ratio for wave 2 versus wave 1 was 0.75 (CI95: 0.59–0.97) and for wave 3 versus wave 1 was 0.71 (CI95: 0.56–0.92). The relative hazard ratio for the period from 01 November 2021 to 27 November 2021 versus wave 1 was 2.39 (CI95: 1.88– 3.11).
Discussion
Our analyses suggest that the cumulative number of reinfections observed through the end of wave 3 was consistent with the null model of no change in reinfection risk through time. Furthermore, our findings suggest that the relative hazard of reinfection versus primary infection has decreased with each subsequent wave of infections through September 2021, as would be expected if the risk of primary infection increased without a corresponding increase in reinfection risk. Based on these analyses, we conclude there was no population-level evidence of immune escape associated with emergence of the Beta or Delta variants. In contrast, the number of daily new reinfections has recently spiked and exceeds the 95% projection interval from the null model, accompanied by a dramatic increase in the hazard ratio for reinfection versus primary infection. The timing of these changes strongly suggests that they are driven by the emergence of the Omicron variant.
Differences in the time-varying force of infection, original and subsequent circulating lineages, testing strategies, and vaccine coverage limit the usefulness of direct comparisons of rates of reinfections across countries or studies. Pre-Omicron reinfection does however appear to be relatively uncommon. The PCR-confirmed reinfection rate ranged from 0% – 1.1% across eleven studies included in a systematic review (13). While none of the studies included in the systematic review reported increasing risk of reinfection over time, the duration of follow-up was less than a year and most studies were completed prior to the identification of the Beta and Delta variants of concern. Our findings for the period prior to the emergence of Omicron are consistent with results from the PHIRST-C community cohort study conducted in two locations in South Africa, which found that infection prior to the second wave provided 84% protection against reinfection during the second (Beta) wave (14), comparable to estimates of the level of protection against reinfection for wild type virus from the SIREN study in the UK (1).
A preliminary analysis of reinfection trends in England suggested that the Delta variant may have a higher risk of reinfection compared to the Alpha variant (15); however, this analysis did not take into account the temporal trend in the population at risk for reinfection, which may have biased the findings.
Our findings regarding the Beta and Delta variants are somewhat at odds with in vitro neutralization studies. Both the Beta and Delta variants are associated with decreased neutralization by some anti-receptor binding-domain (anti-RBD) and anti-N-terminal domain (anti-NTD) monoclonal antibodies though both Beta and Delta each remain responsive to at least one anti-RBD (4,5,16). In addition, Beta and Delta are relatively poorly neutralized by convalescent sera obtained from unvaccinated individuals infected with non-VOC virus (3–5,16). Lastly sera obtained from individuals after both one and two doses of the BNT162b2 (Pfizer) or ChAdOx1 (AstraZeneca) vaccines displayed lower neutralization of the Beta and Delta variants when compared to non-VOC and Alpha variant (5); although this does not have direct bearing on reinfection risk it is an important consideration for evaluating immune escape more broadly. Non-neutralizing antibodies and T-cell responses could explain the apparent disjuncture between our findings and the in vitro immune escape demonstrated by both Beta and Delta.
Strengths of this study
Our study has three major strengths. First, we analyzed a large routine national data set comprising all confirmed cases in the country, allowing a comprehensive analysis of suspected reinfections in the country. Second, we found consistent results using two different analytical methods, both of which accounted for the changing force of infection and increasing numbers of individuals at risk for reinfection. Third, our real-time routine monitoring was sufficient to detect a population-level signal of immune escape during the initial period of emergence of the Omicron variant in South Africa, prior to results from laboratory-based neutralization tests, providing timely information of importance to global public health planning.
Limitations of this study
The primary limitation of this study is that changes in testing practices, health-seeking behavior, or access to care have not been accounted for in these analyses. Estimates based on serological data from blood donors suggest substantial geographic variability in detection rates (18), which may contribute to the observed differences in reinfection patterns by province. Detection rates likely also vary through time and by other factors affecting access to testing, which may include occupation, age, and socioeconomic status. In particular, rapid antigen tests, which were introduced in South Africa in late 2020, may be under-reported despite mandatory reporting requirements. Although we have incorporated adjustments that account for late reporting of antigen tests, if under-reporting of antigen tests was substantial and time-varying it could still influence our findings. However, comparing temporal trends in infection risk among those eligible for reinfection with the rest of the population, as in approach 2, mitigates against potential failure to detect a substantial increase in risk.
Civil unrest during July 2021 severely disrupted testing in Gauteng and KwaZulu-Natal, the two most populous provinces in the country. As a result, case data are unreliable during the period of unrest and a key assumption of our models - that the force of infection is proportional to the number of positive tests - was violated during this period, resulting in increased misclassification of individuals regarding their status as to whether they are at risk of primary or re-infection. This effect of this misclassification on the signal of immune escape during the period of Omicron’s emergence would likely be small and would be expcted to bias subsequent reinfection hazard estimates downwards.
Reinfections were not confirmed by sequencing or by requiring a negative test between putative infections. Nevertheless, the 90-day window period between consecutive positive tests reduces the possibility that suspected reinfections were predominantly the result of prolonged viral shedding. Furthermore, due to data limitations, we were unable to examine whether symptoms and severity in primary episodes correlate with protection against subsequent reinfection.
Lastly, while vaccination may increase protection in previously infected individuals (19–22), vaccination coverage in South Africa was very low during much of the study period. Nevertheless, increasing vaccination uptake may reduce the risks of both primary infection and reinfection. The vaccination status of individuals with suspected reinfections identified in this study was unknown. We conducted a sensitivity analysis to assess the extent to which vaccination may have influenced our findings and found that the vaccination rollout may partially explain the observed decline in the primary infection hazard coefficient. We would recommend a more nuanced incorporation of vaccination for application of our approach to other locations with higher vaccine coverage.
Conclusion
We find evidence of a substantial and ongoing increase in the risk of reinfection that is temporally consistent with the timing of the emergence of the Omicron variant in South Africa, suggesting that its selection advantage is at least partially driven by an increased ability to infect previously infected individuals.
In contrast, we find no evidence that reinfection risk increased as a result of the emergence of Beta or Delta variants, suggesting that the selective advantage that allowed these variants to spread derived primarily from increased transmissibility, rather than immune escape. While laboratory-based data on neutralization of Omicron are not yet available, the discrepancy between the population-level evidence presented here and expectations based on laboratory-based neutralization assays for Beta and Delta highlights the need to identify better correlates of immunity for assessing immune escape in vitro.
Immune escape from prior infection, whether or not Omicron can also evade vaccine derived immunity, has important implications for public health globally. Quantifying the extent of Omicron’s immune escape for both natural and vaccine-derived immunity, as well as its transmissibility relative to other variants and impact on disease severity are urgent priorities to inform facility readiness planning and other public health operations.
Data Availability
Data and code will be made available at https://github.com/jrcpulliam/reinfections. The following data are included in the repository: - Counts of reinfections and primary infections by province, age group (5-year bands), and sex (M, F, U) - Daily time series of primary infections and suspected reinfections by specimen receipt date (national) - Model output: posterior samples from the MCMC fitting procedure and simulation results Requests for additional data must be made in writing to the National Institute for Communicable Diseases, South Africa.
Ethics statements
Ethical approval
Ethical approval: This study has received ethical clearance from University of the Witwatersrand (Clearance certificate number M210752, formerly M160667) and approval under reciprocal review from Stellenbosch University (Project ID 19330, Ethics Reference Number N20/11/074_RECIP_WITS_M160667_COVID-19).
Data availability statement
Data and code will be made available at https://github.com/jrcpulliam/reinfections and DOI: 10.5281/zenodo.5745339.
The following data are included in the repository:
Counts of reinfections and primary infections by province, age group (5-year bands), and sex (M, F, U)
Daily time series of primary infections and suspected reinfections by specimen receipt date (national)
Model output: posterior samples from the MCMC fitting procedure and simulation results
Requests for additional data must be made in writing to the National Institute for Communicable Diseases, South Africa.
Epidemiology team
Andronica Moipone Shonhiwa, Genevie Ntshoe, Joy Ebonwu, Lactatia Motsuku, Liliwe Shuping, Mazvita Muchengeti, Jackie Kleynhans, Gillian Hunt, Victor Odhiambo Olago, Husna Ismail, Nevashan Govender, Ann Mathews, Vivien Essel, Veerle Msimang, Tendesayi Kufa-Chakezha, Nkengafac Villyen Motaze, Natalie Mayet, Tebogo Mmaborwa Matjokotja, Mzimasi Neti, Tracy Arendse, Teresa Lamola, Itumeleng Matiea, Darren Muganhiri, Babongile Ndlovu, Khuliso Ravhuhali, Emelda Ramutshila, Salaminah Mhlanga, Akhona Mzoneli, Nimesh Naran, Trisha Whitbread, Mpho Moeti, Chidozie Iwu, Eva Mathatha, Fhatuwani Gavhi, Masingita Makamu, Matimba Makhubele, Simbulele Mdleleni, Bracha Chiger, Jackie Kleynhans
Information Technology team
Tsumbedzo Mukange, Trevor Bell, Lincoln Darwin, Fazil McKenna, Ndivhuwo Munava, Muzammil Raza Bano, Themba Ngobeni
We also thank Carl A.B. Pearson, Shade Horn, Youngji Jo, Belinda Lombard, Liz S. Villabona-Arenas, and colleagues in the South African COVID-19 Modelling Consortium and the SARS-CoV-2 Variants Research Consortium in South Africa for helpful discussions during the development of this work.
Footnotes
Author contributions
Conceptualization - JP, CvS, JD, HM
Data collection, management, and validation - NG, KM, AvG, CC
Data analysis - JP, CvS, JD
Interpretation - JP, CvS, AvG, CC, MJG, JD, HM
Drafting the manuscript - JP, CvS, HM
Manuscript review, revision, and approval - all authors
Guarantor: HM
Funding
JRCP and CvS are supported by the South African Department of Science and Innovation and the National Research Foundation. Any opinion, finding, and conclusion or recommendation expressed in this material is that of the authors and the NRF does not accept any liability in this regard. This work was also supported by the Wellcome Trust (grant number 221003/Z/20/Z) in collaboration with the Foreign, Commonwealth and Development Office, United Kingdom.
Competing interests
All authors have completed the ICMJE uniform disclosure form. CC and AvG have received funding from Sanofi Pasteur in the past 36 months. JRCP and KM serve on the Ministerial Advisory Committee on COVID-19 of the South African National Department of Health. The authors have declared no other relationships or activities that could appear to have influenced the submitted work.
Supplementary Material
Supplementary Methods
Data validation
To assess validity of the data linkage procedure and thus verify whether individuals identified as having suspected reinfections did in fact have positive test results at least 90 days apart, we conducted a manual review of a random sample of suspected second infections occurring on or before 20 January 2021 (n=585 of 6022; 9.7%). This review compared fields not used for linkages (address, cell-phone numbers, email addresses, facility, and health-care providers) between records in the NMC-SS and positive test line lists. Where uncertainty remained and contact details were available, patients or next-of-kin were contacted telephonically to verify whether the individual had received multiple positive test results.
Of the 585 randomly selected individuals with possible reinfections in the validation sample, 562 (96%) were verified as the same individual based on fields not used to create the linkages; the remaining 23 (4%) were either judged not a match or to have insufficient evidence (details captured by the clinician or testing laboratory) to determine whether the records belonged to the same individual.
Descriptive analysis
We compared the age, gender, and province of individuals with suspected reinfections to individuals eligible for reinfection (i.e., who had a positive test result at least 90 days prior to 27 November 2021).
We did not calculate overall incidence rates by wave because the force of infection is highly variable in space and time, and the period incidence rate is also influenced by the temporal pattern of when people become eligible for reinfection. Incidence rate estimates would therefore be strongly dependent on the time frame of the analysis and not comparable to studies from other locations or time periods.
Supplementary Results
Distribution of suspected reinfections by province
Suspected reinfections were identified in all nine provinces (Figure 2B). The reinfection rate was highest in Western Cape, where 8,185 of 487,986 eligible primary infections (1.68%) had suspected reinfections and lowest in Limpopo (1,165 of 120,777; 0.96%). For comparison, the national reinfection rate was 120,777; 1.28% (35,670 of 2,796,982 eligible primary infections). Numbers for all provinces are provided in Table S1.
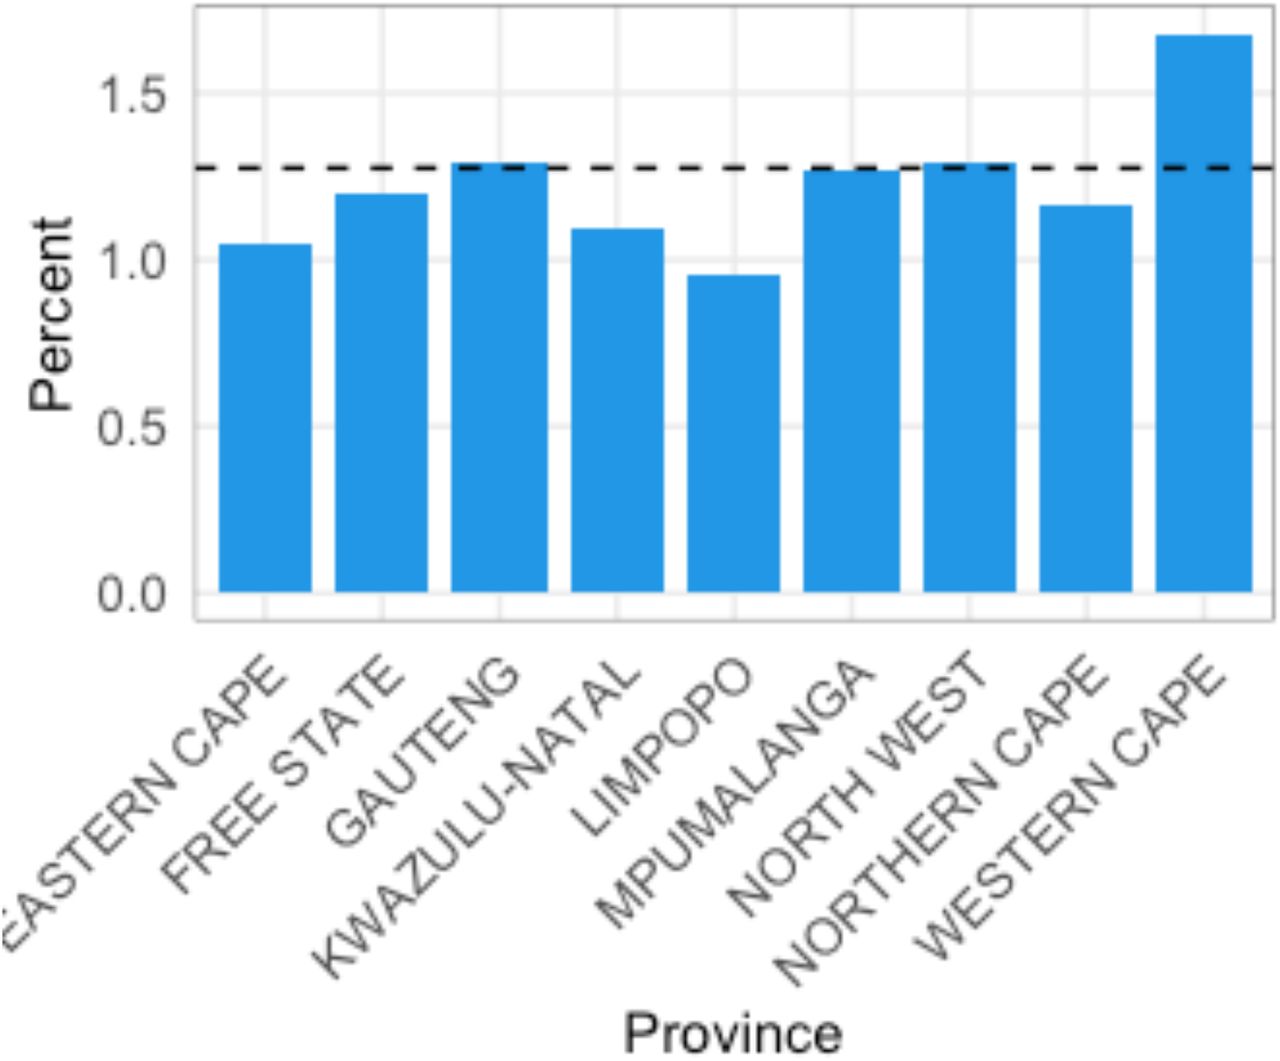
Descriptive analysis of suspected reinfections: Percentage of eligible primary infections with suspected reinfections, by province.
Distribution of suspected reinfections by province, South Africa, March 2020 to November 2021
Breakdown of suspected reinfections by sex and age group
Among 2,737,812 eligible primary infections with both age and sex recorded, 20,903 of 1,551,919 females (1.35%) and 14,686 of 1,185,893 males (1.24%) had suspected reinfections. Relative to individuals with no identified reinfection, reinfections were concentrated in adults between the ages of 20 and 55 years (Figure 2C). Numbers for all age group-sex combinations are provided in Table S2.
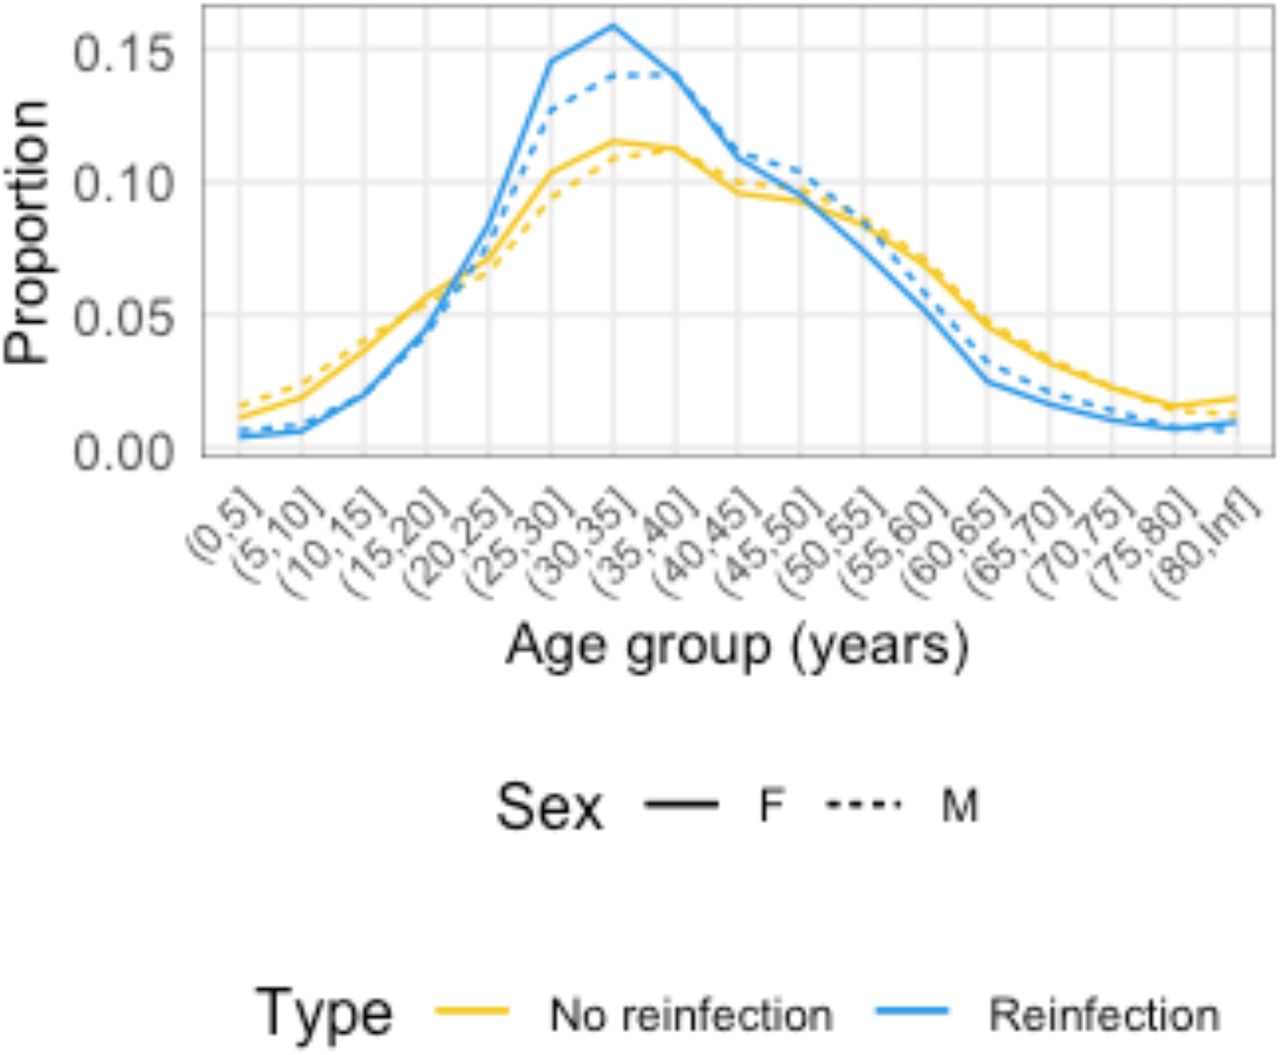
Descriptive analysis of suspected reinfections: Age distribution of individuals with suspected reinfections (blue) versus eligible individuals with no detected reinfection (yellow), by sex. Solid lines indicate females; dashed lines indicate males.
Breakdown of suspected reinfections by sex and age group (years), South Africa, March 2020 to November 2021
Timing of primary infections and reinfections by province

Number of detected primary infections (black), suspected reinfections (blue), and suspected third infections (red), by province. Lines represent 7-day moving averages. The y-axis is shown on a log scale.
Province-level comparison of data to projections from the null model
Fitting through 28 February 2021

Observed and expected temporal trends in reinfection numbers, for provinces with sufficient numbers of suspected reinfections. Blue lines (points) represent the 7-day moving average (daily values) of suspected reinfections. Grey lines (bands) represent mean predictions (95% projection intervals) from the null model. A and B: KwaZulu-Natal. C and D: Western Cape.
Fitting through 30 September 2020
Observed and expected temporal trends in reinfection numbers, for provinces with sufficient numbers of suspected reinfections. Blue lines (points) represent the 7-day moving average (daily values) of suspected reinfections. Grey lines (bands) represent mean predictions (95% projection intervals) from the null model. A and B: Gauteng. C and D: KwaZulu-Natal. E and F: Western Cape.
Approach 1: Convergence diagnostics
Fitting through 28 February 2021

Convergence diagnostics and density of the posterior distribution for MCMC fits, based on a fitting window through 28 February 2021. A and B: MCMC chains for each parameter. C: Gelman-Rubin values (a.k.a. potential scale reduction factors) for each parameter; values less than 1.1 indicate sufficient mixing of chains to suggest convergence. D, G, I: posterior density for each parameter and the log likelihood. E, F, H: 2-D density plots showing correlations between parameters and the log likelihood.
Fitting through 30 September 2020

Convergence diagnostics and density of the posterior distribution for MCMC fits, based on a fitting window through 30 September 2020. A and B: MCMC chains for each parameter. C: Gelman-Rubin values (a.k.a. potential scale reduction factors) for each parameter; values less than 1.1 indicate sufficient mixing of chains to suggest convergence. D, G, I: posterior density for each parameter and the log likelihood. E, F, H: 2-D density plots showing correlations between parameters and the log likelihood.
Approach 2: Sensitivity analysis
Sensitivity to assumed observation probabilities
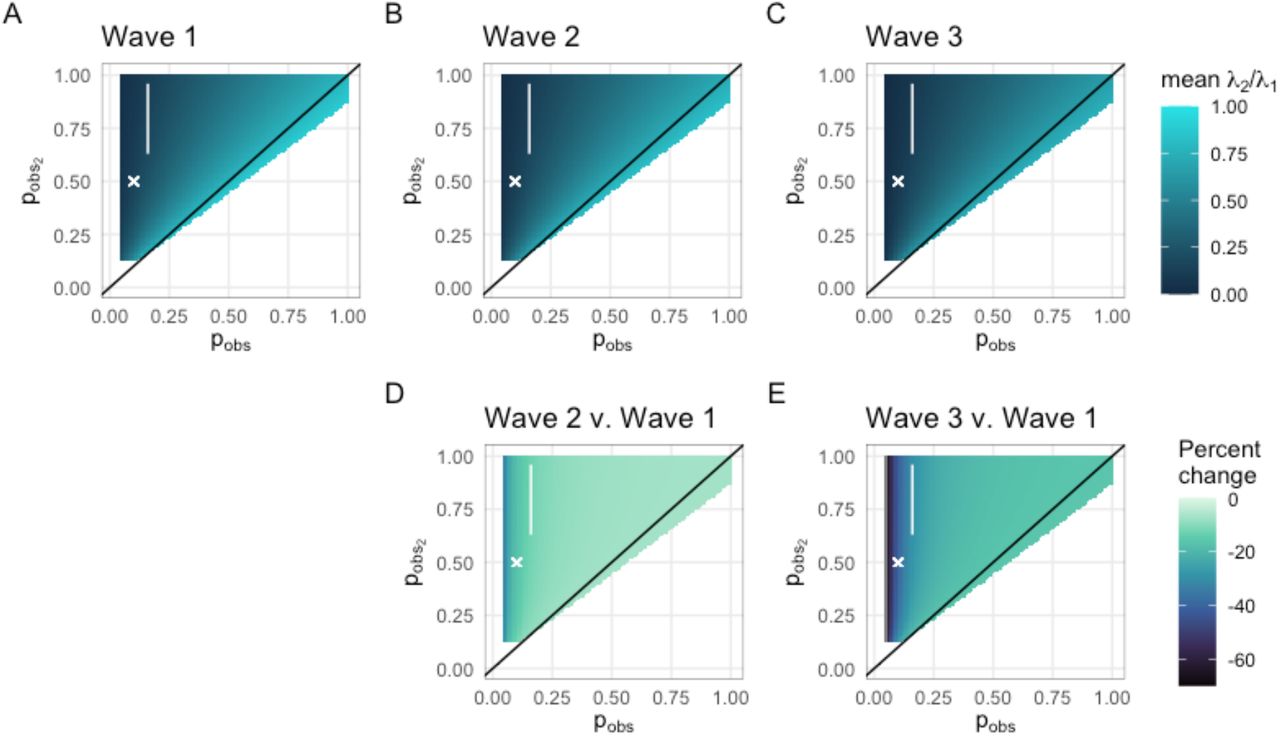
Sensitivity analysis of empirical hazard ratio estimates to assumed observation probabilities for primary infections and reinfections. Estimates are shown for the full range of probabilities for which the overall mean relative hazard is between 0 and 1. The white polygon encloses the most plausible estimates (i.e. consistent with relative reinfection risk observed in the SIREN study (1) and observation probabilities for primary infection consistent with estimates based on seroprevalence data (18)). Top: Mean relative empirical hazard for reinfections versus primary infections in each wave, as a function of assumed observation probabilities for primary infections (pobs) and reinfections ( ). A: wave 1, B: wave 2, C: wave 3. Bottom: Percent change in the mean relative empirical hazard for reinfections versus primary infections in waves 2 (D) and 3 (E) relative to wave 1, as a function of assumed observation probabilities for primary infections (pobs) and reinfections (
 ).
).
Sensitivity to incorporation of vaccine rollout
In our main analysis, we did not account for the effect of vaccination on the infection hazards in Approach 2. To assess the robustness of our conclusion that the primary reinfection hazard has been declining since early October, we performed a sensitivity analysis by making an assumption about vaccination on the other extreme: i.e., we assumed that all the effectively vaccinated individuals were susceptible to primary infection at the time of vaccination. This approach allows us to bound the effect of vaccination on the outcomes of interest. We obtained daily numbers of vaccinated individuals from publicly available data (23) and considered vaccine efficacy against infection by the Delta variant (24,25) to obtain numbers of effectively vaccinated people in South Africa. We assumed a two-week lag between day of vaccination and effective protection.
Sensitivity analysis to the impact of vaccine rollout. Analogous to Figure 5, but assuming the maximum possible impact of vaccination.
Acknowledgements
The authors wish to acknowledge the members of the NICD Epidemiology and Information Technology teams which curate, clean, and prepare the data utilized in this analysis.
Footnotes
This version of the manuscript has been revised with the following major changes: (1) the analyses to cover data through 27 November 2021, in light of the emergence of the Omicron variant, and (2) the dataset now contains additional data reported retrospectively by NICD on 23 November 2021. For more details on the data that were added, see: Health Department adds antigen tests to country's official COVID-19 stats. Media Release, South African Government News Agency [Internet]. 2021 Nov 23 [cited 2021 Nov 30]; Available from: https://www.sanews.gov.za/south-africa/health-department-adds-antigen-tests-countrys-official-covid-19-stats


