
Abstract
Repeated emergence of SARS-CoV-2 variants with increased transmissibility necessitates rapid detection and characterization of new lineages. To address this need, we developed PyR0, a hierarchical Bayesian multinomial logistic regression model that infers relative transmissibility of all viral lineages across geographic regions, detects lineages increasing in prevalence, and identifies mutations relevant to transmissibility. Applying PyR0 to all publicly available SARS-CoV-2 genomes, we identify numerous substitutions that increase transmissibility, including previously identified spike mutations and many non-spike mutations within the nucleocapsid and nonstructural proteins. PyR0 forecasts growth of new lineages from their mutational profile, identifies viral lineages of concern as they emerge, and prioritizes mutations of biological and public health concern for functional characterization.
One Sentence summary A Bayesian hierarchical model of all viral genomes predicts lineage transmissibility and identifies associated mutations.
Main Text
The SARS-CoV-2 pandemic has featured repeated waves of cases driven by the emergence of new lineages with higher transmissibility. Rapidly identifying such lineages as they emerge and accurately forecasting their dynamics is critical for guiding outbreak response, but doing so effectively requires interrogating the entirety of the global SARS-CoV-2 genomic dataset. The large size (currently over 2.5 million virus genomes) and geographic and temporal variability of the available data present significant challenges that will only become more acute as more viruses are sequenced. Current phylogenetic approaches are computationally inefficient on datasets with more than ∼5000 samples and take days to run at that scale. Ad hoc methods to estimate the relative transmissibility of particular SARS-CoV-2 lineages are a computationally efficient alternative (1–3), but have typically relied on models in which one or two lineages of interest are compared to all others and cannot capture the complex dynamics of multiple co-circulating lineages.
Furthermore, estimates of transmissibility based on lineage frequency data alone (2–4) do not take advantage of additional statistical power that can be gained from analyzing the independent appearance and growth of the same mutation in multiple lineages. Performing a mutation-based analysis of lineage prevalence has the additional advantage of identifying specific genetic determinants of a lineage’s phenotype, which is critically important both for predicting the phenotype of new lineages and for understanding the biology of transmission and pathogenesis. The SARS-CoV-2 pandemic has already been dominated by several genetic changes of functional and epidemiological importance, including the spike (S) D614G mutation that has made SARS-CoV-2 more transmissible(5, 6) and is associated with higher viral loads(5). In addition, mutations found in Variant of Concern (VoC) lineages, such as S:N439R, S:N501Y, and S:E484K, have been linked, respectively, to increased transmissibility(7), enhanced binding to ACE2(8) and antibody escape (9, 10). Identifying functionally important mutations is challenging, however, against the large background of genetic variants with little or no phenotypic consequence.
We set out to formulate a principled approach to modeling the apparent transmissibility of SARS-CoV-2 lineages, estimating their growth rate as a proxy for transmissibility and explicitly modeling it as a linear combination of the effects of individual mutations. We developed PyR0, a hierarchical Bayesian regression model that enables scalable analysis of the complete set of publicly available SARS-CoV-2 genomes, and that could be applied to any viral genomic dataset and to other phenotypes. The model, which is summarized in Figure 1 and described in detail in the supplemental note, avoids the complexity of full phylogenetic inference by first clustering genomes by their PANGO lineages (11), and then estimating the incremental effect on growth rate of each of the most common amino acid changes on the lineages in which they appear. By regressing growth rate as a function of genome sequence, the model shares statistical strength among genetically similar lineages without explicitly relying on phylogeny. By modeling only the multinomial proportion of different lineages rather than the absolute number of samples for each lineage (4, 12), and by doing so within 14-day intervals in 1,070 globally distributed geographic regions, the model achieves robustness to a number of sources of bias across regions and over time that affect all lineages, including differences in sampling rate and differences and changes in transmission due to e.g. social behaviours, policy changes, and vaccination.

Overview of the PyR0 analysis pipeline. After alignment and lineage assignment, sequence data are used to construct spatio-temporal lineage prevalence counts ytps and amino acid substitution covariates Xsf. Pyro is used to fit a Bayesian multinomial logistic regression model to ytps and Xsf.
We fit PyR0 to 2,160,748 SARS-CoV-2 genomes available on GISAID (13, 14) as of July 6, 2021, in a model that contained 1,281 PANGO lineages and 2,337 nonsynonymous mutations. The output of the model is a posterior distribution for the relative growth rate of each lineage and for the contribution to the growth rate from each mutation. This posterior distribution was inferred using variational inference implemented in the Pyro (15) probabilistic programming framework (see Supplemental Materials). The trained model can be used to infer lineage growth rates, predict the growth rate of completely new lineages, forecast future lineage proportions, and estimate the effects of individual mutations on transmissibility.
The model’s inferred lineage growth rates (Figure 2) show a modest upward trend among all lineages, accompanied by numerous lineages with dramatically higher rates, with the latter becoming more frequent beginning late in 2020. Sensitivity analyses revealed broad consistency of growth rate estimates across spatial data subsets (Figure S1). The upward trend may in part reflect an upward bias caused by the lineage assignment process, as can be seen in simulation studies (Figure S2), but the high tail of the distribution exhibits elevated growth rates far in excess of this trend. The model correctly inferred B.1.617.2 to have the highest growth rate to date, 2.6-fold (95% CI, 2.27-2.97) higher than the original A lineage (Figure 2 inset); similar growth rates were estimated for its sub-lineages AY.1 and AY.2 (Table 1). These growth rates, obtained in early July 2021, correctly predicted that B.1.617.2 and sublineages (collectively called Delta in the WHO classification) would continue to displace other lineages, including the previously dominant B.1.1.7 and even other highly transmissible lineages such as B.1.621 and C.36.3 (Figure S3).
Mutations most significantly associated with increased growth rate. Significance is defined as posterior mean / posterior standard deviation. Transmissibility is per 5.5 days (estimated generation time of the Wuhan (A) lineage (1, 22)). Final column: number of PANGO lineages in which each substitution emerged independently. Dashes indicate deletion.

Growth rate versus date of lineage emergence. Circle size is proportional to cumulative case count inferred from lineage proportion estimates and confirmed case counts. Inset table lists the 10 most transmissible lineages inferred by the model. R/RA: the fold increase in effective reproductive number over the Wuhan (A) lineage, assuming a fixed generation time of 5.5 days.
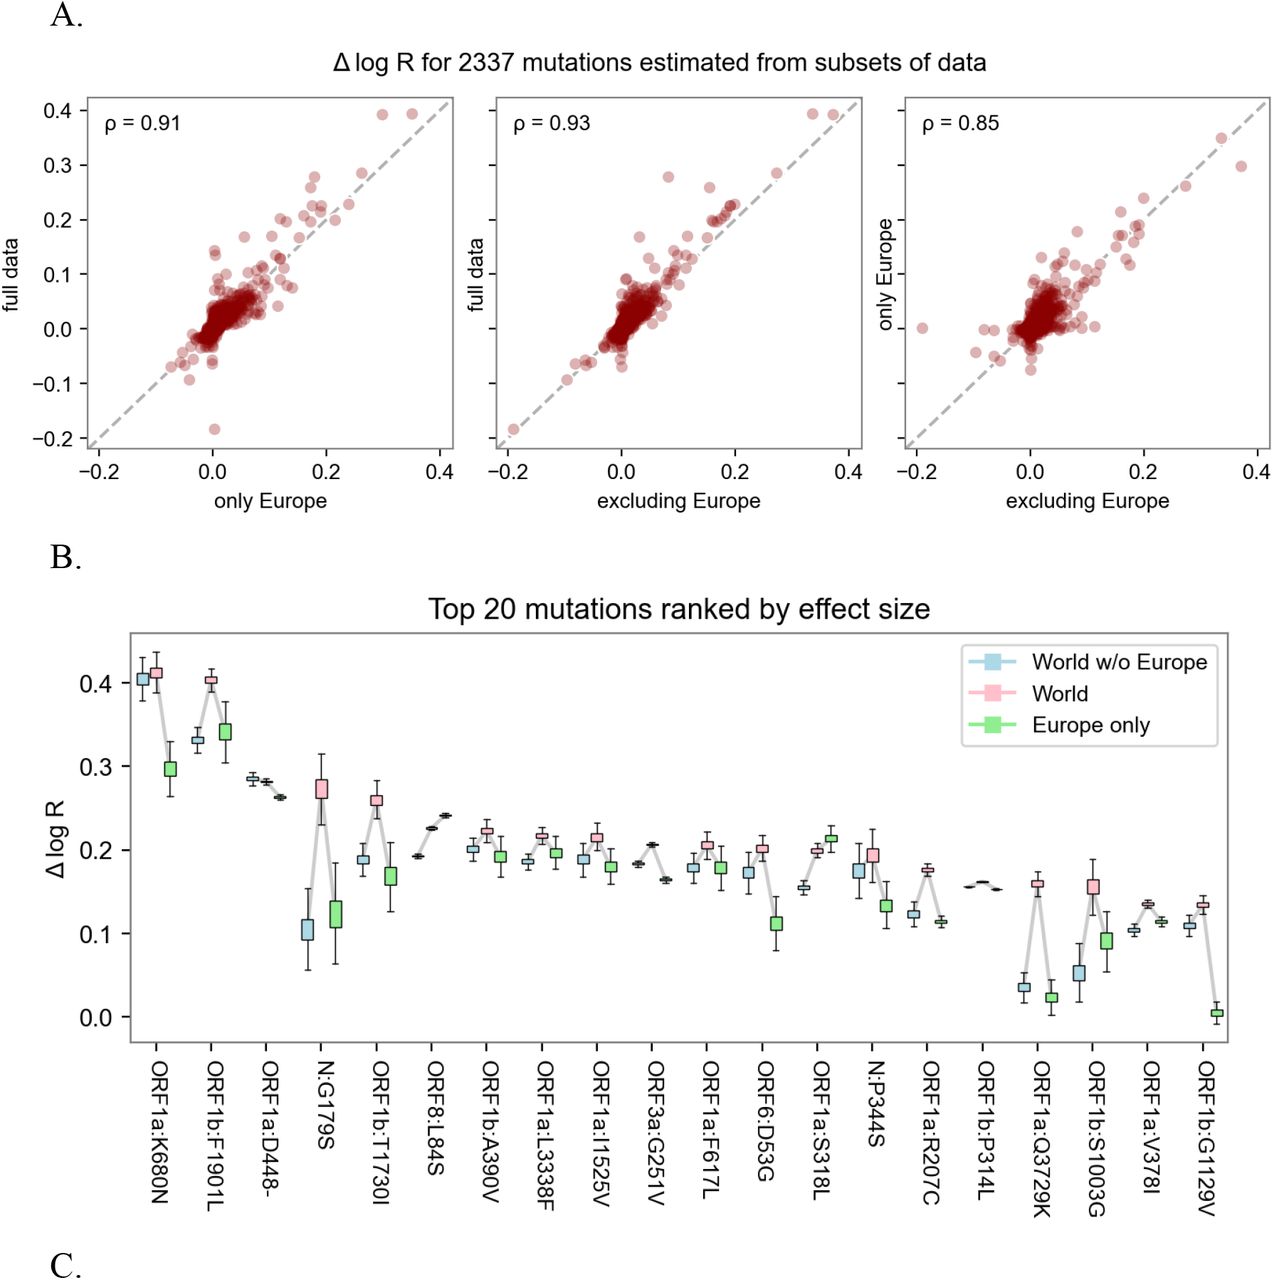
By basing growth rate estimates on the contributions of individual mutations, PyR0 can forecast the growth rates of unobserved lineages using their mutational profiles alone. This is possible with SARS-CoV-2 because of the high rate of convergent evolution (Table 1, Figure S4), which allows the model to infer the growth rate of new constellations of mutations based on the trajectories of other lineages in which they have previously emerged. This predictive capability is highly desirable from a public health standpoint because forecasts are available as soon as new lineages appear. To test the reliability of this kind of estimate, we trained leave-one-out estimators on subsets of the dataset with entire subclades removed (Figure S5). These estimators showed excellent agreement with estimators based on the observed behavior of the lineages, and they were also much more accurate than naive phylogenetic estimators that assume the growth rate of each new strain is equal to its parent lineage’s growth rate (Pearson’s ρ = 0.91, after correcting for parent growth rate, Figure S5). These results demonstrate the feasibility of this kind of estimate and provide a realistic test of the accuracy of our mutation-level estimates.
We also found that the model would have provided early warning of the rise of VoCs, had it been routinely applied to available SARS-CoV-2 data. For example, PyR0 would have forecast the coming dominance of B.1.1.7 in early November 2020 (Figure S6A), while the first models forecasting its rapid rise were published in January 2021 (16); a similar prediction would have been available for B.1.617.2 by late April 2021 (Figure S6B). While variant-specific models were accurate and useful (2) in predicting the rise of these lineages, each modeling effort was specific to a particular lineage and geographic region; by contrast, PyR0’s global approach provides similar early detection while also offering automated, rapid, and unbiased consideration of all variants and lineages, together with ranking based on relative transmissibility. We tested the model’s predictive ability (Figure S6,S7) and found that forecasts were reliable for 1-2 months into the future (Table S1, Figure S8). Forecasts were based on the current state of the pandemic and predicted near-term dynamics, ignoring the unpredictable appearance of new lineages. Rapid assessment of emerging lineages relies on timely application of PANGO or alternative lineage classification schemes.
Unbiased, genome-wide estimates of the effect of SARS-CoV-2 mutations on growth rate also provide a powerful tool for better understanding the biology of transmissibility. Our model allowed us to estimate the contribution of 2,337 amino acid substitutions and deletions (Table 1) to lineage growth and to rank them by inferred statistical significance (Figure S1 and S9). Cross-validation confirmed that these results replicate across different geographic regions (Figure S10).
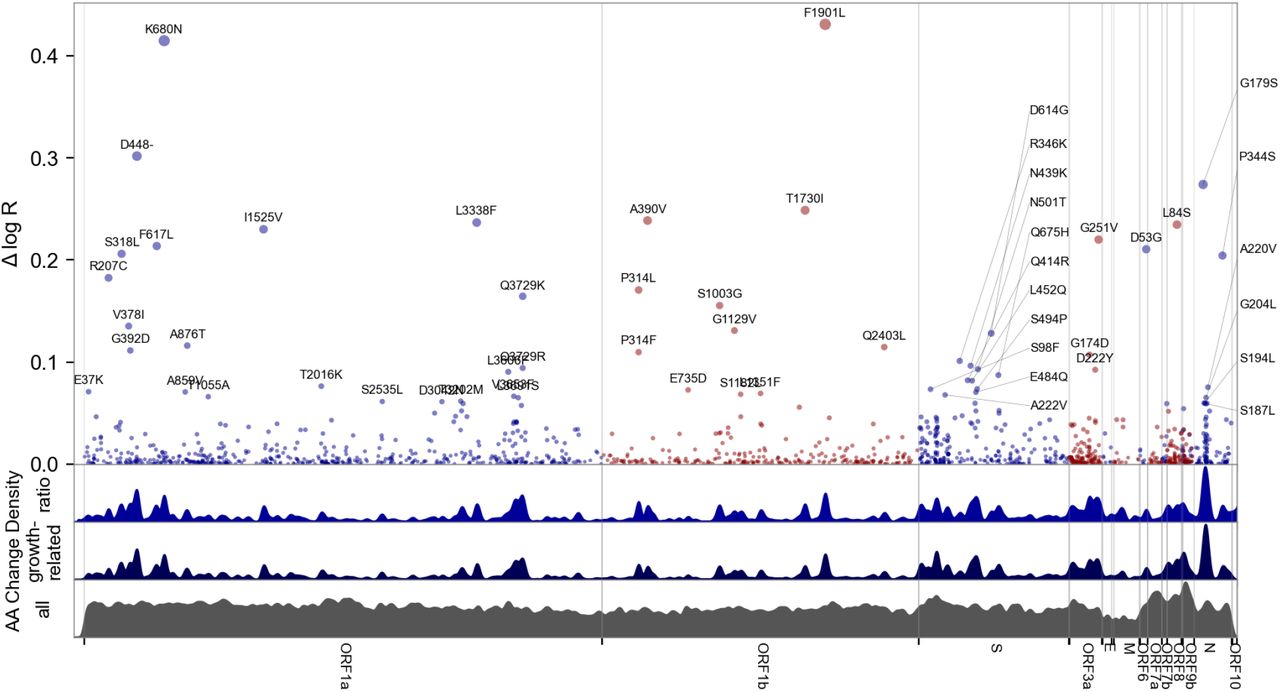
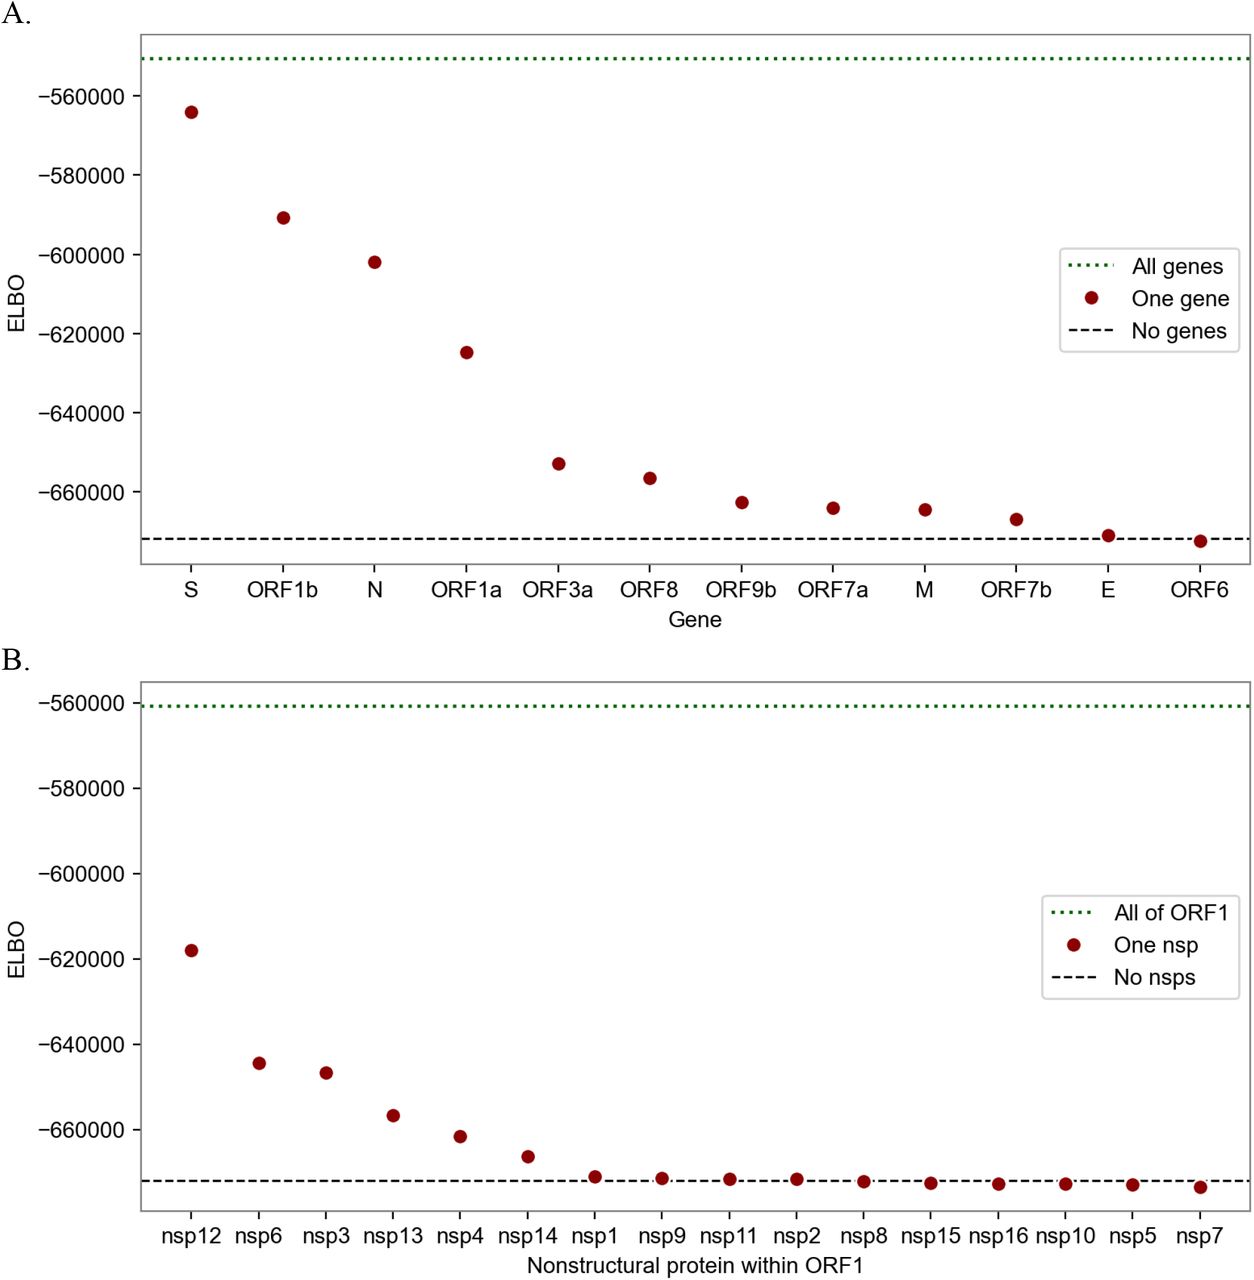
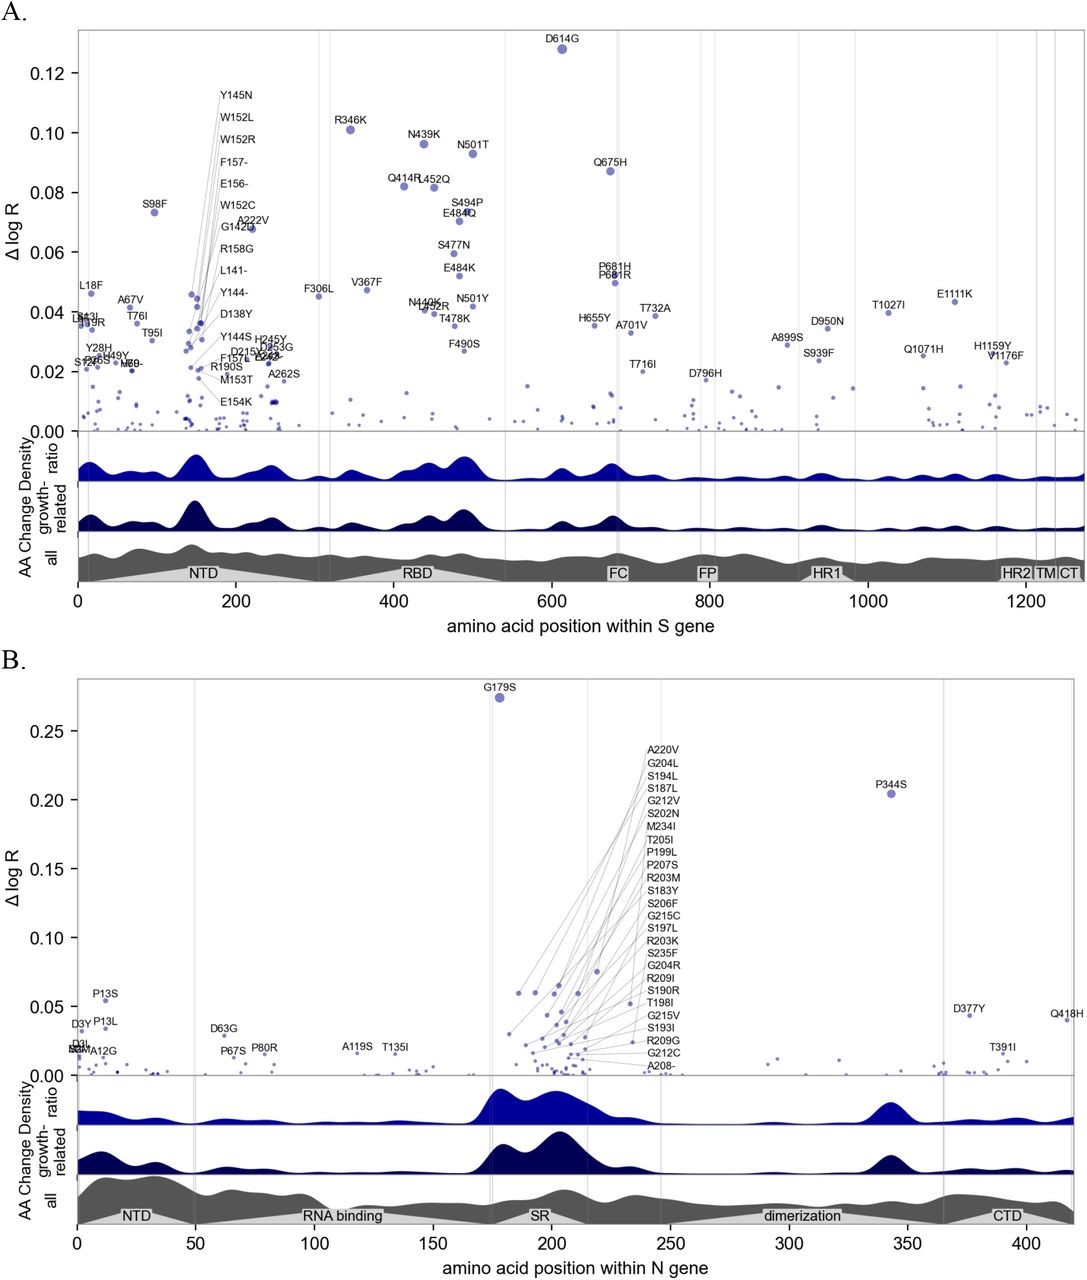
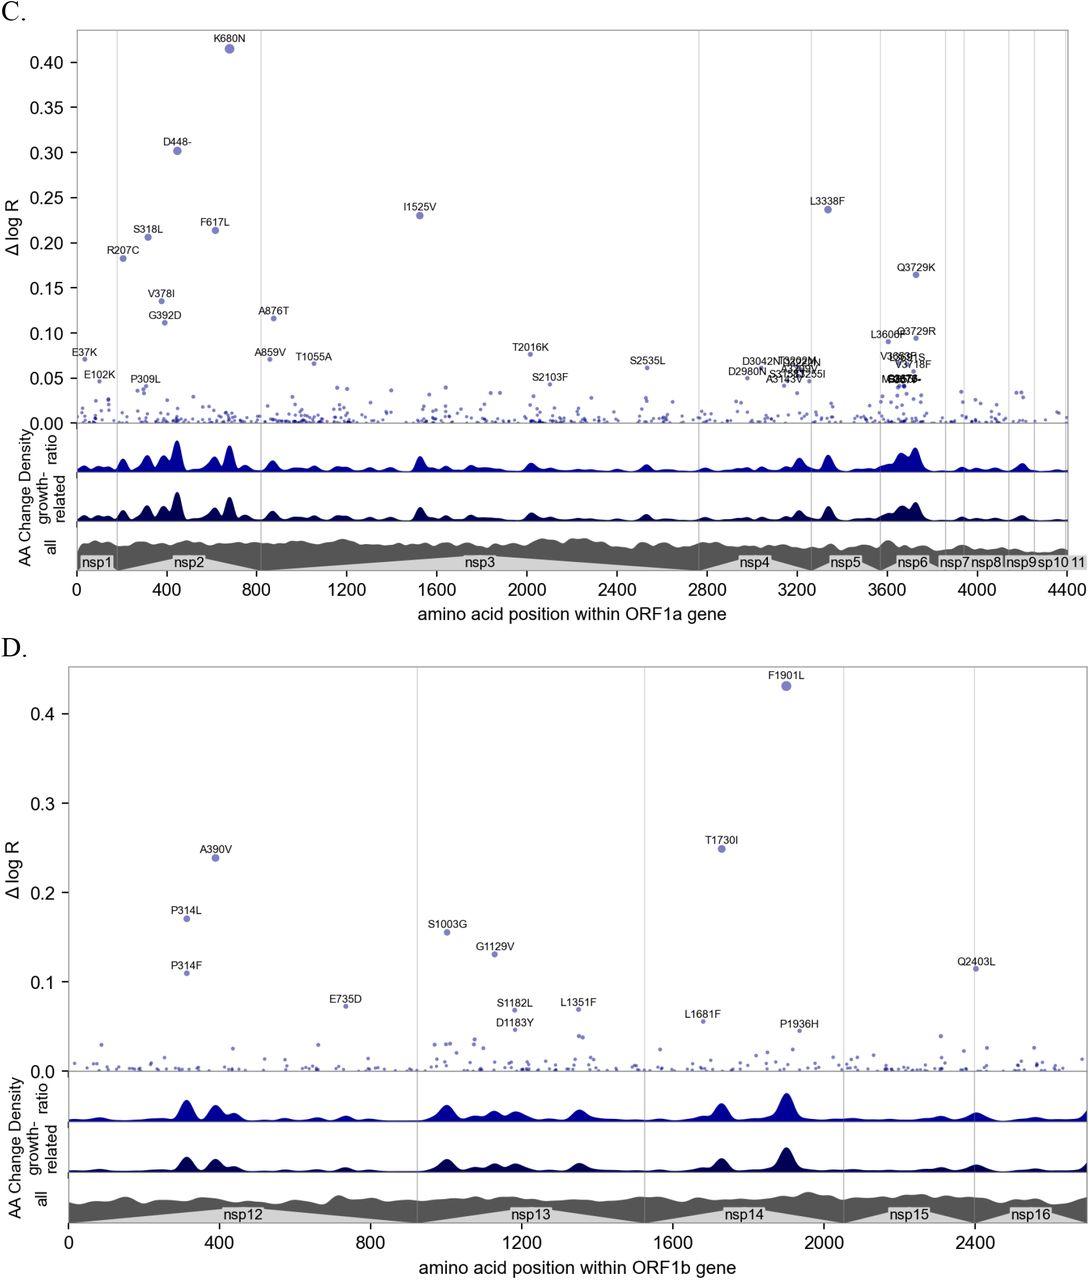
The highest concentrations of growth rate-associated mutations were found in the S, N, and the ORF1 polyprotein genes (ORF1a and ORF1b, Figures 3, S11-12). S also demonstrated spatial autocorrelation (p=0.003), a characteristic that also held for the genome as a whole (Table S2), consistent with the existence of functional hotspots. Within S, there were three hotspots of growth rate-enhancing mutations, each within a defined functional region: the N-terminal domain, the receptor-binding domain, and the furin-cleavage site (Figure S12A). These regions include several high-scoring mutations, including S:D614G (6, 17), S:L452R (7), and S:ΔH69V70 (18), that have been shown to increase transmissibility in experimental systems, while S:P681R increases S proteolytic processing (19) and fusion (20). Another cluster was observed at positions 160–210 of N (Figure S12B). Although previously uncharacterized, mutations in this region were recently linked to increased efficiency of SARS-CoV-2 RNA packaging (21). Within ORF1, we found growth rate-associated mutations across all viral enzymes, and clusters within additional non-structural proteins (nsps). The highest concentration of mutations with predictive power is found in nsp2, 4, 6, and nsp12–14 (Figure S11B,S12C-D), suggesting unexplored function at those sites. For example, nsp4 and nsp6 have roles in assembly of replication compartments, and substitutions in these regions may influence the kinetics of replication (see supplement). We note that while convergent evolution makes it possible to identify candidate functional mutations, observational data alone is insufficient to declare mutations as causal. For this reason hits identified by our study require functional followup, facilitated by our uncertainty-ranked list of important mutations.

Manhattan plot of amino acid changes assessed in this study. The top y axis shows effect size ΔlogR, the estimated change in log reproductive number due to each amino acid change. The bottom three axes show the background density of all observed amino acid changes, the density of those associated with growth (weighted by |Δ log R|), and the ratio of the two. The top 55 amino acid changes are labeled. See Figure S12 for detailed views of S, N, ORF1a, and ORF1b.
In summary, PyR0 provides an unbiased, automated approach for detecting viral lineages with increased growth rate. Because it assesses the contribution of individual mutations and aggregates across all lineages and geographic regions, it can identify mutations and gene regions that likely drive transmissibility, and it can predict the relative growth rate of new lineages based solely on viral sequence. Applied to the full set of publicly available SARS-CoV-2 genomes, it provides a principled, unbiased analysis of the mutations driving increased transmissibility of the virus, identifying experimentally established driver mutations in S and highlighting the key role of non-S mutations, particularly in N, ORF1b, and ORF1a, in promoting increased growth rate. The latter findings underscore the extensive unexplored viral biology of this recently emerged virus. The highlighted genetic diversity offers promising targets for follow-up investigation and may open new avenues for therapeutic or public health intervention.
Data Availability
All data was gathered from other public resources. Data preprocessing scripts are open source.
Supplementary Materials
Materials and methods
Data and Code Availability
Source code for data preprocessing and modeling and available at https://github.com/broadinstitute/pyro-cov. GISAID sequence data is publicly available at https://gisaid.org. PANGO lineage aliases are available at https://cov-lineages.org with source code at https://github.com/cov-lineages/lineages-website and lineage aliases available at https://github.com/cov-lineages/pango-designation. The whole genome map is available as part of NextClade at https://github.com/nextstrain/ncov/blob/50ceffa/defaults/annotation.gff. Structures of ORFab regions are available at https://www.ncbi.nlm.nih.gov/protein.
Regression model of relative transmissibility (PyR0 model)
We fit a Bayesian, hierarchical multinomial logistic regression model to data from GISAID using Pyro. Details are provided in the supplemental note below.
Simulation of lineages
We carried out a simulation study to determine whether the process of clustering genomes into named lineages could generate an artifactual increase in estimated growth rate. The simulation was of a single neutrally evolving viral population with discrete generations and a stochastic population size generated by a highly overdispersed negative binomial distribution with the current growth rate. (Overdispersion parameter = 0.11, which yields 10% of cases causing 80% of transmission.) The growth rate is 2.5 for the first 10 generations; subsequently it drops to 1.5 until the viral population reaches 80,000 infections, whereupon it drops again to 0.8. When the population decreases to 10,000, the growth switches back to 1.5, and continues cycling when the high and low population thresholds are reached. (A model with a roughly constant-sized population yields similar results.) The population starts as a single named lineage. Each generation, the most successful nodes in that generation are determined by looking ahead four generations and counting descendants. New lineages are assigned to the nodes with the most descendants (minimum of 200 descendants), up to a maximum of 10 lineages per generation. 10% of all infections are randomly sampled and any lineage with fewer than 20 descendants is discarded. When all new lineages have been generated and all nodes assigned a lineage, a global multinomial logistic regression is performed, using the Python package sklearn.linear_model, yielding estimates for the relative growth rates of all lineages.
Spatial analysis of mutation coefficients
To assess the spatial structure of the inferred amino acid coefficients βf (described in Probabilistic Model below), we utilize the Moran I spatial autocorrelation statistic. We report (see Table S1) one-sided p-values for Moran I computed using a permutation test with 999,999 random permutations. We use a gaussian weighting function of the form exp(-distance2/lengthscale2), where distance is measured in units of nucleotides. We compute Moran I statistics both for individual genes and the entire genome. For larger genes whose extent is 1000+ nucleotides we use a length scale of 50 nucleotides. For smaller genes (e.g. ORF8) we set the length scale to one twentieth of the extent of the gene. When considering the entire set of amino acid changes, i.e. all 2,337 coefficients that make up βf, we compute the Moran I statistic for two different length scales. We note, however, that the Moran I statistic is somewhat simplistic, since it is designed to pick up spatial structure at a single length scale. In particular it can be insensitive to complex spatial structure that involves multiple overlapping substructures at different scales.
Analysis of substitution statistics
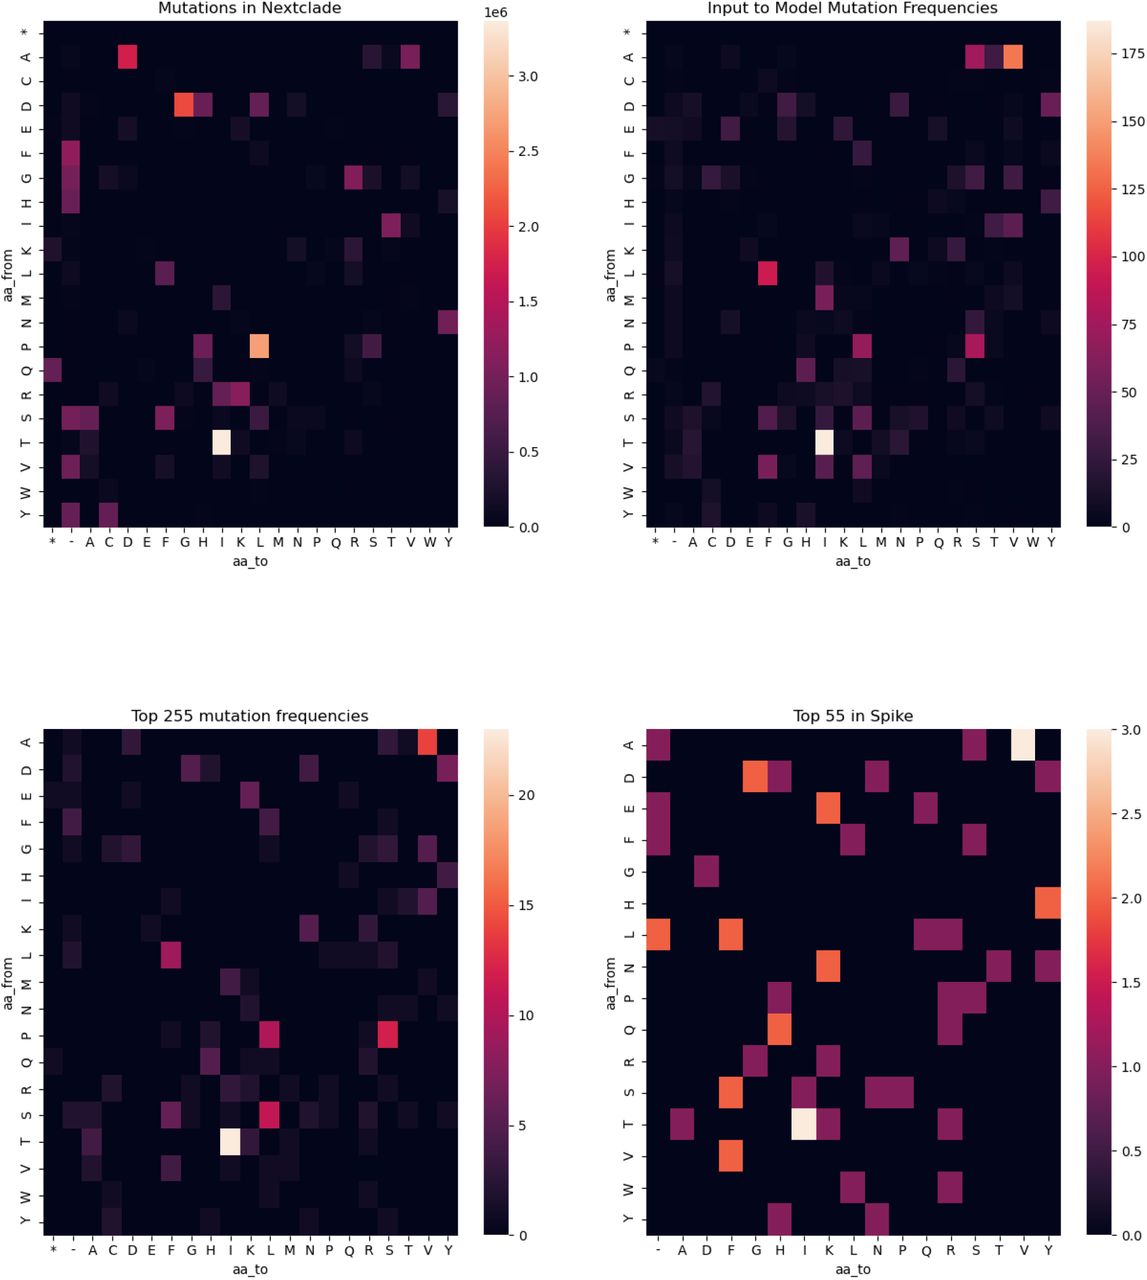
To assess enrichment of amino acid changes between different sets we performed multiple testing corrected one-sided binomial tests of each event type (e.g. I to V). We examined the following sets of mutations and performed comparisons between them: (a) all mutational events available in the input nextclade dataset (b) mutational events that were sufficiently prevalent in nextclade so as to be considered by the model (c) Top 255 amino acid substitutions as scored by Δ log R. (d) Top 55 amino acid substitutions in spike as considered by Δ log R. In comparison with the input set, we did not observe enrichment of the most significant hits for the entire viral genome and spike protein for any mutational event, suggesting the model does not introduce undue biases (Figure S13).
Supplemental Note 1: Detailed description of PyR0 model
Data Preparation
We downloaded 2,231,068 samples from GISAID (13, 14) on July 6, 2021. Each sample record includes labels for time, location, PANGO lineage annotation (11), and genetic sequence. We discard records with missing time, location, or lineage; 2,161,248 records remain. We call mutations using the NextClade tool (23), discarding sequences whose alignment quality is not reported as “good” (sequences discarded in this step are excluded from the mutation features Xsf, but are still included in the counts ytps), and discarding the seven lineages with fewer than 5 good alignments; 1281 lineages remain. Because PANGO lineages are genetically heterogeneous (with small variation within each lineage), we create continuous [0,1]-valued features Xsf denoting, for each lineage (“strain”) s and mutation (“feature”) f, the proportion of samples in that lineage exhibiting the mutation. We discard mutations that do not occur in the majority of samples in any single lineage (i.e. features f with Xsf < ½ for all s); 2337 amino acid mutations pass this threshold. We bin time intervals into 14-day segments, choosing a multiple of 7 to minimize weekly seasonality, but binning coarser than a week so as to reduce memory requirements; this results in 42 time bins.
Because sample counts vary widely across GISAID geographic region (by as much as five orders of magnitude), we aggregate regions into the following coarse partitions: each country counts as a region, and any first level subregion of a country counts as a region if it has at least 50 samples; otherwise it is aggregated into a whole-country bin. Note this means that e.g. a country may be split up into its larger regions, with smaller regions being subsumed into an aggregate country level bin. We then drop regions without samples in at least two different time intervals, resulting in 1070 regions in total.
After preprocessing, the model input data are a T × P × S = 42 × 1070 × 1281 shaped array ytps ∈ ℕ of counts (this array is sparse but it is not sparse along any of its 2-dimensional marginals), and an S × F = 1281 × 2337 shaped array Xsf ∈ [0, 1] of mutation features.
Cases per day (see Figure 2 inset) were estimated by multiplying confirmed case count data from Johns Hopkins University by the estimated proportion of each lineage within each (time, region) bin.
Probabilistic Model
We model relative lineage growth with a hierarchical Bayesian regression model with a multinomial likelihood. Arrays in the model index over one or more indices: T=42 time steps (increments of 14 days) t; S=1281 PANGO lineages (“strains”) s; P=1070 regions (“places”) p; and F=2337 amino acid changes (“features”) f. The model, shown below, regresses lineage counts ytps∈ ℕ in each time-region-lineage bin against amino acid mutation covariates Xsf∈[0,1]. The variables y and X are observed and all other variables in the model are latent. Each latent variable is governed by a prior distribution. The full model is specified as follows, where the observed counts ytps are underlined:
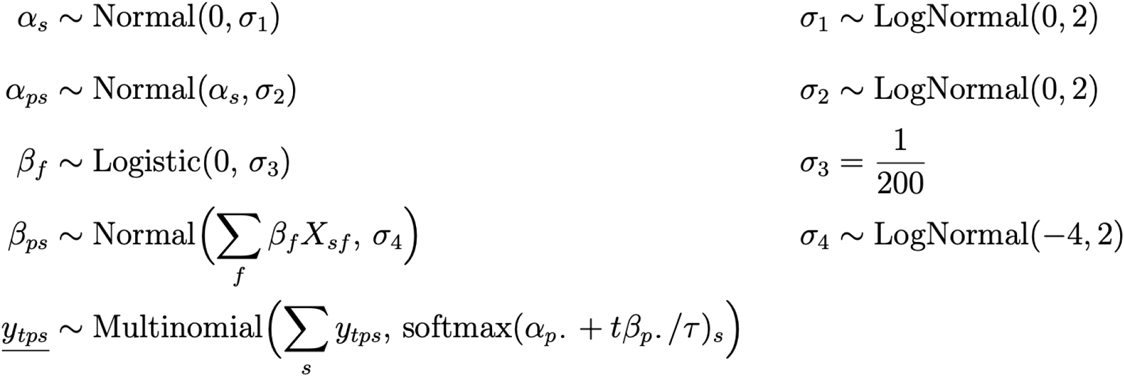
The proportion of lineages in a single time-region bin is modeled as a Multinomial distribution whose probability parameter is a multivariate logistic growth function softmax(αp· + tβp·/τ) with intercept αps and slope βps in units of generation time τ = 5.5 days, where the softmax function inputs and outputs vectors and is defined as
 and where the dot subscripts αp·∈ ℝS and βp·∈ ℝS denote vectors over lineages. Early iterations of the model used overdispersed likelihoods such as Dirichlet-Multinomial to account for additional variability not directly encoded in the generative process. However, we found that we can obtain much more accurate model predictions by using a Multinomial likelihood and accounting for model misfit by adding hierarchical structure elsewhere. The intercepts αps denote initial relative log prevalence of lineage s in region p; these are modeled hierarchically around the global relative log prevalence αs of each lineage. The slopes βps are modeled hierarchically around global per-lineage growth rates Σf βf Xsf that are linearly regressed against amino acid mutation features Xsf. These linear coefficients βf can be directly interpreted as the effect of a mutation on a lineage’s growth rate, all other variation being equal. In figures we plot 𝔼[βf] =: Δ log R as an estimate of effect size and plot the z-score |𝔼[βf]| / 𝕍 [βf]½ =: |µ|/σ as a proxy for statistical significance.
Note that by regressing against amino acid changes we obviate the need to directly incorporate phylogenetic information into the model: if two lineages are close together in a phylogeny, then their amino acid features are likely also similar, so their regressed growth rates will likely be similar. By sharing statistical strength in this way we are also able to make accurate predictions for emergent lineages with few observations. Both of the hierarchies in α and β empirically improve model fit in the presence of heavily skewed observations (e.g. most samples are from the UK, and there is a long tail of sparsely sampled regions).
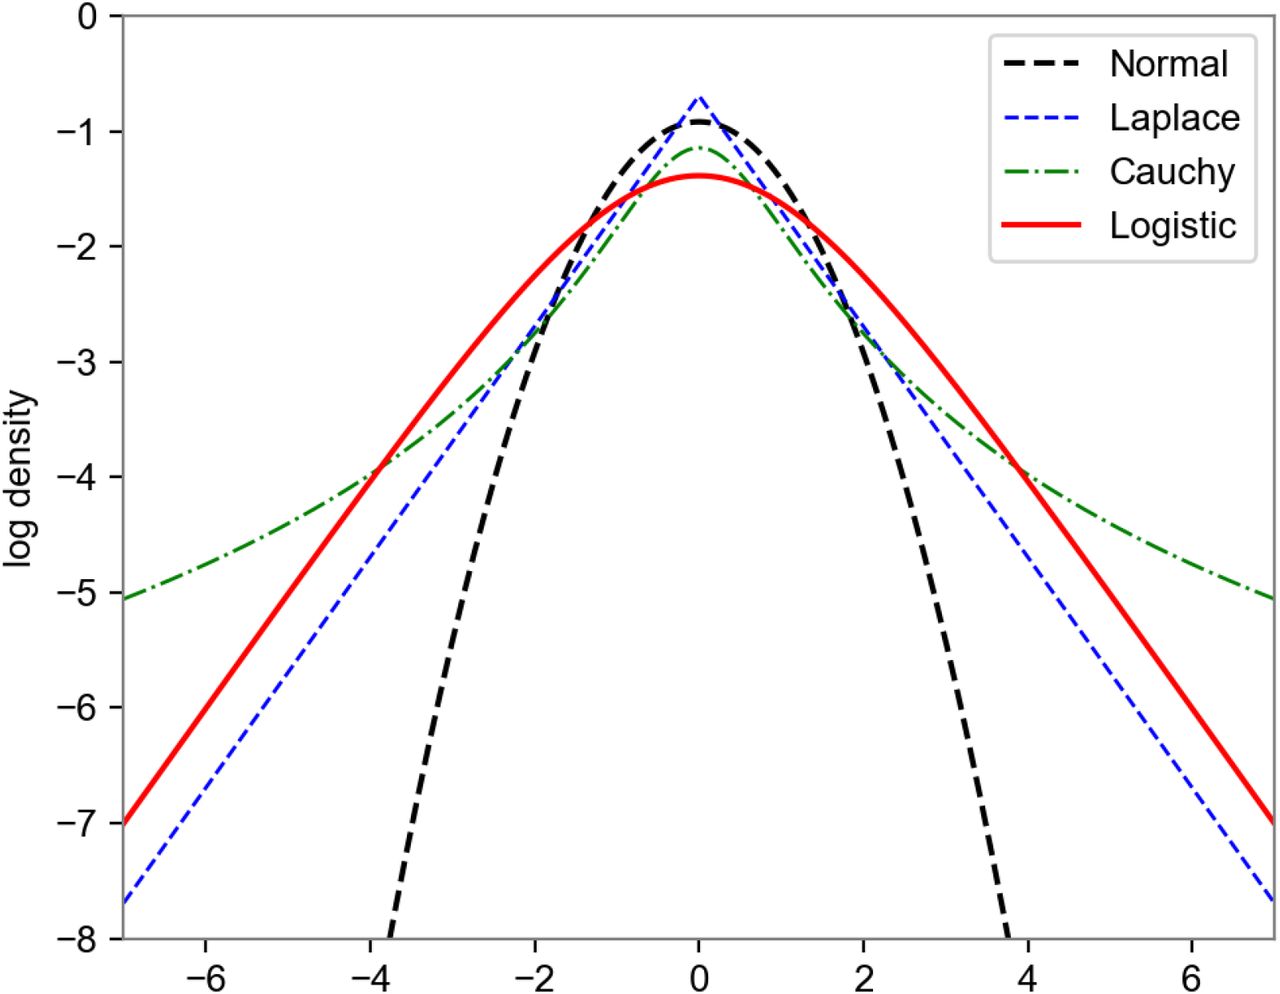
We place weak priors on scale parameters σ1, σ2, and σ4 (these denote standard deviations, the square roots of prior variance). The σ1 and σ2 priors are centered at large values to allow for wide variation in initial infection proportions across regions. The σ4 prior is centered around the smaller value e−4 ≈ 0.018 because we expect little variation of relative growth rate across geographic regions a priori (some variation is expected, due to geographic variations in e.g. age distribution, behavior, or genetics as in binding affinity due HLA complex genotypes (24)). We fix the linear regression scale parameter σ3 to a small value, forcing the regression problem towards a sparse solution (i.e. we assume a priori that most observed mutations have little effect on growth rate). We choose a Logistic prior on regression coefficients because it is heavier-tailed than a Normal prior, but not so heavy-tailed that the regression problem becomes multimodal (as it would for e.g. a Cauchy or Student’s t prior). Like the Laplace distribution, the Logistic distribution is a location-scale family whose exponential tails are maximally heavy while ensuring the conditional log density is concave, leading to a conditionally unimodal posterior and robust inference (see Figure S14). Unlike the Laplace distribution, the Logistic distribution is smooth, with density given by
This proportional growth model differs from many forecasting models in the literature that are formulated in terms of absolute sample counts. We choose to model relative proportions rather than absolute counts because the relative model is robust to a number of sources of bias, including: sampling bias across regions (e.g. one region samples 1000x more than another); sampling bias over time (e.g. change in sampling rate over time); and change in absolute growth rate of all lineages, in any (time, region) bin (e.g. due to changes in local policies or weather, as long as those changes affect all lineages equally). However the model is susceptible to the following sources of bias: biased sampling in any (time, region) cell (e.g. sequencing only in case of S-gene target failure); and changes in sampling bias within a single region over time (e.g. a country has a lab in only one city, then spins up a second lab in another distant city with different lineage proportions).
This model has several advantages over existing approaches. First, it provides a principled, agnostic approach that can be applied to a large dataset to identify lineages that demonstrate concerning epidemiological features. Second, by modeling the relative growth rate of lineages separately across 1070 geographic regions, the model is robust to region-specific differences in non-pharmaceutical interventions and vaccination rates. Third, the hierarchical nature of the model which represents lineages as collections of mutations accurately reflects the underlying biology and yields both strain- and lineage-specific coefficients from a single inferential approach.
Probabilistic Inference
The model is implemented in the Pyro probabilistic programming language (15) built on PyTorch (25). To fit an approximate joint posterior distribution over all latent variables (a space of dimension 2,744,961), we train a flexible reparameterized variational distribution using stochastic variational inference. Our variational approach starts by reparameterizing the model via a sequence of learnable but distribution-preserving transforms: decentering transforms (26) on the α and β latent variables, and a learnable per-region per-lineage time shift in each linear function αps+ tβps/τ. Reparameterizing is particularly helpful in avoiding Neal’s-funnel situations (27) by smoothing out the geometry of latent variables with Normal prior whose scale parameter is also a latent variable. After reparameterizing we model the posterior on the reparameterized linear coefficients βf as a low-rank multivariate Normal distribution (rank 200 covariance + diagonal noise), and model all remaining latent variables as mean field transformed Normal distributions. The low-rank multivariate Normal distribution on βf allows the approximate posterior to capture correlated uncertainty among competing mutations each of which might explain increased growth rate. The combined variational distribution has 7,334,172 parameters.
Variational inference is performed for 10,000 iterations with the Adam optimizer with clipped gradients and an exponentially decreasing learning rate schedule and initial learning rates between 0.05 and 0.0025 for different parameter groups (see Figure S15). Optimization proceeds in batch-mode, i.e. without any data subsampling. We initialize model parameters to median prior values with a small amount of noise added to avoid scale parameters collapsing early in training. After inference we make predictions by drawing 1000 posterior samples. See source code for detailed optimizer and initialization configuration.
Inference and prediction on a single GPU (NVIDIA Tesla P100 with 16GB of RAM) takes under 15 minutes, which is about the same amount of time required to download and preprocess each daily snapshot of data from GISAID. Inference cost is O((TP+F)S) but does not depend directly on the number of genetic samples, since samples are aggregated into counts y of constant shape T×P×S.
We emphasize that inference in this model is very challenging due to the large dimension of the latent space (namely 2,744,961), itself a consequence of the large number of regions, lineages, and mutations considered by the model. While variational inference has a number of attractive features, especially computationally, like any approximate inference scheme it comes with disadvantages. In our case the most notable disadvantage of variational inference is its propensity to yield biased posterior uncertainty estimates. Typically posterior uncertainty is underestimated, leading to credible intervals (CI) that in some cases can be unrealistically narrow. The primary parameters of interest in the PyR0 model are the mutation-level coefficients βf and the per-lineage growth rates Σf βf Xsf. Since the latter quantity governs the prior over βps, which in turn directly feeds into the multinomial likelihood, the per-lineage growth rates are more-or-less tightly constrained by the observed counts ytps. Consequently the posterior uncertainty of per-lineage growth rates is comparatively easy to estimate and we expect variational inference to yield reasonable credible intervals for these quantities. In contrast the mutation-level coefficients βf interact with correlated features Xsf (leading to a multi-modal posterior) and are less directly constrained by the observed counts ytps. Consequently it is significantly more challenging to estimate the corresponding posterior uncertainty. In practice we obtain implausibly narrow credible intervals for these quantities and the posterior uncertainty must be interpreted with caution. Importantly, while the uncertainty estimates for βf should not be taken at face value, we believe that they are still very useful for interpreting inferred model parameters, since they can be used to rank/prioritize different hits βf. In particular, while the absolute magnitudes of βf uncertainty estimates are implausible, their relative magnitudes are plausible and thus useful for ranking. Since we consider a large number of mutations (F=2337) this information is invaluable for designing experiments for functional characterization.
Implementation
We implemented the PyR0 model using the probabilistic programming language Pyro (15). The model leverages PyTorch and Pyro to scale efficiently to large data sets and can therefore be applied continuously as datasets grow, completing model training and prediction with millions of viral genomes in minutes on a single GPU. We chose the Pyro framework because it cleanly separates model specification from inference customization, and scales to large models and datasets by leveraging GPUs. This flexible modeling framework allowed us to experiment with different hierarchical structures. The speed of inference—which took under 15 minutes on a single GPU on the full dataset of >2 million genomes—allowed quick model iteration and thorough validation on subsets of the data, including both geographic cross-validation and temporal backtesting.
Prediction
In Figure 2, the 95% confidence intervals in parentheses were estimated by drawing 1000 samples from the variational posterior distribution. Confirmed cases per day were estimated at the end of the training period (July 6 2021) by combining.
Validation
We considered the possibility of biased submission to the GISAID database and compared results obtained from the full dataset with results obtained from disjoint subsets. For this purpose we divided the data into samples from the most heavily sampled region (Europe, with 1.25M samples) and those from the rest of the world (with 0.9M samples) (Figures S1,S10). This split is motivated by most samples originating from the UK: we widened the region around the UK until the region and its complement both had roughly equivalent statistical strength and narrow posterior estimates. Restricting to either all CDC data or CDC’s randomly sampled NS3 dataset appears to result in insufficient diversity and leads to unclear results (Pearson correlation 0.49, 0.28, resp.). We conducted two-fold cross-validation experiments for both lineages (Figure S1) and mutations (Figure S10).
Our model assumes each single point mutation independently linearly contributes to change in growth rate. A natural generalization is to search for groups of mutations that affect growth rate. To explore this we fit a similar model of both single and pair mutations, considering only pairs that lie within the same gene. Fitting this model discovered no pairwise mutations stronger than the top 100 single mutations. We suspect the GISAID data are underpowered to discover higher-order interactions between mutations, as the hypothesis space grows combinatorially in the number of interacting mutations.
Supplemental Note 2
We include here an extended discussion of high-scoring mutations.
Relation to other viruses
The concentration of putative transmission-promoting substitutions in N at positions 160-210 is remarkable, but is supported by a similar observation in Ebola virus(28), and recent data for SARS-CoV-2 showing mutations in that region increase the efficiency of viral packaging(21), validating some of the model’s most unexpected predictions and supporting its ability to identify novel biology.
Potential functional roles of mutations within ORF1
Our model highlighted mutations within the ORF1 non-structural proteins (nsps) whose functions are not fully understood (e.g. Table S3). We found two predominant clusters within ORF1a: one in the C-terminal ∼120 amino acids of nsp4 and the other within the N-terminal ∼160 amino acids of nsp6 (Figure S12C). Nsp4 and nsp6 are both membrane-anchored proteins with roles in assembly and concentration of the viral replication and transcription complex (RTC) machinery within double-membrane vesicles (29). Amino acid substitutions in these regions, combined with transmission-associated mutations identified within additional RTC-associated nsps (e.g., nsp12-16, Figure S12D), may therefore affect the kinetics of replication and gene expression, resulting in higher virus yields from infected cells. Nsp2, a rapidly evolving accessory protein (30)(31)(32) whose proposed function in disrupting host cell signaling (33) and viral mRNA translation initiation (34) remains obscure, harbored many additional mutations associated with higher transmissibility (Figure S12C).
The ORF1a-ORF1b polyprotein is processed into 16 non-structural proteins by two viral proteases: a papain-like protease (nsp3) and 3C-like protease (nsp5). Multiple transmission-associated mutations were found within the protease coding regions (e.g., ORF1a: I1525V, ORF1a:L3338F). Most of the amino acid substitutions identified by our model were outside of the domains containing catalytic residues for nsp3 (C1674, H1835, D1849) or nsp5 (H3304, C3408) (35)(36). However, the potential effects of these mutations on protease architecture and activity warrant further experimentation. A few of the top mutations from our model (e.g., ORF1a:T3255I, ORF1b:Q2403L) are positioned adjacent to nsp cleavage sites, potentially influencing local structures and kinetics of polyprotein processing by nsp3 and nsp5 (Figure S12C-D).
Multiple highly-ranked mutations are distributed across the replication and transcription-associated nsps in ORF1b (Figure S12D). The P314L (P323L) mutation in nsp12 – the viral RNA-dependent RNA polymerase (RdRP) – emerged early during the pandemic and became established in circulating lineages alongside S D614G (6). A second variant at this site (P314F) was also highly ranked in our list. Additional mutations in nsp12 can be found adjacent to the canonical fingers (A390V) and within the palm (E735D) subdomains of the RdRP conserved catalytic site. The functional effects of these mutations on polymerase processivity and fidelity remain to be investigated. A structural model of the SARS-CoV-2 polymerase complex has been resolved (37)(38), and contains a single subunit of nsp12, two subunits of the nsp13 helicase, and additional RdRP cofactor proteins (nsp7, 8, and 9). The ORF1b P314 residue is located at the interaction interface between nsp12 and a single subunit of nsp8. Moreover, one of the top mutations from our dataset, ORF1b:S1003G, is harbored within the nsp13 N-terminal zinc-binding domain that directly interacts with nsp8 (39). These findings implicate transmission-associated mutations within the SARS-CoV-2 RNA synthesis machinery in altering the stability of the replication complex, possibly via interactions with nsp8.
Nsp14 is a dual-functional enzyme with N-terminal 3’-to-5’ exonuclease (ExoN) and C-terminal guanine-N7 methyltransferase (N7-MTase) activities (40)(41) and is a core component of the coronavirus RNA proofreading complex. Nsp14 is uniquely responsible for excision of mismatched bases from the nascent RNA and methylation of the viral mRNA cap structure. Two mutational hotspots in nsp14 map to discrete regions in the ExoN (L1681F and T1730I) and N7-MTase (F1901L and P1936H) domains. The functional consequences of these clusters of transmission-associated mutations on mRNA synthesis and genome replication remain unknown.
Supplementary Figures

A. Sensitivity of lineage growth rate estimates to data subset. We depict the relative growth rate of all lineages as estimated by either the full data or two disjoint geographic subsets (within Europe and outside Europe). High Pearson correlation (ρ) suggests estimates are largely insensitive to data subset. B. Estimates of fold increases in reproductive number for the top 20 lineages. Sensitivity analysis shows consistency across estimates from subsets of the data in different geographic regions.

Simulation study assessing bias. Distribution of inferred growth rate of new lineages as a function of time, for a simulated neutrally evolving viral population. The most successful subclades of each generation are designated as new lineages, leading to a trend toward higher estimated growth rate even though all lineages are equally transmissible.

Observed and estimated proportions of top lineages. We depict raw count proportions (solid circles at the beginning of each two-week time interval) together with the models imputed and three-month forecasted estimates of the top 10 lineages in three regions (note Brazil and England are both combinations of multiple spatial units; California is a single spatial unit). Predictions are shown on a scale of [0, 1] with means and 95% confidence intervals. Each trend is represented by only two numbers in the model (a slope and an intercept); the complex shapes of trends result from the multivariate logistic function applied jointly to multiple competing trends.
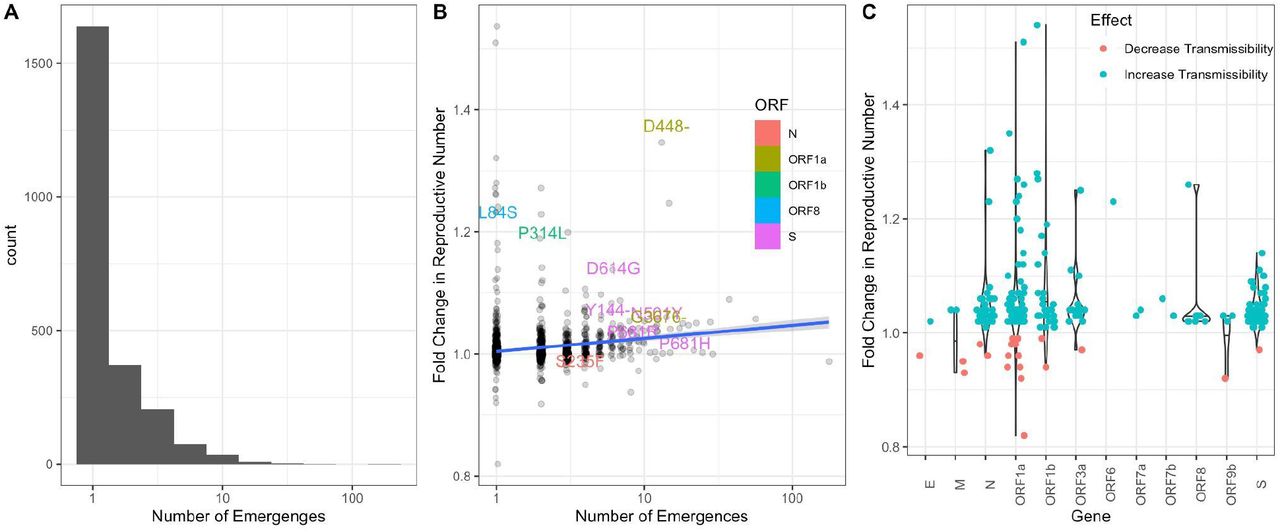
A. Histogram of the number of independent emergences across all observed mutations. A mutation was considered to have emerged independently if it was present in a lineage but not in its parent. B. Scatterplot of the fold-change in reproductive number versus the number of independent emergences. The top 10 ranked mutations are labeled, colored by ORF. Linear regression with standard error for the slope given as shaded area. C. Violin plots of fold-change in reproductive number for mutation, grouped by gene. The top 10% most statistically significant mutations are shown (where significance is determined by z-score of the approximate variational posterior).

Accuracy of predicted growth rates for 500 lineages based solely on their mutation content. Left plot: estimated log(R/RA) for each lineage based on the full set of GISAID samples (x axis), and on the leave-one-out subset with each lineage’s subclade removed and the growth rate estimated from the mutations present in the lineage (y axis). Right plot: the same quantities but relative to a baseline estimator in which each child lineage’s growth rate is the same as that of its parent lineage. Both comparisons highlight the CDC’s variants of concern and variants of interest. The lineages selected for testing are those with at least 100 samples and with the largest deviations from their parent, i.e. where the baseline estimator performs worst. Note that the growth rate of child lineages can deviate substantially from that of the parent (Figure S16); e.g. B.1.617.2 and B.1.621 are markedly more transmissible than their parents.

Forecasts for backtesting. (A) Prediction for rise of B.1.1.7 in England using data through early November 2020 (solid circles at the beginning of each two-week time interval). Future data points, not used during the model training, are shown in crosses. (B) Prediction for rise of B.1.617.2 using data through the end of April 2021.


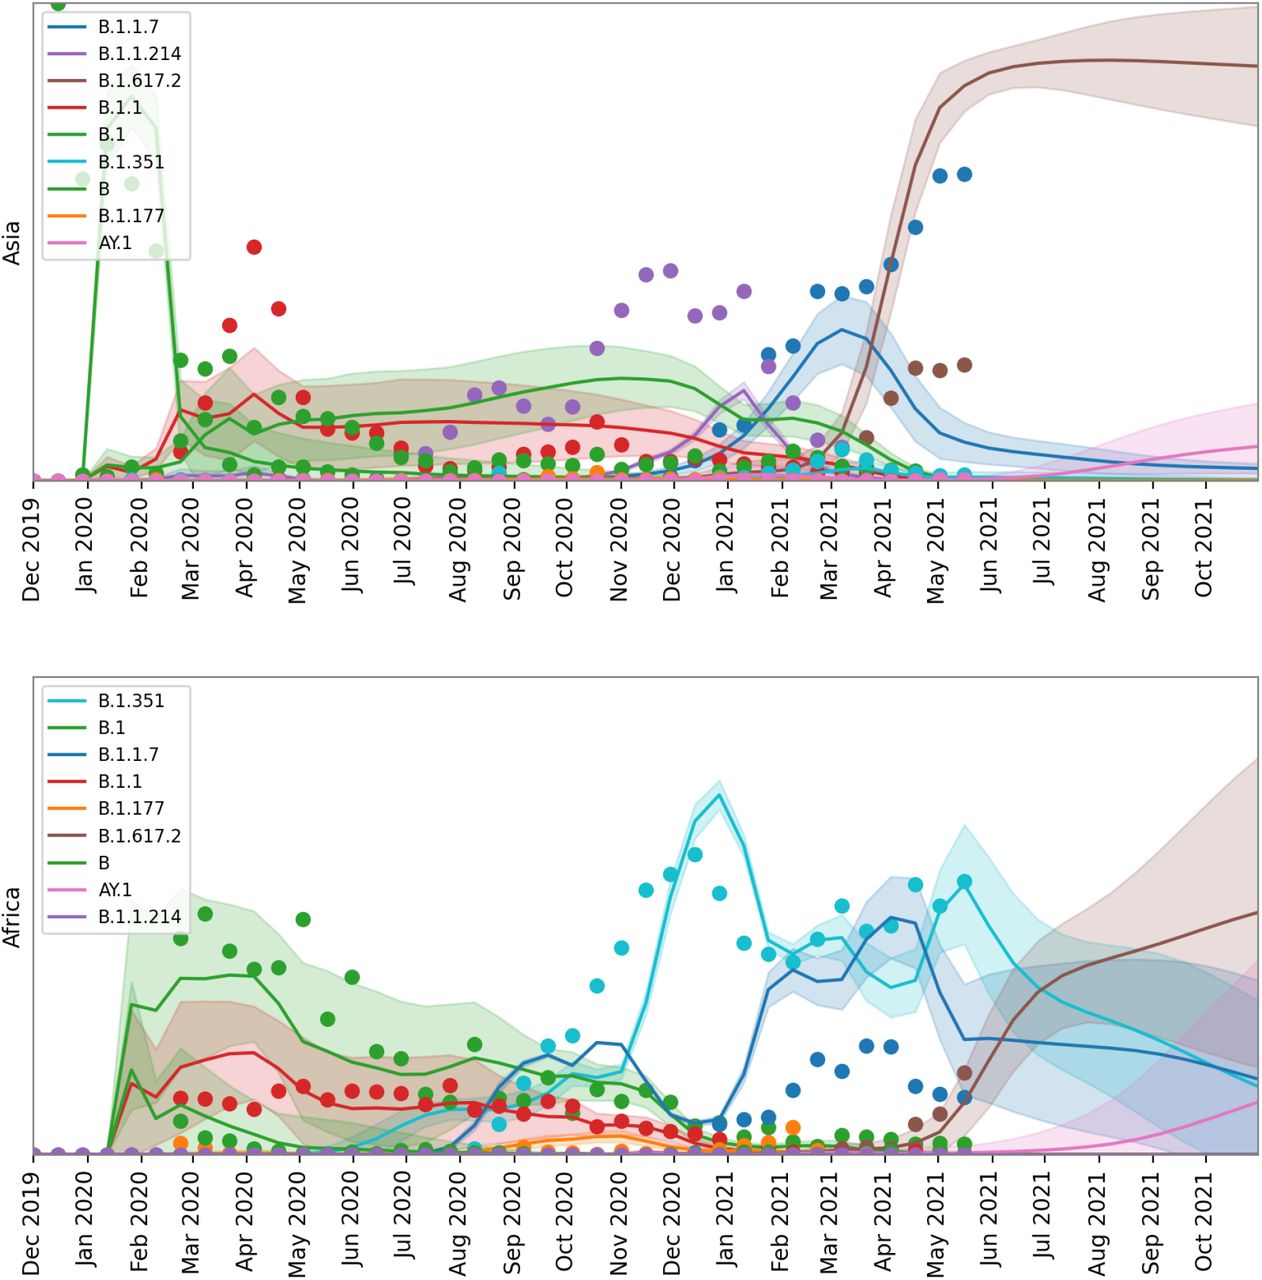
Forecasted top lineages. We depict model forecasts for Africa, Asia and Europe for the union of the top five lineages from each region.

Forecasting evaluation. We evaluate the accuracy of PyR0 forecasts using the Kullback-Leibler (KL) divergence between observed and predicted lineage proportions. Each curve represents a forecast trained on data through a particular date (e.g. red curves utilize ∼500 days of training data). As we would expect, forecasts improve (lower KL) as the amount of training data increases and degrade (higher KL) as we forecast further into the future. Refer to Table S3 for an alternative forecasting metric.

Volcano plot highlighting the most statistically significant mutations linked to increased growth rate. The x-axis depicts the effect size as a ratio of estimated reproductive number of lineages with-versus-without each mutation. The y-axis depicts z-score from the approximate variational posterior as a proxy for statistical significance. The top 50 most statistically significant mutations are labeled, colored by gene. The 258 growth-associated mutations with z-score greater than 5 are shaded dark gray.

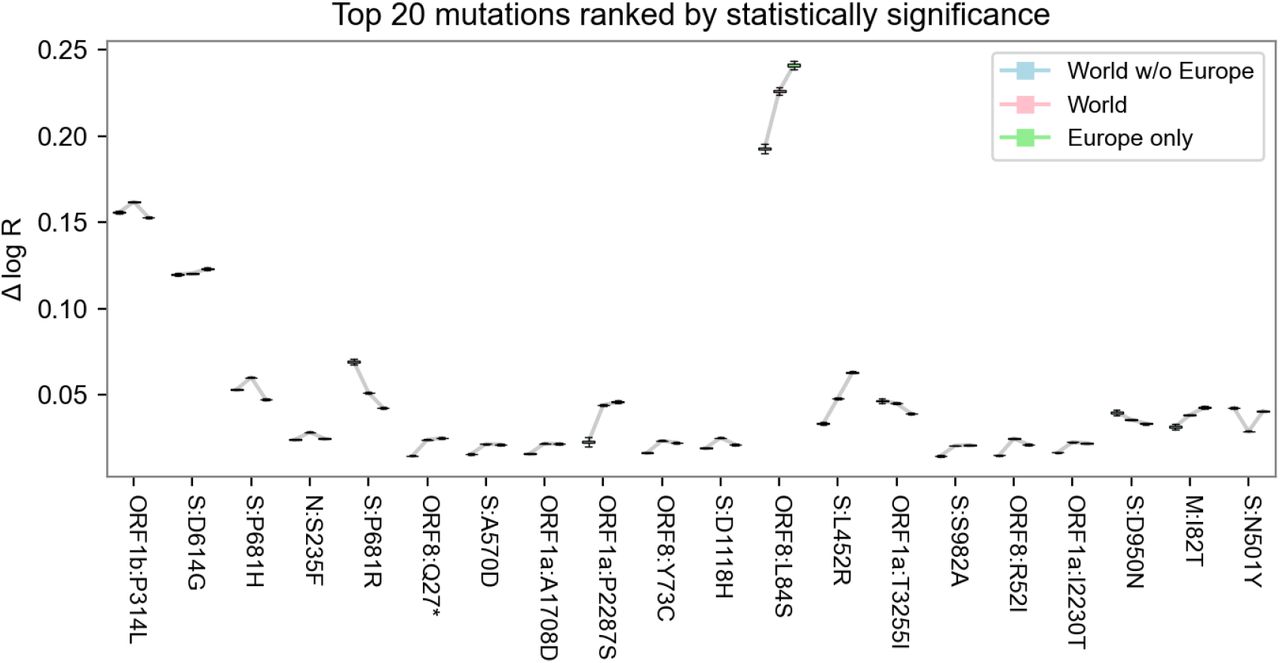
Sensitivity of mutation estimates. A. Scatterplot of the mutation coefficients on the full model and geographic subsets, with Pearson correlation (ρ) as shown. B. Box-and-whisker plot depicting estimated growth rates with corresponding uncertainties for the 20 lineages with highest growth rate (effect size) across geographic subsets. C. Same as B but with the top 20 lineages sorted by statistical significance (z-score). Note that in B, the World estimates (center) tend to be higher than subsets (left and right) only because the ranked selection is based on those estimates.

Information content of different subsets of the SARS-CoV-2 genome in explaining transmissibility. The metric is the evidence lower bound (ELBO), the variational approximation of marginal log likelihood (higher is more informative). The dotted line at the top shows the performance of the full model that regresses against all genes (A) or against all of ORF1 (B). The circles show estimators based on only single genes (A) or single nonstructural proteins (B). The most informative genes are S, ORF1b, N, and ORF1a; within ORF1 the informative nsps are nsp12, 6, 3, 13, 4, and 14; other nsps provide negligible information. The bottom dashed lines show the performance of a naive estimator that assumes all lineages have the same growth rate.


Manhattan plot details of the four most informative genes. See figure 3 for a whole-genome view and figure S10A for ranking by information. A. View of the 1237 amino acids of the S protein, annotated by structure (42); many mutations occur in the N-terminal domain (NTD), receptor-binding domain (RBD), and furin cleavage (FC) site. Regions containing the fusion peptide (FP), heptad repeat (HR) 1 and 2, transmembrane domain (TM), and C-terminal domain (CTD) are annotated. B. View of the 419 amino acids of the nucleocapsid (N) protein domains, annotated by structure (43); many mutations occur in the serine–arginine rich region (SR), identified by (44) as immunogenic. C. View of the ORF1a polyprotein, including 11 non-structural proteins (nsps). D. View of the ORF1b polyprotein, including nsp12-16; note the amino acid positions do not account for 9 additional residues at the N-terminus of nsp12 (RNA polymerase) resulting from the −1 ribosomal frameshift.

Heatmaps of Frequency of amino-acid changes in different subsets of the data. Clockwise from the top left: (a) Mutations retrieved from nextclade (b) Mutations that were input to the model (c) Top 255 mutations from entire viral genome (d) Top 55 mutations in Spike portion of the genome.

Density of the Logistic distribution, used as a prior on mutation coefficients βf.
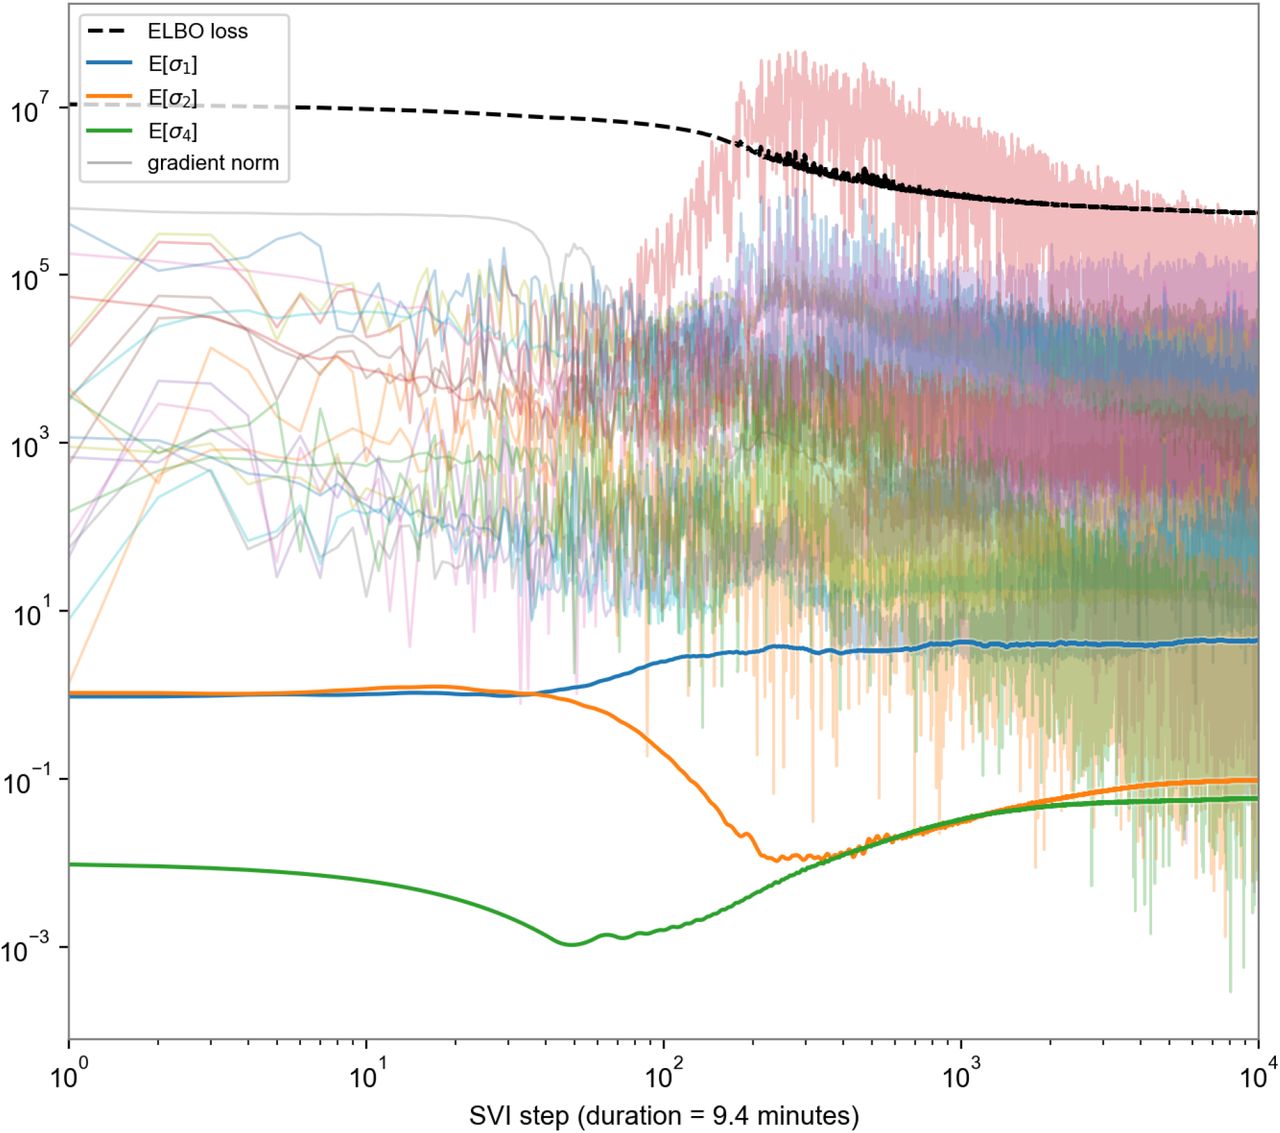
Convergence of inference. Convergence of ELBO loss (dotted black line), posterior means of scale parameters (thick colored lines), and gradient norms of various parameter tensors (light colored lines) over time. Note the time axis is on a log scale, so there is negligible change in the last 5,000 of 10,000 steps.
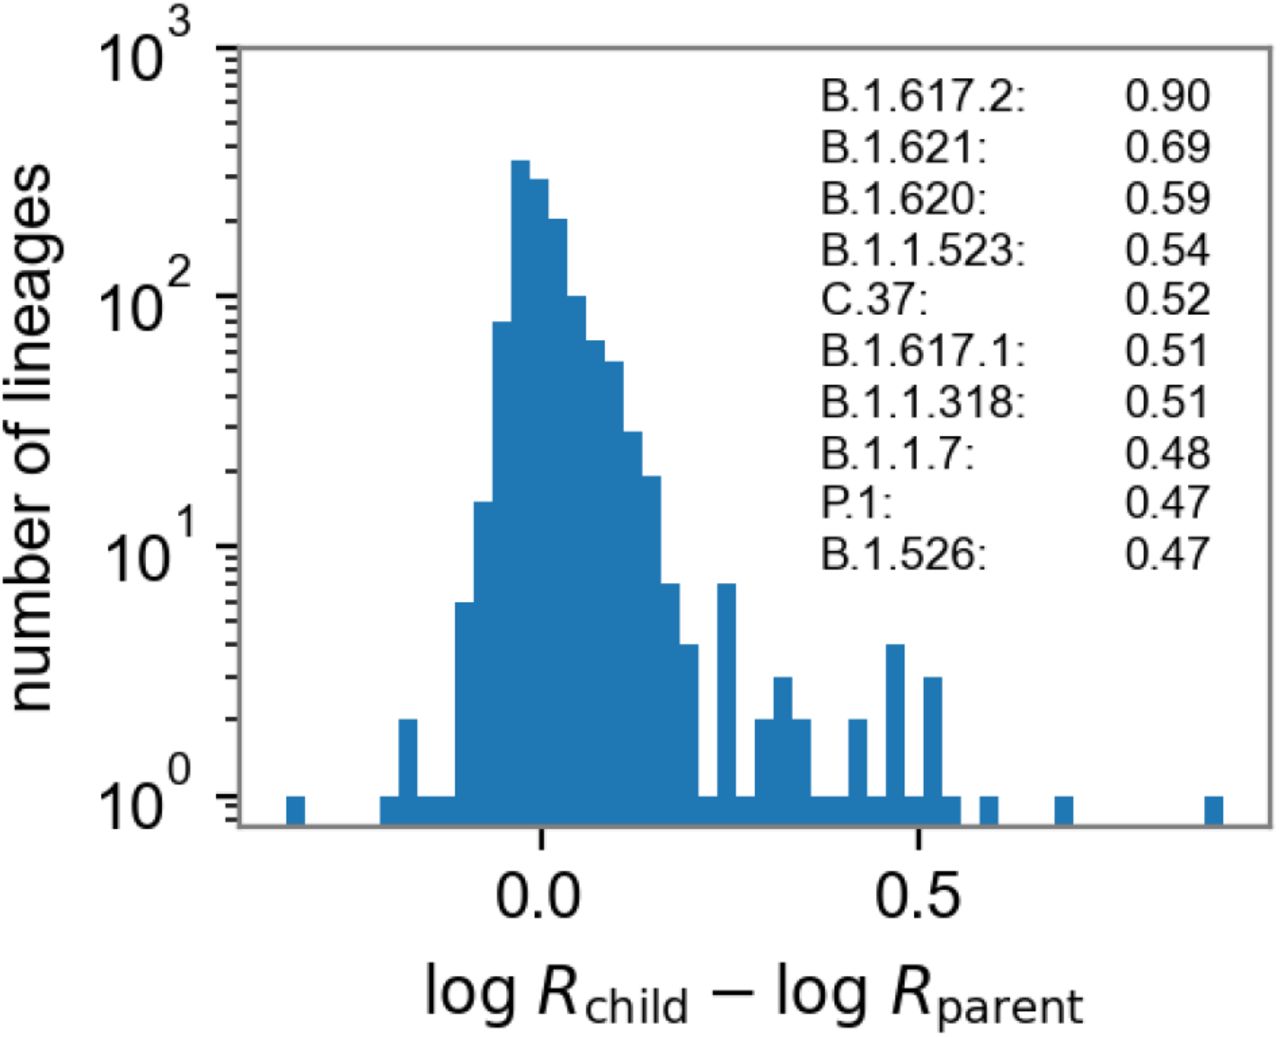
Distribution of lineage growth rates. We report differences in estimated log growth rates of 1279 child/parent lineages (early lineages A and B are excluded as children). Strikingly the distribution is skewed to the right, with 15 (resp., 33) child lineages exhibiting growth rates that are at least 50% (resp., 25%) higher than the corresponding parent lineages. The 10 child lineages whose growth rate exceeds that of their parents by at least 60% are listed in the figure. The bottom dashed line shows the performance of a naive estimator that assumes all lineages have the same growth rate.
Regional evaluation of forecasts. We evaluate the ability of PyR0 to accurately forecast the dominant lineage 4- and 8-weeks into the future in six selected regions with a relatively large number of GISAID samples. Percentage accuracies are obtained by averaging over many training windows, with the earliest ending on April 19th 2020 (i.e. backtesting).
Spatial structure of the inferred amino acid coefficients βf. We report one-sided p-values for the Moran I spatial autocorrelation statistic computed using a permutation test. We use a gaussian weighting function of the form exp(-distance2/lengthscale2), where distance is measured in units of nucleotides. We find that there is significant evidence for spatial structure in the S gene as well as across βf as a whole.
Table of the Top-scoring mutations in spike, ORF1b, and nucleocapsid. The top 5 mutations for each of the listed ORFs is shown. The final column lists the lineages these highly ranked mutations have emerged in. Mutations such as S:N501Y, S:P681[HR], and N:R203[MK] have emerged independently in VoC lineages.
Funding
This work was sponsored by the U.S. Centers for Disease Control and Prevention (BAA), as well as support from the Doris Duke Charitable Foundation (J.E.L.), the Howard Hughes Medical Institute (P.C.S.), and the Evergrande COVID-19 Response Fund Award from the Massachusetts Consortium on Pathogen Readiness (J.L.).
Author contributions
Conceptualization: F.O., S.F.S., J.E.L., M.J.
Data curation: F.O., N.B.
Formal Analysis: F.O., S.F.S, M.J., N.B., J.E.L.
Funding acquisition: B.M., P.C.S, J.L., J.E.L.
Investigation: all authors
Methodology: F.O., S.F.S, M.J., J.E.L.
Project administration: all authors
Software: F.O., N.B., M.J.
Supervision: D.J.P., B.M., J.L., P.C.S., J.E.L.
Validation: F.O., N.B., M.J., S.F.S.
Visualization: F.O., J.E.L., N.B., J.P., S.F.S.
Writing – original draft: F.O., S.F.S., B.M., P.C.S, J.E.L.
Writing – review & editing: all authors
Authors have no competing interests.
Data and materials availability
We gratefully acknowledge all data contributors, i.e. the Authors and their Originating laboratories responsible for obtaining the specimens, and their Submitting laboratories for generating the genetic sequence and metadata and sharing via the GISAID initiative (GISAID Initiative and global contribu…) on which this research is based. A total of 2,160,748 submissions are included in this study. A complete list of 2.1million accession numbers are available at https://github.com/broadinstitute/pyro-cov/blob/master/paper/accession_ids.txt.zip
List of Supplementary materials
Materials and Methods
Supplemental Note 1: Detailed description of PyR0 model
Supplemental Note 2
References (22 – 43)
Data S1 (strains.tsv), S2 (mutations.tsv)
Acknowledgements
We acknowledge helpful discussions and feedback from Du Phan, William Hanage, Christopher Tomkins-Tinch, Shira Weingarten-Gabbay, Katie Siddle, Sagar Gosai, Steven Reilly, Eli Bingham, Mehrtash Babadi, and Holly Soutter. We gratefully acknowledge the authors from the originating laboratories and the submitting laboratories, who generated and shared via GISAID genetic sequence data on which this research is based.
References and Notes


