
Abstract
Knowing the age-specific rates at which individuals infected with SARS-CoV-2 develop severe and critical disease is essential for designing public policy, for epidemic modeling, and for individual risk evaluation. In this study, we present the first estimates of these rates using multi-country serology studies, together with public data on hospital admissions and mortality. Our results show that the risk of severe and critical disease increases exponentially with age, but much less steeply than the risk of fatal illness. Importantly, the estimated rate of severe disease outcome in adolescents is an order of magnitude larger than the reported rate of vaccine side-effects; thus, showing how these estimates are relevant for health policy. Finally, we validate our results by showing that they are in close agreement with the estimates obtained from an indirect method that uses reported infection fatality rates estimates and hospital mortality data.
The SARS-CoV-2 pandemic had impacts of historic proportion in both public health and society. Remarkably, there is considerable uncertainty regarding the full spectrum of health effects of SARS-CoV-2 infection. On the one hand, some of the effects of SARS-CoV-2 are relatively well understood, such as the infection fatality rate (IFR) and its dependence on age. Three different meta-analyses now exist that estimate the age-stratified IFR of SARS-CoV-2 using multi-country seroprevalence studies (Levin et al, O’Driscoll et al, Brazeau et al). These studies document an exponential increase of the IFR with age and show considerable agreement on their estimated IFRs by age-stratum. On the other hand, the rate of less extreme infection outcomes, and their dependence on age, remains uncertain despite being similarly important for public health. Examples of this are the rate of severe infections (ISR), which we define as infections resulting in hospitalization or out-of-hospital death, and the rate of critical infections (ICR), which we define as infections resulting in critical care admission or out-of-ICU death.
Knowing the age-specific ISR and ICR is essential for many reasons. One particularly important and pressing example where this information is required is in defining recommendations of vaccination of children and adolescents. Recent reports point to a link between mRNA vaccines and myocarditis (a relatively mild condition) in young people, even if at low rates (Montgomery et al., 2021). One report from Israel estimates that between 1/3000 and 1/6000 individuals between 16-24 years old may develop this condition after vaccination (Vogel & Couzin-Frankel, 2021). This, together with the low risk that children and adolescents face from COVID-19 (Brazeau et al., 2020; Levin et al., 2020; O’Driscoll et al., 2020), has raised questions about the cost-benefit balance of vaccinating young individuals (Vogel & Couzin-Frankel, 2021). But despite their relevance to this discussion, serology-based estimates of ISR and ICR for these ages using multi-country data are still missing from the literature (see Hozé et al. (2021) and Lapidus et al. (2021) for serology-based estimations of the infection-hospitalization rate using data from France, and Verity et al. (2020) for a model-based analysis of the ISR).
To fill this gap in current knowledge, we estimated the age-specific ISR and ICR of SARS-CoV-2 infection using seroprevalence studies from different locations (listed in Table M1), together with public data on the numbers of age-stratified hospitalizations, ICU admissions, and deaths (sources listed in Table M2). All studies were extracted from the list curated in Levin et al. (2020), and we refer the reader to that study for further details. We included in the analysis 12 locations with serosurveys (9 using representative samples and 3 using convenience samples), and 2 locations with comprehensive testing and contact tracing, which we corrected for under-ascertainment using seroprevalence data from Iceland, following Levin et al. (2020). Together, these locations represent 5% of the world’s population.
Also, considering that out-of-hospital and out-of-ICU deaths are common among the elderly, we added the out-of-hospital and out-of-ICU deaths to the reported hospitalizations and ICU admissions, to obtain the severe and critical cases respectively. For some locations this information was available; for the other locations we estimated the out-of-hospital or out-of-ICU deaths using data on the total deaths and hospital and ICU mortality estimates.
The estimated probability of severe, critical, and fatal disease outcomes (ISR, ICR, and IFR respectively) are shown for each age and location as colored points in Figure 1, using a log-transformed vertical axis. As expected from the reports in previous analyses of IFR (Brazeau et al., 2020; Levin et al., 2020; O’Driscoll et al., 2020) and of the infection-hospitalization ratio (Hozé et al., 2021), the three outcome ratios show an approximately exponential increase in risk with respect to age, which becomes a homogeneous linear effect on the log-scale. We used this observation to fit models that allow us to estimate those ratios for all ages and locations together, improving the accuracy of estimates at young ages where these adverse outcomes are less frequent (similar to (Levin et al., 2020)). Specifically, for each of the infection rates (ISR, ICR, and IFR) we fitted Bayesian logistic regression models with a linear age effect on the logit scale (this effect becomes non-linear in the risk scale). The random-effects logistic regression model had a linear component (intercept and age-slope) shared across locations, plus location-specific random effects on both the slope and the intercept of the regression.
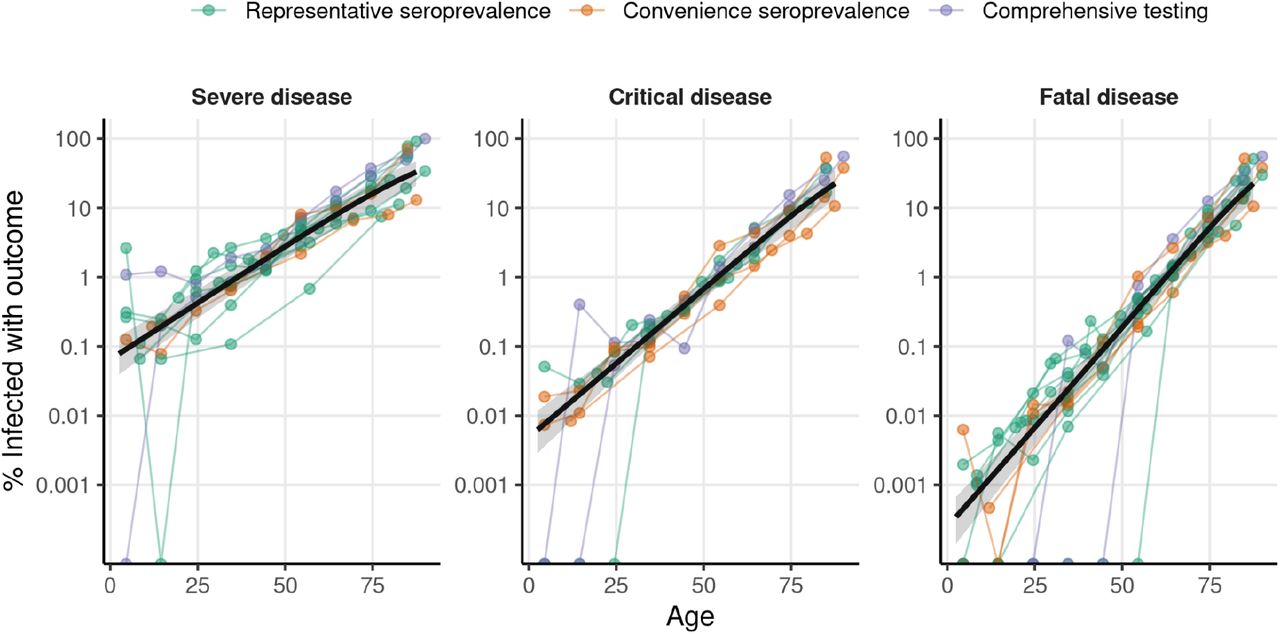
The colored points show the proportion of individuals infected with SARS-CoV-2 that develop severe disease (left), critical disease (center), or fatal disease (right) (in logarithmic scale) for each location and age-stratum used in our analysis. Color indicates whether the number of infections were obtained from a representative serosurvey, a convenience serosurvey, or from comprehensive testing corrected for under-ascertainment. Data points coming from a given location are joined by colored lines. The black line shows the outcome rate estimated using a hierarchical Bayesian logistic regression model, and the shaded regions show the 95% credibility intervals. We used 88 data points from 13 locations for the estimation of ISR, 75 data points from 10 locations for ICR, and 102 data points from 14 locations for IFR.
The logistic regression models fitted the data well for the three outcome rates (Figure 1), and the patterns observed were similar across locations. Importantly, the slope of IFR with respect to age (0.134, 95% credibility interval: [0.120-0.149]) was higher than the slope of ICR (0.100, [0.086-0.114]) and of ISR (0.076, [0.065-0.087]). As an example, according to our estimates, people in the 20-25 years old range are on average 836 [391-1668] times less likely to die from COVID-19 than 70-75 year old people, 146 [72-277] times less likely to develop critical disease, and 41 [23-65] times less likely to develop severe disease. Predicted risk levels by age (and the corresponding 95% credibility intervals) are shown in Table 1 (see Table S1 for finer age stratification, and Table S2 for the estimated model parameters). Our results are in agreement with those of Lapidus et al. (2021) and Verity et al. (2020), who also reported smaller effects of age on the hospitalization-infection ratio as compared to IFR. However, the present study is to the best of our knowledge the first quantitative comparison of ISR, ICR, and IFRs dependence with age using multi-country serology data. Also, we verified that our estimates are robust to the correction for out-of-hospital and out-of-ICU deaths (Figures S1,S2), the ages used to fit the model (Figure S3), the method of estimating SARS-CoV-2 infections (Figure S4), the date of outcome data collection (Figures S5,S6), and the delay between the epidemic wave and the seroprevalence study (Figure S7, to control for seroreversion). More details about these comprehensive robustness analyses are provided in the Supplementary Materials.
Estimated age-specific frequencies of severe disease (ISR), critical disease (ICR), and fatal disease (IFR) among infected individuals. The estimates are obtained from the fits to the serology data shown in Figure 1. Numbers in the parenthesis indicate 95% credibility intervals of the estimates, obtained by taking the 2.5% and 97.5% quantiles of the posterior probability of the bayesian fit.
As a reference, using a 1/4000 rate for mRNA-vaccine-induced myocarditis in the 16-24 year old range (Vogel & Couzin-Frankel, 2021), our estimates suggest that the rate of myocarditis among vaccinated individuals is 12 [7-19] times lower than the rate of severe disease among infected individuals (the ISR), and 1.4 [0.8-2.2] times lower than the ICR for this age range. Likewise, the reported frequency of myocarditis is 7.2 [4.4-13.5] times larger than the IFR for this age range. Although a detailed risk analysis that compares these rates should include other relevant factors (such as the infection risk for vaccinated individuals), the difference in one order of magnitude that we observe between ISR and the rate of myocarditis highlights the importance of our estimates for any cost-benefit analysis of children and adolescent vaccination, particularly considering that the reported cases of vaccine-induced myocarditis have been mostly mild (Montgomery et al., 2021; Vogel & Couzin-Frankel, 2021).
Next, we validated our estimates by estimating the ISR and ICR of SARS-CoV-2 indirectly using a ratio-of-ratios approach. We start from the age-specific IFR reported in the three different meta-analyses (Brazeau et al., 2020; Levin et al., 2020; O’Driscoll et al., 2020), which were not used in the analysis of Figure 1. Because the age-specific IFR is the expected ratio between deaths and infections for a given age, if we know the expected ratio between deaths and severe infections for this age (the severe fatality rate, SFR), we can then obtain the age-specific ISR by taking (the age-specific) ratio IFRs/SFRs. To approximate the SFR, we used data on hospital mortality for COVID-19 patients, which is the ratio between in-hospital deaths and hospitalizations. This approximation is expected to hold well for all but the oldest age bins (see Supplementary Section S2, Figures S1,S2). We fitted a Bayesian logistic regression model (like the one used to generate the results in Figure 1) to hospital mortality data of COVID-19 patients (Figure 2A, data sources listed in Table M3). Then, we took the ratio between the age-specific IFRs and the estimated age-specific hospital mortalities to obtain ISR estimates. We then applied the same procedure using the mortality of COVID-19 patients in critical care, to obtain estimates of the ICR. The age-specific estimates of hospital and ICU mortality obtained by this method are shown in Table S3, and the obtained values of the model parameters are shown in Table S4.

A) The colored points represent the reported mortality rates of hospitalized (top) and ICU SARS-Cov-2 patients, each study is reported in a different color. The black line shows the estimated outcome rates for each age obtained from our hierarchical Bayesian logistic regression, and the shaded regions show the 95% credibility intervals. 68 data points from 8 reports were used for hospital mortality, and 43 data points from 8 reports were included for ICU mortality. B) The colored points show the estimated rates of severe (left) and critical (center) disease, obtained by dividing the age-stratified IFRs of the three relevant meta-analyses (Brazeau et al., 2020; Levin et al., 2020; O’Driscoll et al., 2020) by the corresponding values obtained in A). The points show the mean values of the posterior distribution, and bars show 95% credibility intervals (we omit these for Brazeau et al. since the credibility intervals around the mean estimates are not reported). The rightmost plot shows the IFRs reported by each of the studies. The black line and shaded region in each panel show the meta-analysis estimates we obtained with the direct method (Figure 1).
We note two relevant details from this method. First, we used the same hospital and ICU mortality data for this analysis and for correcting for out-of-hospital and out-of-ICU deaths in Figure 1. Although this means that the two analyses share some data in common, the results of the regression of Figure 1 are similar when performed on the uncorrected data (Figures S1,S2), supporting the use of this validation method. Second, although it is possible to correct for out-of-hospital and out-of-ICU deaths, instead of only approximating the SFR as the hospital mortality, the effect is expected to be small for most ages, and such a correction would involve using some of the same data as in Figure 1. Thus, to keep the two estimation methods as independent as possible for the purpose of validation, we chose not to correct for out-of-hospital and out-of-ICU deaths.
The estimates from the indirect method are shown by the colored points in Figure 2B. To aid comparison, we show in black the lines obtained from the fit to serology data of Figure 1. Firstly, we see that our IFR estimates and the IFR estimates from the three meta-analyses are very similar (Figure 2B, right). Second, we note that the estimates of ISR and ICR obtained from seroprevalence and disease outcome data with the direct method (Figure 1) are in close agreement with the estimates obtained with the indirect method (Figure 2B, left and center, with the largest differences being with Brazeau et al. (2020) for the younger ages; however, this study also reports estimates different than those reported in the other two studies).
In conclusion, we presented the first estimates of age-specific ISR and ICR of SARS-CoV-2 using multi-country serology data. Our estimates show that, as with other SARS-Cov-2 outcomes, the ISR and ICR increased exponentially with age; however, the rate of increase in the risk of severe and critical disease outcomes with age is less marked than the rate of increase in lethality due to SARS-Cov-2 infection. We validated our estimates through several robustness analyses (see Supplementary materials) as well as using a different source of data and an alternative estimation method (a ratio-of-ratios).
The results presented in this study are an essential input for the cost-benefit analyses that many countries need to conduct when making policy decisions. Although we do not present any specific cost-benefit or risk analyses in this work, we discuss the example of recommendations around children and adolescent vaccination as an important issue where our results may be a particularly relevant and timely contribution. Also, besides their use for determining official public-health recommendations, our results can also be used to develop a more complete and accurate public communication campaign of COVID-19 health risks for young and middle-aged individuals, who are the most hesitant about COVID-19 vaccination (Murphy et al., 2021).
Our results are also highly relevant for other aspects of COVID-19 modeling, such as estimating the number of unreported infections from hospital and ICU data, allowing to better estimate the present levels of natural immunity (Hozé et al., 2021; Irons & Raftery, 2021; Russell et al., 2020); prediction of the effects of public-health policies implemented along the pandemic (Davies, Barnard, et al., 2021); evaluating policy decisions such as vaccine allocation (Matrajt et al., 2020); the prediction of health outcomes in countries with high or low vaccination rates that account for the age-distribution of each country (Davies et al., 2020; Sandmann et al., 2021).
Finally, it is worth noting that advances in the medical care of COVID-19 may change the ISR and ICR (Asch et al., 2021). Our estimates reflect what was observed in 14 locations from developed countries in 2020. At the same time, because our estimates are based on data from 2020, our estimates do not reflect possible effects of the of variants of concern (VOCs) on ISR and ICR, which may not only lead to more transmission but also to higher rates of hospitalization and ICU admissions (Davies, Jarvis, et al., 2021). However, estimating the rates of severe and critical disease for VOCs using serological data will be challenging because of the current population immunity from previous infections and vaccination, and it is likely that the ISR and ICR of VOCs will have to be estimated relative to the pre-VOC rates (Davies, Jarvis, et al., 2021), such as those reported in this work.
Materials and Methods
The data sets included in this study come from locations where age-stratified seroprevalence studies have been performed (see M1), plus locations with age-stratified prevalence coming from exhaustive contract tracing (see M2). For each of these locations, we searched for age-stratified data on Hospitalizations and ICU admissions (see M3). We used these two sources of data to estimate the age-stratified rates of severe (ISR) and critical (ICR) SARS-CoV-2 infections for each of the locations. We used this data to fit Bayesian random-effects logistic regression models for each of the outcomes (see M4). We also searched for studies reporting age-stratified mortality for COVID-19 patients admitted to the hospital or to the ICU (see M5). We used this data to fit a Bayesian random-effects logistic regression model to obtain the age-specific hospital and ICU mortality for COVID-19. This regression was then combined with estimates of age-specific IFR extracted from the literature, to estimate the ISR and ICR through a ratio-of-ratios method (see M6). The regression of hospital and ICU mortality was also used to correct the hospital and ICU data described in M3 for out-of-hospital and out-of-ICU deaths (see M7). All data and code are available online (see M8).
M1) Data from seroprevalence studies
We used a curated list of seroprevalence studies released prior to 18 September 2020 that is presented in (Levin et al., 2020)–a systematic review and a meta-analysis. The list is restricted to developed countries; we refer the reader to (Levin et al., 2020) for an exhaustive list of other existing studies, and the criteria used for excluding seroprevalence studies from their final analysis.
We then searched for age-stratified hospitalization and ICU data to match the representative seroprevalence studies listed in Appendix Tables I.1 and I.3, and the convenience seroprevalence studies listed in Appendix Table I.2 from Levin et al. (2020). From the 12 representative seroprevalence studies included in those lists, we were able to find age-stratified hospitalization or ICU data for 8 locations (England; France; Ireland; Netherlands; Spain; Atlanta, USA; New York, USA; Geneva, Switzerland) and we failed to find such data for the 4 remaining locations (Italy; Portugal; Indiana, USA; Salt Lake City, USA). From the 3 convenience seroprevalence studies listed, we were able to find hospitalization or ICU data for all three locations (Ontario, Canada; Sweden; Belgium).
In addition to the seroprevalence studies used in (Levin et al., 2020), we included the seroprevalence study carried out in Iceland up to April 4 2020, which reports the results of a representative sample of the population (Gudbjartsson et al., 2020).
List of sources for the seroprevalence data of each location. The final date of the data collection period is shown in the center column.
Furthermore, in three cases we also changed the use of some seroprevalence studies with respect to Levin et al., (2020), to match them to the available hospitalization and ICU data. The first case is the seroprevalence study from France, which offers data by region. We were only able to find the age-stratified hospitalization data for the region of Île-de-France; therefore, we only used seroprevalence data from this region. The second case is the New York seroprevalence study, where we could only find hospitalization data for New York City but not for New York State; thus, we only used the seroprevalence for New York City. For Ontario, Canada, we could only find age-stratified hospitalization and ICU data up to July 31 2020, and so we used the seroprevalence report for this date, which is different from the report date used by (Levin et al., 2020). Table M1 summarizes the final list of seroprevalence studies included in our analysis.
Matching age-bins
The age-bins reported by each of the studies did not always match the age-bins in the corresponding hospitalization and ICU reports. Therefore, in some cases we extrapolated or interpolated the seroprevalence estimates obtained for a given age-bin into a different age-bin. For example, for New York City, seroprevalence was reported for the 18-34 years old age range, but hospitalization data was reported for the 18-44 year old age range. Therefore, to make use of this hospitalization data, we assumed that the proportion of seropositive individuals in the 18-44 years old range is the same as the proportion for the 18-34 year old age range. All such decisions were contrasted with other available data, and agreed upon by the two authors. Furthermore, these assumptions are all documented in the publicly available analysis code.
Correcting for test characteristics
The positive rate of a test depends on disease prevalence and on the test characteristics. Most of the seroprevalence estimates used were already corrected for test characteristics. For the results that were not corrected for test characteristics, we used the Gladen-Rogan formula (ROGAN & GLADEN, 1978) to adjust the estimates as follows:

M2) Countries with comprehensive tracing included in the analysis
Following (Levin et al., 2020), we also included in our analysis two countries (Republic of Korea and New Zealand) with comprehensive tracing programs where the number of infections detected through testing are thought to approximate the total number of infections accurately. As in the original Levin et al. study, we corrected the prevalence estimates for these countries using the age-specific ratio between the number of infections estimated through seroprevalence and the number of positive tests in Iceland (Gudbjartsson et al., 2020).
M3) Hospitalizations, ICU admissions, and deaths data
We obtained the age-stratified hospitalizations, ICU, and death data in relevant government websites of the locations, using google search, and looking for relevant region-wide studies. We selected the data reports that were closest to the end of the serosurvey date. The list of data sources and the end dates for their cumulative outcome numbers are shown in Table M2.
List of sources for the hospitalization, ICU, and death data for each location. The date up to which the cumulative numbers for these outcomes were reported are shown in the second column.
Also, as described above for the serology data, in some cases we interpolated or extrapolated some data for these disease outcomes, or we combined different data sources with incomplete data (e.g., age-distribution of an outcome from one source, with the total count of the outcome from another source) to obtain the data for these outcomes with the appropriate age bins. For example, for Belgium, we were only able to find the unstratified number of cumulative ICU admissions at the desired date of May 8th, 2020, but we were able to find the age distribution for cumulative ICU admissions up to June 14th, 2020. Therefore, we distributed the cumulative ICU admissions of May 8th across age strata, following the distribution from June 14th. As mentioned above, all these decisions were agreed upon by the authors, and they are thoroughly documented in the publicly available analysis code.
M4) Estimation of outcome probabilities with serology and outcome data
We fitted Bayesian logistic regression models to the serology and outcome data. We describe the model for severe SARS-CoV-2 outcome; the same model was fitted to severe, critical, and fatal disease outcomes.
Let {yla, xla } represent the number of severe SARS-Cov-2 infections (yla) experienced among xla individuals infected with SARS-CoV-2, at the location l (l = 1, …, L), for the age stratum a (a = 1, …, Al) of the lth location. The ISR for this location-stratum is defined as 
Bayesian likelihood
The probability of yla given θR,la and the number of infections (xla) is given by the Binomial likelihood  . Assuming conditional independence across locations and strata, and taking
  , and
, and  we have
Modeling the number of SARS-Cov-2 cases from seroprevalence data
The selected seroprevalence studies provide age-stratified estimates (and SE) of disease prevalence. Rather than assuming that prevalence was known with complete certainty, we used the reported point estimates and SE to specify a Beta prior for prevalence for each location. Specifically, we used the reported prevalence and its SE to estimate (through first and second moments matching) the shape parameters of the Beta distribution used for each location. Then, prevalence was modeled as θP,la ∼ Beta(α1,la, α2,la), where α1,la and α2,la are location-age-stratum specific shape parameters. Then, the number of cases was defined as xla = Nla × θP,la, where Nla is the size of the population at location l and age stratum a.
Modeling severity rates using random-effects logistic regression
Infection-severity rates were modeled using a logit of the form
Therefore,  where ηla = [μ + ul] + [β + bl] ×agela
Above, µ and β are the average intercept and slopes across locations, and uij and bij are location-specific random effects on the intercept and the slope, respectively, with prior distribution  . The shared intercept (µ) and regression coefficient (β) were assigned flat priors, and the standard deviations for the random effects, σuand σbwere assigned gamma priors with shape and rate parameters equal to 4.
For each age stratum a at location l, the value of agela used for fitting corresponded to the median age of the stratum. For age strata with an open upper bound (e.g. 70+ age), we used 90 years as the upper bound of the stratum.
The posterior distribution of the model described above does not have a closed form; therefore, we used Monte Carlo Markov Chain (MCMC) methods to generate samples from the posterior distribution for all the model unknowns  . We used 4 chains with 2500 iterations each. A script that implements the above model in Stan (Carpenter et al., 2017) is available in the online code.
Prediction of outcome rates
We used the samples of the posterior distribution to generate posterior samples for the infection severity rates for specific ages using the inverse-logit function:  , where s is an index for the sample from the posterior distribution. We then used these samples to estimate the posterior means and posterior credibility regions reported in Figures 1 and 2.
The predicted outcome rates obtained from the model fit are shown in Table S1, and the mean and credible intervals for the main model parameters are shown in Table S2.
M5) Hospital and ICU mortality data
Our robustness analysis was based on an indirect estimator (a ratio-of-ratios) of ISR and ICR. To derive this estimator, we used mortality data from hospitalized and ICU SARS-Cov-2 patients. We searched in the literature for reports on age-stratified mortality of patients admitted to the hospital or the ICU with a COVID-19 diagnosis. We also used the data sources from Table M2 that provided mortality numbers for hospitalized or ICU patients. We identified 8 ICU mortality reports and 8 mortality hospital reports with age-stratified data, which were either published studies in the literature or public reports from official organisms. The reports used are listed in Table M3.
List of sources for mortality among COVID-19 patients in the hospital or in critical care. The end date of each study is shown in the third column.
M6) Indirect estimation of ISR and ICR using IFR and hospital mortality data
To validate the estimates obtained with the data and methods described above, we used an alternative source of data and a different estimation method to obtain age-specific ISR and ICR. Specifically, we combined age-specific reports of IFRs from the literature with the hospital and ICU mortality data listed in Table M3 to obtain the ISR and ICR using a ratio-of-ratios method, as explained below.
Let IFRsa be the expected ratio between deaths and infections estimated in a study s (s=1, …, S) for age stratum a (a=1, …, As) and let SFRa be the expected ratio between deaths and severe COVID-19 cases for age stratum a (a=1, …, As). Then, we have that the estimated ISR for age stratum a estimated from study s is  . Thus, by estimating the values of SFR for different ages, we can use age-specific IFR values reported in the literature to obtain estimates of age-specific ISR.
To approximate the age-specific SFR, we fitted a Bayesian logistic regression to age-stratified hospital death for COVID-19 patients. Let {dla, hla} represent the number of deaths (dla) among hla individuals hospitalized with COVID-19 for the age stratum a (a=1, …, Al) in location l. The hospital mortality for this location-stratum is defined as 
To estimate θHM (age), we used Bayesian random-effects logistic regressions, like the one described in section M4, to the hospital death data. The only difference with the procedure in M4 is that, in this case, the numerators hla were known, and thus we directly used these fixed hla values (unlike the xla from M4, for which a distribution over possible values was obtained using seroprevalence estimates).
We use θHM (a) as our estimate of SFR a. These two quantities are equal if we assume that all deaths occur in the hospital (note that our definition of severe case, stated in the main text, is a case that results in either hospital admission or out-of-hospital death). As discussed in Supplementary S2 and shown in Figures S1, S2, out-of-hospital deaths make only a very small fraction of severe cases for all but the oldest age-strata. Also, we find that out-of-hospital deaths make up a minority of the deaths for all but the oldest ages (analysis not shown).
Then, to account for the uncertainty of the IFRsa estimates in our estimations, we fitted a Beta distribution to the mean and credible interval of each IFRsa through moment matching, to obtain IFR sa ∼ Beta(α1,sa, α2,sa) (for Brazeau et. al. (2020) we only used the point estimates since credible intervals on the mean estimates are not reported).
Finally, we estimated  by generating samples from the posterior distribution of each SFR a (obtained from the Bayesian logistic regression model) and from the Beta distribution fitted for each IFRsa. In total, we generated 50.000 samples of this ratio for each ISRsa.
The same procedure was applied to estimate the ICRsa, by fitting the model to ICU death data. The estimated hospital and ICU mortality rates obtained from these models are shown in Table S3, and the parameters obtained from fitting the model are shown in Table S4.
M7) Correction for out-of-hospital and out-of-ICU deaths
Some COVID-19 deaths occur outside of the ICU, or outside of the hospital. This happens when the patient prognosis is poor, such as in elderly and frail patients, and it may be accentuated when health systems are operating at high occupancy. This phenomenon is particularly notable in our data for some locations and ages, where the number of reported deaths is larger than the number of reported ICU admissions (in some cases by more than one order of magnitude).
Our definitions of severe and critical COVID-19 outcomes include these out-of-hospital and out-of-ICU deaths, besides hospitalizations and ICU admissions. Therefore, we obtained the number of severe cases by adding to hospitalizations the number of out-of-hospital deaths. Likewise, we obtained the number of critical cases by adding to the number of ICU patients the number of out-of-ICU deaths. For some locations, we could obtain data on the out-of-hospital and out-of-ICU deaths, but for other locations this data was absent, and so we estimated it using the death data.
Let yla be the cumulative number of hospitalizations for a location l and age stratum a, for which no out-of-hospital death data is available. Also, let  be the total number of deaths reported for this location and age stratum. First, we obtained the expected number of in-hospital-deaths,
  , by combining the number of hospitalizations with the expected hospital mortality for this age, θHM(a) (fitted as described in section M6),
  . Then, we obtain the expected number of out-of-hospital
  deaths by subtracting from the total number of deaths,
  (setting
  to 0 if the result is negative).
The same procedure is performed for the ICU data to obtain the number of critical cases.
See sections Supplementary S2 and Figures S1, S2 for an analysis showing the effect of this correction method on the data, and the robustness of the results to the removal of this correction.
M8) Data and code availability
All data and code used in this project are available at https://github.com/dherrera1911/estimate_covid_severity.git
Acknowledgements
We thank Elías Eyþórsson, Gideon Meyerowitz-Katz, and Nicholas Davies for useful discussions and comments on this work.
References


Subject Area
Reviews and Context
0
Comment
0
TRIP Peer Reviews
1
Community Reviews
0
Automated Services
3
Blogs/Media
Author Videos