
Abstract
BACKGROUND Risk factors for Parkinson’s disease (PD) can be more or less relevant to a population due to population-specific genetic architecture, local lifestyle habits, and environmental exposures. Therefore, it is essential to study PD at a local, regional, and continental scale in order to increase the knowledge on disease etiology.
OBJECTIVE We aimed to investigate the contribution of genetic and environmental factors to PD in a new Swedish case-control cohort.
METHODS PD patients (n=929) and matched population-based controls (n=935) from the southernmost county in Sweden were included in the cohort. Information on environmental exposures was obtained using questionnaires at inclusion. Genetic analyses included a genome-wide association study (GWAS), haplotype assessment, and a risk profile analysis using cumulative genetic risk scores.
RESULTS The cohort is a representative PD case-control cohort (64% men, mean age at diagnosis = 67 years, median Hoehn and Yahr score = 2.0), in which previously reported associations between PD and environmental factors, such as tobacco, could be confirmed. We describe the first GWAS of PD solely composed of PD patients from Sweden, and confirm associations to well-established risk alleles in SNCA. In addition, we identified a potential novel, population-specific PD risk variant in the PLPP4 locus (rs12771445) along with a risk haplotype in the region.
CONCLUSIONS This work provides an in-depth description of a new PD case-control cohort from southern Sweden in which we identified a potential novel PD risk locus, PLPP4. Replication studies are needed to determine whether the PLPP4 locus is associated with PD in Sweden, and on a global scale.
Introduction
Parkinson’s disease (PD) is a complex and progressive neurological disorder and has been reported to be the fastest growing neurological disorder worldwide in regard to prevalence, disability, and deaths (1, 2). Even after adjusting the data for age, the prevalence rates of PD increased by 22% up to 6.1 million individuals from 1990 to 2016. The currently available treatments only address symptoms of the disease, and the burden of PD is likely to continue to increase substantially if no disease-modifying therapeutic is developed.
PD can be categorized into two forms based on the contribution of genetics to disease risk: monogenic (or familial) PD and idiopathic (or multifactorial) PD. In monogenic PD, rare DNA variants with large effect sizes but varying penetrance cause the disease (3). Monogenic forms of PD have been reported to be caused by mutations in several genes including SNCA, LRRK2, VPS35, PARK2, PINK1 and DJ-1 (4-9). Although they contribute to a much smaller proportion of cases, these disease-causing variants have provided valuable insight into the molecular mechanisms underlying PD disease etiology and pathogenesis, such as the identification of mutations in SNCA. SNCA encodes for a-synuclein, and missense mutations as well as copy number variants (CNVs) of the gene have been identified to cause monogenic PD, whereas more common genetic variants have been reported to be associated with an increased risk of idiopathic PD (5). In idiopathic PD, variants with smaller effect sizes in combination with environmental exposures determine an individual’s risk. This form is far more common than monogenic PD and is estimated to account for more than 95% of all PD cases (10, 11). The latest large-scale genome-wide association study (GWAS) meta-analysis identified 90 risk loci associated with idiopathic PD in individuals of European ancestry (12). These variants are estimated to explain 16-36% of the heritable PD risk, indicating that many genetic risk factors for PD remain to be discovered (12). Additionally, two new risk loci have been reported to be associated with PD risk in the Asian population (13).
To address this unknown genetic component, increasing sample sizes in GWAS could pave the way for the discovery of additional risk variants and increase the proportion of explained heritability (14, 15). However, it has also been suggested that the “missing heritability” could be explained by the presence of gene-gene and gene-environment interactions (14). Non-genetic factors, such as environmental factors, have been reported to affect PD disease risk and progression, and are of great importance for further understanding the pathogenesis of the disease (10, 16, 17). Commonly reported environmental risk factors for PD include aging, smoking, and exposure to pesticides (10).
There is a strong population bias in genetic research of human diseases. For example, 78% of all GWAS as of 2018 used data from individuals of European ancestry, and ongoing initiatives are taken to study PD genetic risk in South American, African and Asian populations (18-20). In addition to the need for a widened scope of PD genetic research on a global level, there is also a need of narrowed, regional studies, since heterogeneity across cohorts from different countries or regions may mask genetic associations specific to sub-populations (21). Population-specific GWAS of PD from different European countries have both replicated many of the variants identified from GWAS meta-analyses and identified novel candidate variants associated with PD or PD age at onset (AAO) that appear to be specific for the investigated population, highlighting the importance of regional studies (22-24).
The Swedish population has not yet been represented in PD GWAS meta-analyses or population-specific GWAS. A PD GWAS performed on a mixed Scandinavian population with 1,345 PD patients and 1,225 controls from Norway and Sweden replicated 11 risk loci but did not identify any novel candidate variants (25). The Swedish population has been reported to be genetically similar to the nearby population of Norway (21, 26). However, there is a substantial genetic difference even within the Swedish population, particularly between the south and north of Sweden (21). These reports highlight the importance of analyzing subgroups within countries, and emphasize the importance of regional matching of cases and controls in GWAS (21, 27).
Here, we describe the characteristics of a well-defined, matched PD case-control cohort from southern Sweden and the direct causal effect of previously reported environmental factors affecting PD risk. We aimed to study the genetic basis of PD in southern Sweden by investigating novel putative candidate variants, and determine whether previously identified risk variants are associated with PD risk and age at diagnosis in the cohort. This study provides important insights into PD in the Swedish population and will contribute to the understanding of population-specific environmental and genetic risk in PD. By bringing insights on regional PD risk factors from a variety of populations together, important discoveries of the biological processes driving PD pathology and etiology can be uncovered, and lay ground for development of novel treatments.
Materials and Methods
Ethical consent
Ethical permission for the MultiPark’s biobank sample collection (MPBC) was approved by the regional ethics review board of Lund (2013/509). All participants recruited to MPBC gave informed written consent at study enrollment.
Patient and population-based control inclusion
Individuals primarily diagnosed with PD (International Classification of Disease, tenth revision (ICD-10-SE) code G20.9) at ten neurological clinics in nine different cities in the southernmost province of Sweden, Scania (in Swedish: Skåne), were assessed for eligibility (Supplementary figure S1). Inclusion criteria were a diagnosis of PD and the ability to visit one of the participating neurological clinics for sampling. In total, 2,119 PD patients were invited to participate between November 2014 and July 2017, whereof 1,011 were included in MPBC (inclusion rate 48.3%). For each PD patient, population-based controls matched by date of birth, sex, and residential area were randomly selected from the Swedish Population Register and invited to participate between March 2015 and April 2018. A total of 5,419 individuals were contacted whereof 1,001 (18.5%) consented to participate and completed the data collection. Exclusion criteria for the control group were a diagnosis of PD and the inability to visit a center for sampling. Out of the 1,001 completed controls, 953 were unique matchings to a PD patient, resulting in a matched control for 953 (94.3%) of the patients. All analyses were performed in a set of 929 PD patients and 935 controls passing all quality control steps unless stated otherwise. A flowchart detailing the study participant inclusion process to MPBC can be found in supplementary figure S2.
Sample and data collection, storage, and management
Blood samples from all participants were handled by the Clinical Chemistry Unit at the University Hospital in Skåne (SUS) and stored at -80°C within a central biobanking facility (Biobank Syd: BD47). For each study participant, whole blood was collected in EDTA-tubes (Becton Dickinson (BD) Vacutainer®, New Jersey, US) for DNA extraction. Additional samples were collected in PAXgene blood RNA tubes (QIAGEN®, Hilden, Germany), EDTA-tubes (BD Vacutainer®), sodium-heparin tubes (BD Vacutainer®, New Jersey, US) and a serum-separating tube (BD Vacutainer® SST™, New Jersey, US) to enable future studies of RNA and biomarkers in PD. When difficulties emerged during blood sample collection, EDTA-tubes for DNA extraction were prioritized. Serum and plasma samples were aliquoted prior to freezing and stored at -80°C in a 96-well format of 200 µl aliquots.
All participants filled in questionnaires covering basic demographic data, lifestyle habits, family history of PD, comorbid diseases, exposure to potential environmental risk factors, medications, health status, and perceived motor- and non-motor symptoms. Data from questionnaires was manually entered into REDCap, a web-based application for building and managing databases in research studies (28). Additional data for the PD disease rating tools Hoehn and Yahr (H&Y), Clinical Impression of Severity Index - Parkinson’s Disease (CISI-PD), and Parkinson’s Disease Questionnaire - 8 (PDQ-8) as well as information on age at PD diagnosis was retrieved from the Swedish Parkinson’s registry (29).
Statistical analyses of epidemiological data
Epidemiologic data was analyzed using the statistical software package R version 4.0.0 (30). Demographic characteristics of PD patients and controls were summarized as frequency and percentage for categorical variables. For continuous variables, mean and standard deviation (SD) were used for variables displaying a normal distribution whereas median and interquartile range was reported for variables not displaying normal distribution. The range for continuous variables was used to demonstrate the heterogeneity in the cohort. To indicate missing data per variable, the total number of study participants with complete answers was reported, and complete-case analyses were run. Body mass index (BMI) was calculated as weight (kg)/height (m)2. For quality-of-life assessment, EuroQol five-dimension - 3-level (EQ-5D-3L) was used which covers the five dimensions mobility, self-care, usual activities, pain/discomfort, and anxiety/depression. Time trade-off (TTO) and the visual analogue scale (VAS) index were calculated for all study participants using TTO and VAS scale value set for Sweden (31). In TTO valuation, individuals were asked to indicate how many years in full health that would be of equal value to 10 years in their current health state divided by 10. Full health hence corresponds to 10 years/10 = 1. In VAS valuation, respondents rated their overall health between 0 (worst imaginable health) and 100 (best imaginable health) (32).
PD risk factors
In order to test for associations between a potential risk factor (exposure variable) and PD status, unadjusted logistic regression analyses were used. To avoid confounding, multivariate logistic regression analyses were also performed, adjusting for potential confounders. Directed acyclic graphs (DAGs) were made for all exposures of interest that met the assumptions for logistic regression using the R package ’dagitty’ (Supplementary Figure S3) (33). Exposures of interest were selected based on meta-analysis literature reviews with PD as outcome (16, 17). Due to the cross-sectional case-control study design, we selected variables from the questionnaire related to past exposures in order to avoid reverse causation. DAGs were used in order to help identify confounding variables to adjust for in the multivariate analyses. Confounding pathways with the least amount of missing data were prioritized for adjustment, and individuals with missing data for any variable were removed in order to run complete-case analyses. From both the unadjusted and the adjusted regression analyses, odds ratios (OR), and 95% confidence intervals (CI) were estimated.
PD-associated traits
All evaluated variables were self-reported and retrieved from the questionnaire. We evaluated variables to describe habits, lifestyle, and PD symptoms in the cohort. The majority of these variables likely reflect reverse causation and, due to this assumption, DAGs were not used and logistic regression analyses were performed adjusting only for age and sex. We do acknowledge the risk of confounding factors in these analyses. However, the interest here was to perform observational analyses describing PD characteristics (the PD phenome) in the cohort. For each of the variables, only individuals with non-missing data were selected in order to run complete-case analyses. Due to multiple comparisons, a Bonferroni-corrected p-value threshold of 0.001 was used. ORs and 99.9% CI were estimated for all associations and plotted in forest plots. Due to either too few study participants reporting a certain diagnosis or a lack of a difference between the number of individuals between the patient group and control group groups, 35 comorbidities were not tested for association to PD.
DNA extraction and Genotyping
DNA extraction was done from whole blood samples at the regional biobank center BD47 and at LGC Biosearch Technologies (UK, GEN-9300-120). LGC Biosearch Technologies also performed genotyping and subsequent “Basic BioIT” with technical quality control (QC) and genotype clustering (Germany) where the no-call GenCall threshold was set to the standard score cutoff for Infinium data of 0.15. Matched case-control samples were genotyped using the Infinium Global Screening Array-24 v.2.0 with the Multi-Disease drop in panel v.2.0 (GSAMD-24v2.0) containing a total of 712,189 variants that were annotated to the Genome Reference Consortium Human Build 37 (GRCh37).
Genotype quality control and Imputation
QC analysis was performed in PLINK 1.9 (34, 35). Samples were excluded if the call rate was < 95%, if excess heterozygosity was detected (estimated by a F statistic > 0.15 or < -0.15), or if the genetic sex (determined from X-chromosome heterogeneity) differed from the sex reported in the epidemiolocal data. Principal component analysis (PCA) was used to identify and exclude ancestry outliers. For this, the genotype data was merged with the HapMap phase 3 data set (36), and samples were determined as having European ancestry if they clustered 6 standard deviations (SD +/-) around the combined population mean of the two European ancestry populations: Utah residents with Northern and Western European ancestry (CEU) and Toscani in Italia (TSI) (Supplementary Figure S4). Samples from closely related individuals, defined as sharing more than 12.5% of alleles, were investigated and excluded from further analyses. Following sample exclusion, 929 PD patients and 935 controls remained and were included in further analyses unless stated otherwise. QC was also performed on a variant level whereby SNPs with a missingness rate > 5%, Hardy-Weinberg equilibrium p-value < 1E-4, or minor allele frequency (MAF) < 1% were excluded. SNPs with differences in genotyping rate for cases and controls and genotypes missing by haplotype were also excluded for p-value < 1E-4. The number of SNPs passing QC was 505,005 with a total genotyping rate of 99.9%. Genomic imputation was performed on the Michigan Imputation Server (37) using the Minimac4 imputation software, Eagle v2.4 for phasing (38), and the Haplotype Reference Consortium (HRC) r1.1 2016 European population as the reference population (http://www.haplotype-reference-consortium.org/) (39). Post-imputation QC was performed, and variants with a MAF < 5% and/or poor imputation quality, set as Rsq < 0.3, were excluded. The number of imputed variants after filtering was 5,445,841.
Power calculation for GWAS analyses
GWAS power calculation was performed using the online Genetic Association Study (GAS) Power Calculator (http://csg.sph.umich.edu/abecasis/gas_power_calculator/). In order to reach 80% power at a GWAS-significance level (alpha = 5E-08) with a disease prevalence in the general Swedish population of 0.2%, an allele frequency of > 20% and an odds ratio of > 1.7 would be needed. The majority of the 90 identified risk loci for PD from the largest PD GWAS meta-analysis to date have an odds ratio in the range of 0.8 to 1.2 (12).
Genome wide association study (GWAS) vs PD risk and age at diagnosis (AAD)
A GWAS for PD risk was performed using the filtered imputed variants in a logistic regression model adjusted for sex, age (at study inclusion), and the first 5 principal components (PCs) as covariates to account for population substructure. The number of PCs used in the analyses was determined by a scree plot (Supplementary figure S5). Data on age at diagnosis (AAD) was retrieved from the Swedish Parkinson Registry and was available for 792 of the 929 PD patients (85.3%). A linear regression model was used to investigate the impact of genetic variation on the AAD for the PD cases and was adjusted for sex and the first 5 PCs. Summary statistics for the variants in both analyses was generated using the rare variant test software RVTESTS (version 2.1.0) (40). Quantile-quantile (QQ)-plots and Manhattan plots for both analyses were generated in R, version 4.0.0 (30). Subsequently, regions containing variants of potential interest were visualized using summary statistics data in the LocalZoom tool (https://my.locuszoom.org). Region-specific association plots were created using a flanking size of 100 kb from the gene of interest.
Haplotype analysis of PLPP4
Available genotyped variants in the PLPP4 region with a window of ±100 kb upstream or downstream (PLPP4 coordinates on genome assembly GRCh37; chr10:122216466-122349376, UCSC) was extracted and annotated using ANNOVAR (41). PLINK v1.9 was used to determine variant allele frequencies and to run association analyses on the PLPP4 variants and PD risk. The regression analyses were primarily adjusted for age, sex, and PC1-5, and additionally adjusted for tobacco use. The adjustment for tobacco use was done because of a report of PLPP4 being associated with smoking cessation (42), and multiple reports of smoking being associated with PD status. To assimilate the effect of other nicotine products, such as snus (moist tobacco, commonly consumed in Sweden), the variable “Tobacco” was used instead of smoking. A Bonferroni-corrected p-value threshold of 5.4E-04 was used in the analyses (alpha=0.05/92). Haplotype blocks in the PLPP4 region were estimated in PLINK v1.9 using the default parameters wherein pairwise LD was calculated for variants within 500 kb (34, 35). PLINK v1.9 estimates haplotype blocks following the default procedure in Haploview that defines pairs of variants to be in “strong LD” if the 95% CI bounds for the normalized measure of allelic association (D’) are > 0.70 for the lower bound and > 0.98 for the upper bound, and a block is created if 95% of informative comparisons are “strong LD” (43, 44). Haplotype frequency was calculated for PD patients and controls separately, and association between haplotype blocks in PLPP4 and PD status was analyzed with haplo.stats in R using logistic regressions with identical adjustments as for the variant analyses. Only haplotypes with a carrier frequency of >1% were included in the analysis. A Bonferroni corrected threshold for statistical significance of p=0.05/45=0.001 was set. The results were visualized using LocusZoom (https://my.locuszoom.org) and Haploview v4.1 (45).
Analysis of the joint effect of variants in PLPP4 on PD risk
The contribution of rare variants on disease risk was examined by the joint effect of multiple variants in the PLPP4 region. We separately analyzed genotyped variants and imputed variants with a MAF < 5% and an imputation quality score of Rsq > 0.8. The sequence kernel association test (SKAT) was used since only 2.6% of the base pairs in PLPP4 are in coding regions and the SKAT is powerful when a large fraction of the variants in a region are noncausal or if the effects of causal variants are in different directions. The test aggregates associations between variants and phenotype and allows for variant interactions (46). The analyses were performed in RVTESTS (version 2.1.0) (40) using default parameters and adjusting for age at study inclusion, sex and the first 5 PCs. The test was performed both for all available variants as well as in only coding variants with two different maximum MAF thresholds of < 1% and <5 %. To adjust for multiple comparisons, a Bonferroni corrected p-value threshold was applied for all analyses.
Risk profile analysis
A risk profile analysis for PD and AAD was performed using the imputed data that passed QC. A cumulative genetic risk score (GRS) was calculated in PLINK v1.9 using publicly available effect estimates (beta coefficients) from 90 SNPs that have been associated with PD in the largest published meta-analysis of PD GWAS to date (12). For each of the 90 SNPs, the allele dosage was multiplied by the published beta coefficient, giving a greater weight to alleles with higher risk estimates. Risk allele dosage was then summed across all 90 variants to generate a GRS for each study participant. Subsequently, the GRSs were standardized to Z-scores using the control group as the reference group for PD status and the whole sample patient group for the AAD analyses. This standardization was done to simplify the interpretation of the GRS, wherein a Z score of 1 would be equivalent to one SD increase in the GRS from the reference group GRS mean. The study participants were divided into quartiles based on their Z-standardized GRS, and logistic regression analysis was performed to investigate associations and estimate the OR between PD status and quartile group. Covariates in the regression model were selected based on a previously published PD classification model where the GRS, PD family history, age, sex, and total score from the University of Pennsylvania Smell Identification Test (UPSIT) were used (47). Our cohort did not have information regarding UPSIT, therefore adjustment was only performed using PD family history (yes/no), age at inclusion, and sex with additional adjustment for PCs 1-5. For the risk profile analysis for AAD, a linear regression model was used and adjusted for sex, PD family history, and PC1-5. Plots for the odds ratio of PD status per risk quartile of Z-standardized GRSs and for the association between the Z-standardized GRS and AAD were generated in R, version 4.0.0 (30).
Runs of homozygosity
Autosomal genotyped SNPs were pruned based on linkage disequilibrium (LD) values using a window size of 50 SNPs, shifting the window 5 SNPs at each step and removing one variant of a pair of SNPs if LD was greater than 0.5 (defined as r^2 = 0.5) to avoid confounding by large blocks of highly correlated SNPs. Runs of homozygosity (ROH) using the LD pruned data were then identified using the default values suggested in PLINK with a scanning window of 50 SNPs containing maximally 1 heterozygous SNP or 5 missing SNPs. For a SNP to be eligible for inclusion in a ROH, the hit rate of all scanning windows containing that SNP had to be over 5%. We further defined a ROH as having a minimum length of 1 Mb continuous homozygous calls per individual, containing at least 50 SNPs, 1 SNP per 50 kb, and, at most, 1 heterozygous genotype. We decided to perform the analyses using a minimum length of the ROHs of 1 Mb up to 10 Mb since it has been observed that ROHs at a length of 1-2 Mb most likely are identical by state (IBS) and not identical by descent (IBD). This means that the SNPs in the region are homozygous by chance and have not originated from the same ancestor as for SNP regions that are IBD (48). If the interval between 2 SNPs in a segment was more than 1 Mb, the segments were split in two. Both the LD pruning and the ROH analyses were done using PLINK v1.9 (34, 35). The genotype data had undergone similar QC as previously described. However, no MAF threshold was used, and cryptically related individuals (13 patients and 10 controls) were kept in order to be able to identify over-represented sharing of rare recessive regions among cases, making the total number of individuals in the analyses 1,887. Differences in ROH between cases and controls were evaluated by investigating the number of ROH spread across the genome, the total length of these segments (total Mb distance spread), and the average size per segment using logistic regressions. We further used a gene-based approach to find genomic regions that were differentially overlapped by segments of ROH in PD patients and controls in the cohort and to determine whether segments of homozygosity were enriched among PD patients. Genomic coordinates on the human genome GRCh37 for 26,292 genes were downloaded from the PLINK resources website (https://www.cog-genomics.org/plink/1.9/resources). The two-proportion z-test was used to test the null hypothesis that the proportions in the group of PD patients and the control group were the same. P-values were multiple-test corrected based on the number of genes enriched among the PD patients. Since increased levels of genomic homozygosity have been seen among PD cases with early disease onset (≤50 years) as compared to controls (48), we also performed the same analyses in a subset of PD patients with an AAD ≤50 years or with a first-relative with PD (n=147) and controls (n=945).
Code for all analyses will be available at https://github.com/KajBro/MPBC, GWAS summary statistics will be available online.
Results
Analyzing large case-control cohorts has paved the way for the discovery of genetic risk variants for PD (12). Nevertheless, heterogeneity across cohorts from different countries or even regions within countries may mask genetic associations specific to sub-populations (22, 23). We investigated environmental factors and the genetic architecture of PD in a PD case-control cohort selectively recruited from the southernmost region of Sweden.
Cohort characteristics
Demographics and characteristics of the entire study cohort are summarized in Table 1. Male predominance was observed in the cohort with a sex ratio of 2:1. Matching was successful for year of birth and sex, with an identical average birth year, 1944, for cases and controls and with 36% of women composing the two groups. A one-year difference for the average age at inclusion was observed for the patients (71 years) and controls (72 years) due to control recruitment occurring after patient recruitment. Swedish ancestry (defined as self-reporting that both parents were born in Sweden) was similar in patients (87.9%) and controls (86.1%). Similar distributions for highest completed education and marital status were also observed in patients and controls. According to self-reported information on health status using the EQ-5D-3L instrument (31), patients had an index of 0.8 on the TTO scale compared to 0.9 for the controls. The patients also rated their own overall health lower than the controls on the VAS index scale with an index of 68.9 (±16.8) vs 82.0 (±9.7) for the controls (Table 1). As a reference, the general Swedish population has an estimated mean TTO index of 0.9 and a VAS index of 79.5 (31).
We further looked into the health status and age at diagnosis among male and female PD patients using data from the Swedish Parkinson registry (Table 2). Median age at diagnosis was the same for both sexes (67.0 years), with a wide range of ages in both sexes (men 29.0-84.0 years, women 35.0-89.0 years). The median time since diagnosis at inclusion was 4.0 years for both sexes and varied from diagnosis the same year as inclusion to diagnosis 36.0 years for men and 33.0 years for women prior to inclusion. Health status at the time of inclusion was evaluated using the H&Y scale, CISI-PD, and PDQ-8. Both sexes had a median of 2.0 on the H&Y, corresponding to bilateral involvement without impairment of balance. Similar median total score values of 5.0 for both sexes were reported on the CISI-PD scale, which ranges from 0 to 24. Women had a slightly higher median PDQ-8 total score (7.0) compared to men (6.0) where the total maximum value was 32.
PD risk factors
In order to evaluate previously confirmed risk factors for PD in a regional, Swedish context, we investigated variables wherein the exposure could have occurred prior to PD diagnosis (Figure 1, Supplementary Table S1). The analyses were adjusted for confounders determined using DAGs (Supplementary Figure S3). A family history of PD was overrepresented among the PD patients, with 20% having at least one relative diagnosed with PD compared to 11% among the controls; having a relative diagnosed with PD doubled the risk of having PD (adjusted OR = 2.00, 95% CI 1.51 - 2.67). We confirmed an association between pesticide exposure and PD with an adjusted OR of 2.26 (95% CI 1.39 - 3.72). A significant association was also seen between PD and a history of head trauma (OR = 1.30, 95% CI 1.08 - 1.58). However, no statistically significant association between loss of consciousness and PD was observed among the study participants who reported a history of head trauma. A slightly higher OR of 1.05 (95% CI 1.01 - 1.09) was seen for having a higher BMI at the age of 20 years, indicating that a one unit increase in BMI increased the risk of having PD by 5%. We observed an inverse association between having ever smoked and PD, but the association was not statistically significant after adjustment for confounders (ever- vs never-smoking OR = 0.82, 95% CI 0.67 - 1.01). A statistically significant inverse association between the Swedish moist tobacco (snus) and PD was observed also after adjusting for confounders (OR = 0.53, 95% CI 0.38 - 0.73). We further investigated the combined effect of tobacco products on PD where a statistically significant inverse association was observed (adjusted OR = 0.72, 95% CI 0.59 - 0.88). Moreover, a trend of lower OR for PD with increasing amount of coffee drinking at the age of < 41 years was observed, where drinking > 5 cups of coffee per day was inversely associated with PD at an OR of 0.52 (95% CI 0.31 - 0.86) after adjusting for confounders.

Showing the adjusted OR and 95% CI of environmental factors with exposure occurring prior to PD diagnosis. Number of individuals in each analysis is found in supplementary table S1.
PD associated traits
In 2019, Heilbron et al. described traits associated with PD in a broadly phenotyped cohort of European ancestry in order to describe the “PD phenome” (49). In order to describe the PD phenome in the southern Swedish population, we investigated associations between PD and variables in the MPBC questionnaires. The phenotypes were divided into the categories exposures/lifestyle and symptoms (Figure 2, supplementary table 2; Figure 3, supplementary table 3). We observed a trend of decreased coffee consumption among the patients and lower OR of PD with increasing coffee consumption between 41 - 64 years of age (≥ 5 cups/day vs nothing: OR = 0.35, 99.9% CI 0.14 - 0.84) and > 64 years of age (≥ 5 cups/day vs nothing: OR = 0.29, 99.9% CI 0.09 - 0.86) (Figure 2). An inverse association was also observed for alcohol consumption and physical activity. The patients consumed less alcohol and engaged in less physical activity both in regard to level of physical activity at leisure time (regular activity level vs nothing OR = 0.26, 99.9% CI 0.14 - 0.49) and hours per week (≥ 5 hours/week vs nothing, OR = 0.21, 99.9% CI 0.09 - 0.45) compared to age- and sex-matched controls. We did not observe any significant association between PD and peak BMI (OR = 1.01. 99.9% CI 0.97 - 1.04) or for BMI at inclusion (OR = 0.99, 99.9% CI 0.95 - 1.02). Further, we looked at comorbidities and their association with PD and found statistically significant inverse associations between PD and a diagnosis of hyperlipidemia (OR = 0.51, 99.9% CI 0.34 - 0.76), hypertension (OR = 0.57, 99.9% CI 0.41 - 0.79), and osteoarthritis (OR = 0.66, 99.9% CI 0.46 - 0.95). A significant association with PD was observed for a diagnosis of depression (OR = 1.89, 99.9% CI 1.13 - 3.23) and for bowel problems, where bowel problems (defined as having constipation or diarrhea that required treatment on a regular basis) almost quadrupled the odds of having PD (OR = 3.93, 99.9% CI 2.06 - 8.07). Use of ibuprofen has been reported to be inversely associated with PD in a dose-dependent matter (50), and we observed an OR of 0.53 (99.9% CI 0.34 - 0.81) for the use of ibuprofen < 2 times/week compared to never. However, no dose-dependent association was observed, and the association was lost when ibuprofen was used ≥2 times/week. No associations were observed for the use of other nonsteroidal anti-inflammatory drugs (NSAIDs), such as diclofenac or naproxen (data not shown). As expected, PD symptoms were more common in the patient group than the control group (Figure 3, supplementary table 3). There was a dominance of motor symptoms in the patient group and the most prominent self-reported symptom was hypokinesia/bradykinesia (OR = 133, 99.9% CI 62.16 - 345.58). The non-motor symptoms with the highest estimated OR of having PD in this cohort were delusions (OR = 12.12, 99.9% CI 3.30 - 88.04), drooling (OR = 16.88, 99.9% CI 9.14 - 34.53), and hallucinations (OR = 18.94, 99.9%, CI 7.32 - 68.74).

The plot shows adjusted OR and 99.9% CI between lifestyle variables and PD. Number of individuals in each analysis is found in supplementary table S2.

The plot shows the OR and 99.9% CI between the associations of self-reported symptoms and PD. Number of individuals in each analysis is found in supplementary table S3.
GWAS of PD risk identified a novel candidate PD-risk variant in the PLPP4 locus
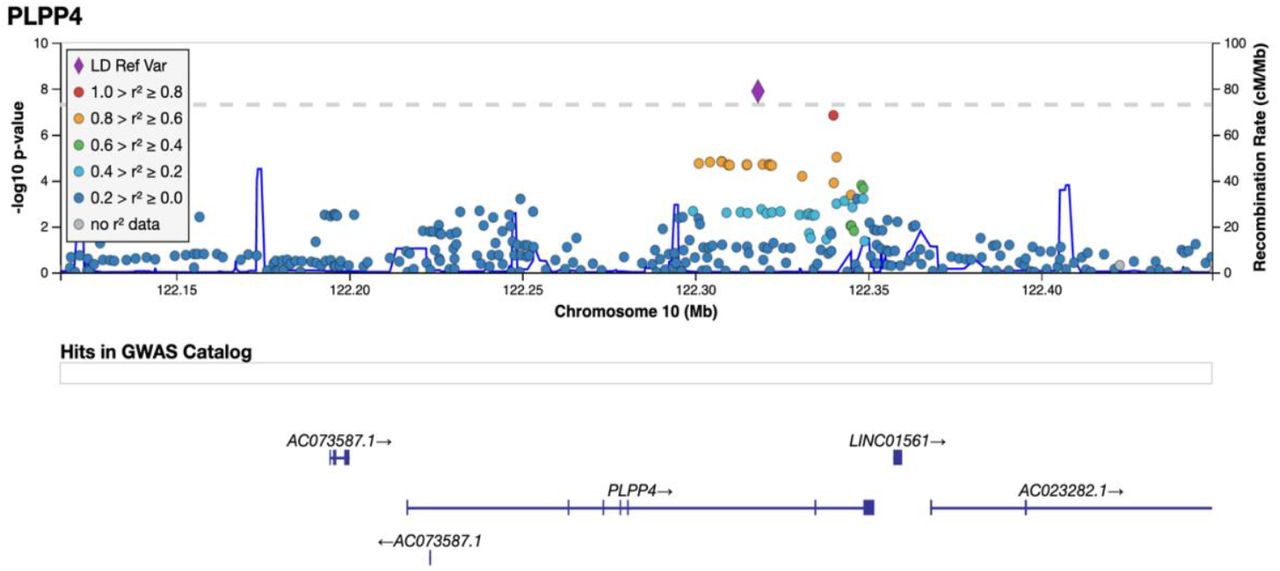
The variant rs356182 in SNCA was reported in the latest GWAS meta-analysis as one of the 90 risk loci associated with PD in a cohort of European ancestry (12). In our GWA analysis for PD risk, this and another three variants in the SNCA locus were observed at low p-values (rs356182, beta = -0.38, SE = 0.07, p = 5.64E-08; rs356203, beta = -0.36, SE = 0.07, p = 1.27E- 07; rs356220, beta = 0.36, SE = 0.07, p = 1.39E-07; rs356219, beta = -0.36, SE = 0.07, p = 2.32E-07), but none reached genome-wide significance (Table S4). In addition to the SNCA variants, we found associations for 23 of the 90 previously reported PD risk loci in this Swedish cohort at an uncorrected p-value of 0.05 (supplementary Table S5). Results from PCA showing the population structure as compared to the HapMap3 reference populations, revealed that this Swedish cohort cluster near the other European population but the centers of the clusters differ slightly, indicating differences in population structures that could result in population-specific risk alleles (Supplementary Figure S6). The GWA analysis also revealed a novel genome-wide significant association signal in the PLPP4 locus, rs12771445 (10:122318147, beta = -0.44, SE = 0.07, p = 1.30E-08), as being associated with PD risk in this Swedish cohort (Figure 4, Table S4). This association has, to our knowledge, not been reported in any other cohort (Table S4) (12). The significant variant was an intron variant in the gene Phospholipid Phosphatase 4 (PLPP4 or PPAPDC1A) and was imputed with a Rsq of 0.99 and a minor allele frequency (MAF) of 0.31 (Table S4). The MAF is similar to the value observed in the Swedish reference population, Swegen, of 0.32 (51). The estimated MAF was 0.27 in the patient group and 0.36 in the control group, indicating a potential protective effect of the minor allele (T) with an OR for PD of 0.64 for (T) carriers. Studies of larger cohorts from Sweden are needed to investigate if the association can be replicated and is specific to the Swedish PD population. To further display the association signals relative to genomic position and local LD, locus zoom plots for PLPP4 rs12771445 and SNCA rs356182 were produced (Figure 5 and supplementary Figure S10). Variants in SNCA have been reported to also be associated with PD AAO (52). We performed a GWA for the related variable AAD of PD in the cohort. However, we did not detect any genome-wide statistically significant associations and could not replicate previous reported variants associated with PD age at onset at low p-values, likely due to the smaller sample size (792 vs 28,568) (52), and limited statistical power (supplementary figure S11 and S12).

A total of 5,445,841 SNPs (MAF > 5%) were tested for 929 PD cases vs 935 controls. The y-axis represents the negative log (two-sided p-values) for association of variants with PD and the x-axis represent the genomic position on genome build GRCh37. The horizontal dashed line indicates the genome-wide significance level (p = 5E-08).

Imputed and genotyped variants passing QC in the PLPP4 gene +/- 100 kb (10:122116466-122449376) mapped to genome build GRCh37. The only coding gene in the region is PLPP4, other include pseudogenes (AC073587.1) and long non-coding RNA (LINC01561, AC023282.1, WDR11-AS1). The variant with lowest p-value (index) is indicated as a purple diamond. Marker colors indicate the strength of LD as r^2 between the index variant and other variants in the 1000 Genomes EUR population.
In order to estimate the accuracy of our findings, we performed imputation using the beta-version of the TOPMed Imputation Reference panel with over 97,000 sequenced human genomes (53). Using the same post-imputation QC, 6,214,098 variants were generated and analyzed in a GWA for PD risk (Supplementary Figure S8 and S9). Two variants passed genome-wide significance, rs12772937 (chr10:122318146, beta = -0.40, SE = 0.07, p = 2.48E-08) and our previously identified rs12771445 (10:122318147, beta = -0.40, SE = 0.07, p = 2.48E-08). Because the TOPMed panel was still in the beta stage as of our analysis, we continued using the data imputed with the HRC version r1.1 2016 panel.
Haplotype analysis of PLPP4
Because of the identification of a novel genome-wide signal (rs12771445) associated with PD status in this cohort, we further looked at genotyped variants in the nearest gene to the variant, PLPP4 ± 100 kb upstream or downstream. We identified 92 genotyped variants passing QC in the region, where 32 were in PLPP4, all intron variants. The median GenCall scores of these variants for all individuals in the genotyping was 0.87 (IQR: 0.83 – 0.91) (supplementary figure S13). A statistically significant association with PD status was observed for two variants at a Bonferroni-corrected p-value threshold of 5.0E-04: rs77989396 (p=2.64E-04, OR= 0.47) and rs74466257 (p=3.29E-04, OR=0.52), also after adjusting for sex, age, PC1-PC5, and tobacco (Supplementary table S6). We identified a total of 45 different haplotypes in 12 different blocks (H1-H12) in the region (Table 3). Statistically significant association with PD was observed for a haplotype in one block (H6) at a corrected p-value (α=0.001), both before and after adjustment. The haplotype block spanned over 41.9 kB (chr10:122302038-122343950) and consisted of five genetic variants and six different haplotypes. The rs978854(G)- rs7910507(G)-rs10886711(G)-rs11199417(G)-rs10886717(A) haplotype was statistically significantly inversely associated with PD at an OR of 0.69 (95% CI 0.59-0.82, p=2.54E-05) and with a MAF=0.24 for the patients and 0.30 for the controls.
Analysis of the joint effect of variants in PLPP4 on PD risk
We further evaluated the joint effect of more rare variants (MAF < 5%) in PLPP4 on PD risk using both genotyped and imputed data. No coding variants in the gene were identified in the genotyped data and only one was identified in the imputed data (Table 5). When focusing on all variants, an association in the genotyped data at a MAF threshold of <5% was observed (p=0.002), passing Bonferroni correction (p-value threshold = 0.05/16 = 0.003). A trend of a potential joint effect of variants with a MAF < 5% was still observed in the imputed data (p=0.005). However, it did not reach multiple testing corrections (p-value threshold = 0.05/628 = 7.96E-05). Only one variant with a MAF < 1% was present in the genotyped data and no statistically significant association was observed for variants with a MAF < 1% in either the genotyped or the imputed data.
PD risk profile analysis
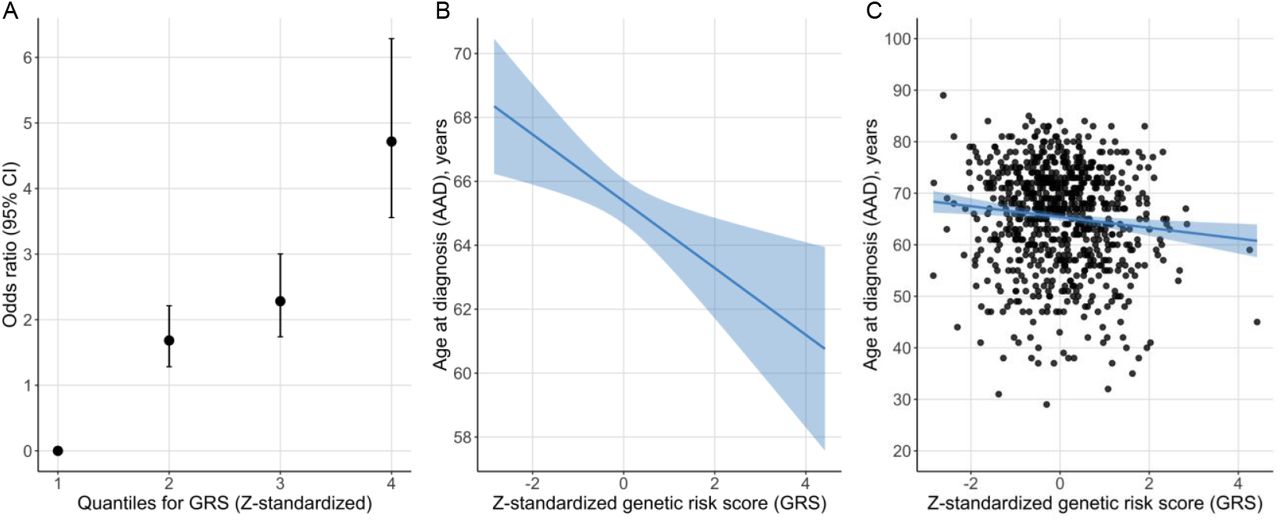
The PD risk profile analysis showed that the Z-standardized GRS was associated with PD status also in this Swedish cohort (12). For each SD increase from the reference mean value, the OR increased by 1.8 (beta = 0.59, SE = 0.05, p < 2.22E-16) (Figure 6). Study participants in the highest GRS quartile were estimated to be 4.7 times more likely to have PD compared to the participants in the lowest quartile using an adjusted model (Figure 6). There was also an inverse association between the GRS and AAD, where one SD increase in the Z-standardized GRS was associated with approximately one-year earlier age at diagnosis (beta = -0.97, SE = 0.36, p=0.007, adjusted r2 = 0.011).

A: Odds ratio of PD status per risk quartile of the Z-standardized GRS. B: Regression line for the association between the Z-standardized GRS and AAD. The line represents the parameter estimate and the shading the 95% confidence interval of the regression model. The model was adjusted for sex, PD family history, and PC1-PC5. C: AAD and Z-standardized GRS for each study participant with the regression model in plot B fitted to the plot.

Genotyped variants in the PLPP4 gene +/- 100 kb (10:122116466-122449376) were mapped to genome build GRCh37. The LocusZoom indicates the association results of PD risk from the multivariate logistic regression model (adjusted for age, sex, nicotine and PC1-5) where the variant with the lowest p-value is indicated as a purple diamond (index). Marker colors indicate the strength of LD as r^2 between the index variant and other variants in the 1000 Genomes EUR population. An LD heatmap showing the LD (D’) between the genotyped variants in the region in the MPBC cohort is displayed below the LocusZoom. The dashed line represents the adjusted p-value threshold (p=5.4E-04). Note that the location of variants in the LD heatmap can be shifted relative to the regional display in the LocusZoom.
Runs of homozygosity
Identifying regions of extended homozygosity can help identify rare recessive risk variants contributing to disease, and increased level of genomic homozygosity has been observed in PD patients with an early PD diagnosis compared to controls (48). It has also been observed that PD patients exhibit overall excess homozygosity in genes/loci previously associated with PD (22). We therefore investigated ROH in the entire study cohort as well as in a subset of PD patients with an early PD diagnosis (AAD < 50 years) and/or with a first-degree relative with PD (N=147). For the entire cohort, 47,954 ROH segments were identified ranging from 1 Mb to 147.7 Mb. However, only two of the ROH segments were larger than 56 Mb, and 90.4% of segments were < 2 Mb in length (Supplementary figure S14). No statistically significant association with PD was seen at a segment size threshold of 1 Mb for the total distance spanned by the segments, for average segment size, nor for the number of ROH segments spread across the genome (Table S7A). When using a length threshold > 2 Mb to prevent ROHs from being identified by chance, the number of ROH segments decreased substantially to 4,580. The fraction of individuals with at least one ROH > 2Mb was 87.2% for PD patients and 89.3% for controls. Still, no statistically significant association was observed for the total distance spanned by the segments or for the average segment size. However, a significant association was observed for the number of ROH segments > 2Mb as the mean number per individual was slightly higher for PD patients (n=2.9) than for controls (n=2.9, p=0.02, Table S7). We further performed mapping of homozygosity regions and potential enriched segments of homozygosity among PD patients were found at 2,267 genes/loci, whereof only 43 spanned over 1Mb in size and one passed nominal significance (segment coordinates chr14:19468496-20524255, p=0.01). However, this significance did not remain following multiple test corrections. We also looked into ROHs in known mendelian PD genes, the nearest gene and the quantitative trait loci (QTL) nominated gene for the 90 risk loci from the latest GWAS-meta-analysis (12) as well as the nearest gene of our GWAS top-hit, PLPP4. Small (< 1 Mb in size) enriched segments of homozygosity among PD patients were observed at a total of 12 genes/loci. However, none were significant following multiple test corrections.
For patients with early PD diagnosis and/or first-degree relative(s) with PD, 27,428 ROH segments were identified. No statistically significant association was observed for ROH segments at any length threshold for the total distance spanned by the ROH segments, for the average segment size, nor for the number of ROH segments (Table S7B). Enriched segments of homozygosity among PD patients were found at a total of 1,134 genes/loci which of 10 small segments (< 1 Mb) were in PD associated genes. Only 14 of the enriched segments spanned over 1 Mb in size, and none passed multiple test corrections.
Discussion
We describe the characteristics and genetic basis of PD in a well-defined, matched case-control cohort from southern Sweden in which multiple previously reported environmental and genetic risk factors were confirmed to affect PD risk. Interestingly, we also identified a novel genetic risk locus associated with PD risk both in GWA and haplotype analyses. This study is, to our knowledge, the largest case-control study of PD performed in a Swedish cohort and is unique with regard to the well-defined recruitment of study participants from a specific region in southern Sweden.
Our analyses showed that the MPBC cohort is representative and demonstrates similar characteristics compared to other PD cohorts. On average, the patients were diagnosed with PD four years prior to study inclusion and the relatively short disease duration was reflected in the PD rating scales with an average score of 2 on the H&Y scale and low scores on the CISI-PD and PDQ-8 scales. This can be explained by the study inclusion design where patients with advanced PD, who could not visit a neurology clinic, were not invited to participate.
To prevent reverse causation when evaluating risk factors for PD in a case-control design, we investigated self-reported variables for exposures that may have occurred prior to PD diagnosis. To determine potential confounders for adjustment and reproducibility, DAGs were drawn up for all variables of interest (supplementary figure S3). An association between pesticide exposure and PD was observed as the individuals exposed to pesticides had more than double the risk of having PD. The number of participants exposed to pesticides was overrepresented among those who had reported farming and well water consumption. However, no statistically significant association was observed between farming or well water and PD, indicating a direct effect of pesticides on PD risk. Several pesticides have been reported to be linked to PD, including paraquat, glyphosate, and pyrethroids (54). Paraquat was banned in Sweden in 1983 while glyphosates and pyrethroids are still used (55). However, further actions need to be taken to investigate which chemicals stand behind the observed association.
We found that having a relative with a PD diagnosis doubled the risk of having PD. Among the 20% of patients that reported a positive family history, 8.9% had a first-degree relative with PD. Other studies report similar numbers with 15-25% of PD patients having a positive family history and 10-25% having a first-degree relative with PD (56). It has been suggested that the risk of PD increases shortly after a traumatic brain injury (TBI) and that a history of concussions results in a higher risk of PD (57, 58). We also observed a statistically significant association between a history of head trauma and PD in the Swedish cohort, but whether the association is causative or a consequence of prodromal PD remains to be determined. Among participants reporting head trauma, no association was observed between PD and loss of consciousness following the head trauma.
The inverse association between smoking and PD is well-known and has been reported in numerous studies (17). This was replicated in our cohort when looking at the direct effect of smoking on PD, but no longer statistically significant after adjustment for confounders. Interestingly, a strong inverse association between the Swedish moist tobacco, snus, and PD was observed also after adjustment. This observation reduces the number of candidate compounds underlying the inverse association between smoking and PD (59, 60). It has previously been reported that non-smoking, snus-using Swedish men had 60% lower risk of PD compared to men who had never used snus (60). Snus is more frequently used than smoking tobacco among men in Sweden, where18% use snus and 7% smoke on a daily basis. Among Swedish women, 5% use snus and 7% smoke on a daily basis (61). The amount of nicotine that reaches the blood when using snus is equivalent to that of cigarette smoking (59). We investigated the total effect of smoking and snus on PD risk and found a statistically significant inverse association to PD also for the combined variable “Tobacco”. These findings support previous reports and suggest either that components in tobacco leaves influence biological processes underlying PD, or that there is a reverse causation between tobacco use and PD. Nicotine has been suggested to have neuroprotective properties but it also stimulates dopamine release from nigrostriatal dopaminergic terminals. Hence, the lower use of tobacco products could be a consequence of a reduced nicotine-evoked dopamine release among prodromal PD patients (62).
In order to describe the phenotype (or “phenome”) of PD patients in Sweden, we investigated traits associated with PD in the cohort. We observed expected results with inverse associations between PD and coffee consumption, alcohol consumption, and physical activity in a dose-dependent manner. Surprisingly, we observed an association between BMI at inclusion and PD. Weight loss has frequently been observed in PD patients as a consequence of reduced energy intake due to anosmia and gastrointestinal dysfunction in combination with an increased energy expenditure due to tremor and levodopa-induced dyskinesia (63). It has been estimated that PD patients lose 3.5 kg every eight years post-diagnosis and that levodopa-induced dyskinesia commonly develops after 3-5 years (63, 64). The patients in this study were, on average, enrolled four years post-diagnosis and approximately 92% reported using levodopa therapy.
The phenotypes hypertension, hyperlipidemia, and osteoarthritis were also inversely associated with PD. Autonomic dysfunction can occur in the disease, resulting in abnormalities in blood pressure, and orthostatic hypotension is common (65). In concordance with our results, meta-analysis of PD risk factors has identified an inverse association between hypertension and PD risk (16). However, this was only observed in case-control studies and not in cohort studies, indicating that the association might be a consequence of the disease. For hyperlipidemia, there are conflicting reports on the association with PD. However, a meta-analysis supports an inverse association between hyperlipidemia, specifically serum low-density lipoprotein cholesterol, and PD (66). It is possible that the use of lipid-lowering drugs (statins) contributes to the observed conflicting associations (67). The study participants were asked whether they had been diagnosed with hyperlipidemia and, hence, it was likely that they used pharmacological treatments for the condition. Statins are the most commonly prescribed lipid-lowering drugs in Sweden, and we cannot rule out that the observed inverse association between PD and hyperlipidemia is a consequence of statin use. Moreover, the PD patients were less likely to have a diagnosis of osteoarthritis. Contrary to our observation, arthritis (no distinction was made between rheumatoid arthritis and osteoarthritis) has been reported to be the most prevalent comorbidity in PD, with almost 47% reported having the condition (68). In our cohort, diagnosis of osteoarthritis was reported in 21% of the patients and 29% of the controls. We hypothesize two reasons for our observed association: the potential influence of the medical treatment for osteoarthritis, (commonly NSAIDs), or underdiagnosis of osteoarthritis in the patient group due to similar symptoms occurring in PD. Results from a Danish cohort studying prolonged use of NSAIDs among individuals with osteoarthritis did not support the hypothesis of a reduced PD risk with prolonged NSAID use or that individuals with osteoarthritis had a decreased PD risk, indicating that our observation is a consequence of underdiagnosis of osteoarthritis (69). Although, we observed a reduced PD risk for the use of the NSAID ibuprofen < 2 times/week but a larger sample size is needed to confirm this observation. Furthermore, associations between PD and the comorbidities depression and bowel problems were observed.
When analyzing self-reported PD symptoms, we observed a dominance of motor symptoms among the PD patients. Hypokinesia/bradykinesia was, by far, the most reported symptom, occurring in 72% of the patients and 2% of the controls. Two of the most notable non-motor symptoms observed in the patient group were delusions and hallucinations. These non-motor symptoms are frequently observed in PD patients and are more common during the later stages of the disease (70). It is important to consider that confounders could affect the associations observed between other phenotypes and PD, since adjustment only was done for sex and age. However, the results give a snapshot of the characteristics and habits in this PD cohort at the time of inclusion. Overall, this Swedish PD patient group displayed a typical PD phenome with classic clinical features of PD.
Here, we describe to our knowledge the first GWAS of PD composed solely of PD patients from Sweden, specifically the southernmost region of Sweden. Although the relatively small sample size is a limitation in this study, issues with population stratification are expected to be lower due to region-specific study recruitment and, potentially, more homogenous ancestry. The observed near genome-wide significance associated variants at the SNCA loci indicate that this cohort is a well-designed case-control cohort of PD. Missense mutations as well as copy number variants (CNVs) of SNCA have been identified to cause monogenic PD, whereas more common genetic variants have been reported to be associated with an increased risk of idiopathic PD (3). One of the identified variants in our study was reported among the 90 risk loci in the largest GWAS meta-analysis to date (12). We could only replicate 23 additional associations and only at a nominal uncorrected p-value <0.05, which is likely due to the insufficient statistical power in this study to detect variants with low MAF or small effect size. Our power calculations showed that an allele frequency of > 20% and an OR of >1.7 would be needed to reach 80 % power at a GWAS-significance level whereas the majority of 90 risk loci had an OR of 0.8-1.2 (12). Insufficient statistical power is likely also the reason for why we were unable to identify any loci associated with AAD in our cohort. Two genome-wide significant association signals have previously been reported to be linked to PD AAO, one at the SNCA loci and one at TMEM175 (52).
Interestingly, the GWA analysis identified a novel variant, rs12771445, associated with PD at a genome-wide significance level. This variant has, to our knowledge, not been reported in the PD literature and, hence, may be specific for the Swedish population. However, since the variant was not genotyped but imputed, we remain cautious in drawing conclusions on its impact on PD. The nearest identified gene is PLPP4, encoding for a phospholipid phosphatase that catalyzes the dephosphorylation of bioactive lipid mediators such as sphingosine 1-phosphate (S1P) to reduce cell activation (71).
We further looked into associations between PD and genotyped variants of PLPP4 in our data set using haplotype analysis, which identified two variants and one haplotype associated with PD status. The significantly associated haplotype rs978854(G)-rs7910507(G)-rs10886711(G)-rs11199417(G)-rs10886717(A) was more common among controls and had an OR of 0.69, indicating a decreased risk of PD among carriers of this haplotype. The two significant genotyped variants in PLPP4 both had a relatively low MAF (< 6%) and we therefore investigated the joint effect of rare variants in PLPP4 on PD. Due to the low coverage of coding variants in the gene in the genotyped and the imputed data, burden test was not performed since it assumes that rare variants in a region are causal and affect the phenotype in the same direction and with similar magnitude (46). Instead, we adapted the non-burden SKAT to investigate the joint effect of rarer variants (MAF < 5%) in PLPP4 and observed an association with PD risk for the genotyped variants but not for the imputed variants. Replication studies investigating the association between the PLPP4 locus and PD in a larger Swedish cohort are needed in order to validate our findings of an association between variants in PLPP4 and PD in the Swedish population.
Although only 23 out of 90 previously reported risk variants were replicated in the Swedish cohort, the cumulative GRS based on the 90 risk loci showed an almost five-fold higher risk for PD in the highest quartile compared to the lowest quartile. Combining the GRS with information on age, sex, family history of PD, and UPSIT score (olfactory function) has been reported to further increase the sensitivity and specificity of the PD disease status model (47). Having access to all factors but the UPSIT score, we added information on age, sex, family history of PD and PC 1-5 to our logistic regression model. However, by using the area under the roc curve (AUC) as a metric for evaluating the unadjusted against the adjusted model, no substantial improvement was observed. GRS alone gave an AUC of 0.67 while the adjusted model gave an AUC of 0.68. The non-observed difference for the two models could be due to the large proportion of the variance explained by the UPSIT score in the reported prediction model, where UPSIT score explained 63.1% of the variance compared to the substantially lower values for GRS (13.6%), family history (11.4%), gender (6.0%) and age (5.9%) (47). The lack of an association to PD in the Swedish cohort for multiple of the risk variants could also have an impact on the fit of the model applied in our cohort. Although the model is functional enough to compare risk for disease status at a population level in the cohort, additional information would be needed for disease prediction in this cohort. Interestingly, we observed an association between the GRS and AAD despite a small sample size, with one standard deviation increase in the Z-standardized GRS being associated with approximately one-year earlier AAD. This result is in concordance with previous results in other, larger, PD cohorts (22, 52).
Among the effect estimates (beta) for the 90 risk variants, the LRRK2 G2019S (rs34637584) had the largest estimate (2.43). This variant was genotyped in our dataset but excluded during the pre-imputation QC due to the low MAF (0.2%). The imputed data for the variant generated a MAF of 0.1% in the cohort and was not included in the GWAS since a MAF threshold of > 1% was used. Comparing the imputed data with the genotyped data for the variants showed that five out of seven individuals had correctly been imputed. The individuals that had been inaccurate imputed for the LRRK2 G2019S did not have a noticeable effect on the overall GRS in the cohort. Previous studies of PD cohorts in Sweden have shown that the prevalence of LRRK2 G2019S carriers is low in Sweden, 0.54% of screened 2206 PD patients were carriers (72). It has been estimated that the G2019S mutation accounts for 4% of familial and 1% of idiopathic PD cases (73). In this study, the fraction of carriers among the patients was 0.75%, further confirming a low prevalence of LRRK2 G2019S carriers among Swedish PD patients.
It has previously been observed that PD patients with an early AAO have an increased rate of ROHs compared to controls (48) and that PD patients have longer ROHs both in regard to the total distance spanned by the segments and average segment size (22). We did not observe similar results in our Swedish PD cohort. No associations were observed with PD status for ROH segment size > 1 Mb or the total distance spanned by the segments, neither in the entire cohort nor in a subset group of patients with an early diagnosis or with a first-degree relative with PD. However, a statistically significant association was observed for the number of ROH segments at a length threshold of 2 Mb in the entire cohort where PD patients had a slightly higher number of ROH segments than controls. The previously observed increased rate of ROH among PD patients with an early onset was particularly seen for ROHs > 9 Mb. Our study is underpowered since the fraction of patients with an early AAD harboring ROHs > 9 Mb was only 3%. Long ROHs are also a signature of inbreeding and do not necessarily harbor disease-causing genetic variants. Since an overall excess of homozygosity has been observed in genes/loci previously associated with PD (22), we investigated ROHs in known mendelian PD genes, the nearest gene and the QTL nominated gene for the 90 risk loci from the latest GWAS-meta-analysis (12) as well as the nearest gene of our GWAS top-hit, PLPP4. Enriched segments of homozygosity among PD patients were observed at 12 genes/loci respective 10 genes/loci for the subset group. However, none were significant following multiple test corrections and larger cohort sizes are likely needed to investigate the association of ROHs and PD.
In conclusion, this work represents a comprehensive description of a new PD case-control cohort from southern Sweden in which we identify a novel genome-wide association variant in the PLPP4 locus. This variant has, to our knowledge, not been reported in any other population. We also observed a haplotype significantly associated with PD in the PLPP4 gene. Subsequent studies are, however, needed in order to determine whether PLPP4 is associated with PD within the Swedish population. This study contributes to the understanding of population-specific environmental and genetic risk factors in PD, and the unique combination of epidemiological, clinical, and genetic data in the cohort make it suitable for future studies of gene-environment interactions in PD.
Data Availability
Code for all analyses and GWAS summary statistics will be available online. MultiPark's biobank sample collection (MPBC) is a resource at the Medical Faculty at Lund University which researchers can apply to for use for research within Parkinson's disease
https://github.com/KajBro/MPBC
https://drive.google.com/file/d/1kQJTIZAk1JNw-Dlu6ZHS95I2qw78Vuu_/view?usp=sharing
https://www.multipark.lu.se/infrastructures/biobank-platform
Conflict of Interest
KB, MS, SBC, CB, AP, PO and HW have no conflicts of interest to report. OH has acquired research support (for the institution) from AVID Radiopharmaceuticals, Biogen, Eli Lilly, Eisai, GE Healthcare, Pfizer, and Roche. In the past 2 years, he has received consultancy/speaker fees from AC Immune, Alzpath, Biogen, Cerveau, and Roche.
Acknowledgments
This research was supported by MultiPark – a Strategic Research Area at Lund University and by grants from the Swedish Research Council (VR), Åke Wiberg’s foundation, Parkinsonfonden, Åhlén foundation, Lindhés advokatbyrå, and Sigurd & Elsa Golje’s memorial foundation (KB/MS). This work was also supported in part by the Intramural Research Program of the National Institute on Aging (NIA) (SBC/CB), part of the National Institutes of Health, Department of Health and Human Services. We thank the individuals who have contributed, and donated blood samples to MPBC. We would also like to thank the research nurses and statistician Helene Jacobsson at MultiPark for conducting the data collections, and previous students of the Translational Neurogenetics Unit who have helped with questionnaire registration to REDCap. We would like to thank Megg Garcia and Alexander Swanbergsson for technical help and feedback, and the International Parkinson’s Disease Genomic Consortium (IPDGC) and its trainee network for additional help during the project, in particularly Lynne Krohn and Manuela Tan. We would also like to acknowledge the Global Parkinson’s Genetics Program (GP2) learning platform for training courses and code in Parkinson’s disease genetics. We would also like to acknowledge Ashfaq Ali at the National Bioinformatics Infrastructure Sweden at SciLifeLab for bioinformatics advice. The Region Skåne Biobank Facility (BD47) has performed the biobank services in the project.
AP receives research support from the Swedish government (ALF), Region Skåne, Skåne University Hospital, Bundy Academy, Hans Gabriel and Alice Trolle Wachtmeister Stiftelse för Medicinsk Forskning, The Swedish Parkinson Association, SCA network, all in Sweden, and receives reimbursement from Elsevier Ltd. PO has received research support from The Swedish National Government and County Councils, Skåne University Hospital Foundations and Donations, Region Skåne, Parkinsonfonden, Swedish Parkinson Academy and Åhlens Foundation.
References


