
Abstract
Using nucleotide sequences of SARS-CoV-2 strains collected in Japan, the relative instantaneous reproduction numbers of the R.1, Alpha, and Delta variants with respect to other strains circulation in Japan were estimated at 1.256, 1.449, and 1.776, respectively. The numbers can range 1.198–1.335 for R.1, 1.342–1.596 for Alpha, and 1.557–2.00 for Delta depending on the assumed serial interval distributions. The frequency of the Delta is expected to take over the Alpha in Japan around July 12, 2021.
Severe acute respiratory syndrome coronavirus 2 (SARS-CoV-2), the causative agent of COVID-19, has undergone adaptive evolution since its emergence in the human population in 2019. On May 31, 2021, the World Health Organization (WHO) has designated four variants SARS-CoV-2 as Variants of Concerns (VOCs)—Alpha, a variant lineage first reported in the United Kingdom; Beta, those in South Africa; Gamma, those in Brazil; Delta, those in India (World Health Organization, 2021). Volz et al. estimated 50–100% increase in R of the Alpha variant also using data from England (Volz et al., 2021). In our previous paper, we estimated the selective advantage of the Alpha variant in the England to be 26–45% higher than pre-existing strains using GISAID sequence data collected in England (Piantham, Linton, Nishiura, & Ito, 2021). These analyses use models that assume two circulating variants. As of June 9, 2021, the state of emergency has been declared in ten prefectures in Japan—Tokyo, Kyoto, Osaka, Hyogo, Aichi, Fukuoka, Hokkaido, Okayama, Hiroshima, and Okinawa. Due to the high transmissibility of VOCs, the replacement from local strains to Alpha and Delta variants is progressing, posing a serious public health threat in Japan. In such a situation where multiple variants are co-circulating, a model describing the adaptive evolution among multiple variants is required. Using nucleotide sequences of SARS-CoV-2 in the GISAID database (Shu & McCauley, 2017) submitted from Japan and the serial intervals of COVID-19 estimated by Nishiura et al. (Nishiura, Linton, & Akhmetzhanov, 2020), we estimate the relative instantaneous reproduction numbers of the R.1, Alpha, and Delta variants with respect to other strains circulating in Japan. We also show the expected temporal changes in variant frequencies of SARS-CoV-2 in Japan until early August 2021.
Model of Advantageous Selection Among Multiple Variants
Suppose that we have a large population of viruses consisting of strains of genotypes a, A1, …, An, of which frequencies in the viral population at a calendar time t are qa(t),  , respectively. Suppose also that genotype a is a wildtype virus that was circulating at the beginning of the target period of analysis and that genotype A1,…, An are mutants that introduced to the population at time t1,…, tn, respectively.
We assume that viruses of genotype A1,…, An generate 1 + s1,…, 1 + sn times as many secondary transmissions as those of genotype a, respectively. The instantaneous reproduction number is defined as the average number of people someone infected at time t could expect to infect given that conditions remain unchanged (Fraser, 2007). Let I(t) be the total number of infections by viruses of any genotype of a or A1, …, An at calendar time t and g(j) be the probability mass function of serial intervals. Suppose that g(j) is small enough to be neglected for j < 1 and j > l. The instantaneous reproduction numbers of genotypes a and A1, …, An at calendar time t are represented as follows:

 Since a virus of genotype Ai generates 1 + si times as many secondary transmissions as those of genotype a, the following equation holds
 for each calendar time t ≥ ti. We call the value of 1 + si the relative instantaneous reproduction number of Ai with respect to a.
Next, we assume that for all infections at calendar time t, the difference in the number of infections at the time when previous generations infected can be regarded as considerably small, i.e.
 The frequency of genotype Ai in the viral population at calendar time t,
  , can be modeled as follows:

Nucleotide sequences of SARS-CoV-2 collected in Japan
Nucleotide sequences of SARS-CoV-2 were downloaded from the GISAID EpiCoV database (Shu & McCauley, 2017) on June 5, 2021. The spike protein’s amino acid sequences of viruses detected in Japan were obtained by applying the method described in our previous paper (Piantham et al., 2021) to Japanese dataset. Each amino acid sequence was assigned to one of four labels indicating variants circulating in Japan, i.e., Alpha, Delta, R.1, or other according to the key amino acids on the spike protein shown in Table 1 (Rambaut et al., 2020). Amino acid sequences before December 1, 2020 were excluded from analysis because none of R.1, Alpha, or Beta linkages was observed in Japan. Amino acid sequences after May 8, 2021 were also excluded from the analysis because they have only a few sequences per day. Finally, daily variant frequencies of a total of 30,538 sequences—consisting of 6,044 R.1, 11,310 Alpha, 168 Delta, and 13,016 other viruses—were obtained and used in the rest of analyses (Supplementary Table 1).
Relative instantaneous reproduction numbers
Let N(t) be the number of sequences of either genotype A1, …, An, or a observed at calendar time t, and let d1, …, dk be calendar times such that N (dj) > 0 for 1 ≤ j ≤ k. Suppose that we have  sequences of genotype Ai at calendar time dj for 1 ≤ i ≤ n and 1 ≤ j≤ k. Since genotype Ai emerged at time ti,
  for dj < ti. If the genotype Ai emerges with an initial frequency of qi(ti) at calendar time ti, then the likelihood function of parameters s1, …, sn and q1(t1), …, qn(tn) for observing
  sequences of genotype A1, …, An, at calendar times d1, …, dk is given by the following formula:
 where
where  for 1 ≤ j≤ k.
The R.1, Alpha, and Delta variants were first detected in the GISAID sequence from Japan on December 1, 2020, December 15, 2020, and January 10, 2021, respectively. We assume that tR.1, tAlpha, and tDelta are these dates, respectively. The serial intervals were assumed to follow a lognormal distribution with μ = 1.38 and σ = 0.563 discretized and truncated so that g(0) = 0 and g(j) = 0 for j > 0. Parameters sR.1, sAlpha, sDelta, qR.1, qAlpha, and qDeltawere estimated by maximizing the likelihood defined in Equation (6). The 95% confidence intervals (CIs) of parameters sR.1, sAlpha, sDelta, qR.1(tR.1), qAlpha(tAlpha), and qDelta(tDelta) were estimated by profile likelihood (Pawitan, 2013). The optimization of likelihood function and calculation of 95% confidence intervals were performed using the nloptr package in R (Johnson, 2020; Rowan, 1990).
The selective advantages sR.1, sAlpha, and sDelta with respect to other strains circulating in Japan were estimated to be 0.256 (with a 95% CI from 0.253 to 0.257), 0.449 (with a 95% CI from 0.446 to 0.450), and 0.776 (with a 95% CI from 0.768 to 0.782), assuming that the serial interval distribution is a lognormal distribution with a log mean of 1.38 and log standard deviation of 0.563 (Table 2). The initial frequencies, qR.1(tR.1), qAlpha(tAlpha), and qDelta(tDelta), were estimated to be 0.00385 (95% CI from 0.00374 to 0.00408), 0.00108 (95% CI from 0.00106 to 0.00112), and 0.000000700 (95% CI from 0.000000627, 0.000000776), respectively (Table 2).
Figure 1 shows temporal changes in frequencies of R.1, Alpha, Delta variants, and other strains circulating in Japan estimated by our model. As can be observed from the trajectories of predicted frequencies for the Alpha and Delta, the Alpha seems to be predominant in Japan at the beginning of June, 2021, but the Delta is predicted to take over the Alpha on July 12, 2021 with a 95% CI from July 8 to July 16, 2021.

Temporal changes in variant frequencies of R.1 (purple), Alpha (blue), Delta (green), and others (yellow) circulating in Japan from December 1, 2020 to August 6, 2021. The circles, triangles, pluses, and crosses respectively indicate daily frequencies of SARS-CoV-2 sequences of R.1, Alpha, Delta, and others collected in Japan from December 1 2020 to May 8, 2021. The solid lines indicate the maximum likelihood estimates of frequencies of the variants using sequence data collected in Japan from December 1, 2020 to May 8. The dashed lines represent the predicted variant frequencies after May 8, 2021. Dotted lines indicate lower and upper bounds of 95% CI of estimated variant frequencies.
Population average of relative instantaneous reproduction numbers
The population average of relative instantaneous reproduction numbers, 1 + s, with respect to strains labeled as others at calendar time t was estimated by 1 + sR.1qR.1(t) + sAlphaqAlpha(t) + sDeltaqDelta(t). Since the maximum likelihood estimates of sR.1, sR.1, and sDelta can be affected by the log mean and log standard deviation of the lognormal serial interval distribution, sensitivity analyses of parameters sR.1, sAlpha, sDelta were performed by using the combinations of μ and σ sampled along the boundary of the 95% confidence area of likelihood surface of the serial interval distribution (Nishiura et al., 2020; Piantham et al., 2021). As a result, we estimated the ranges of the maximum likelihood estimates of sR.1, sR.1, and sDelta to be 0.198–0.335, 0.342–0.596, and 0.557–1.00, respectively.
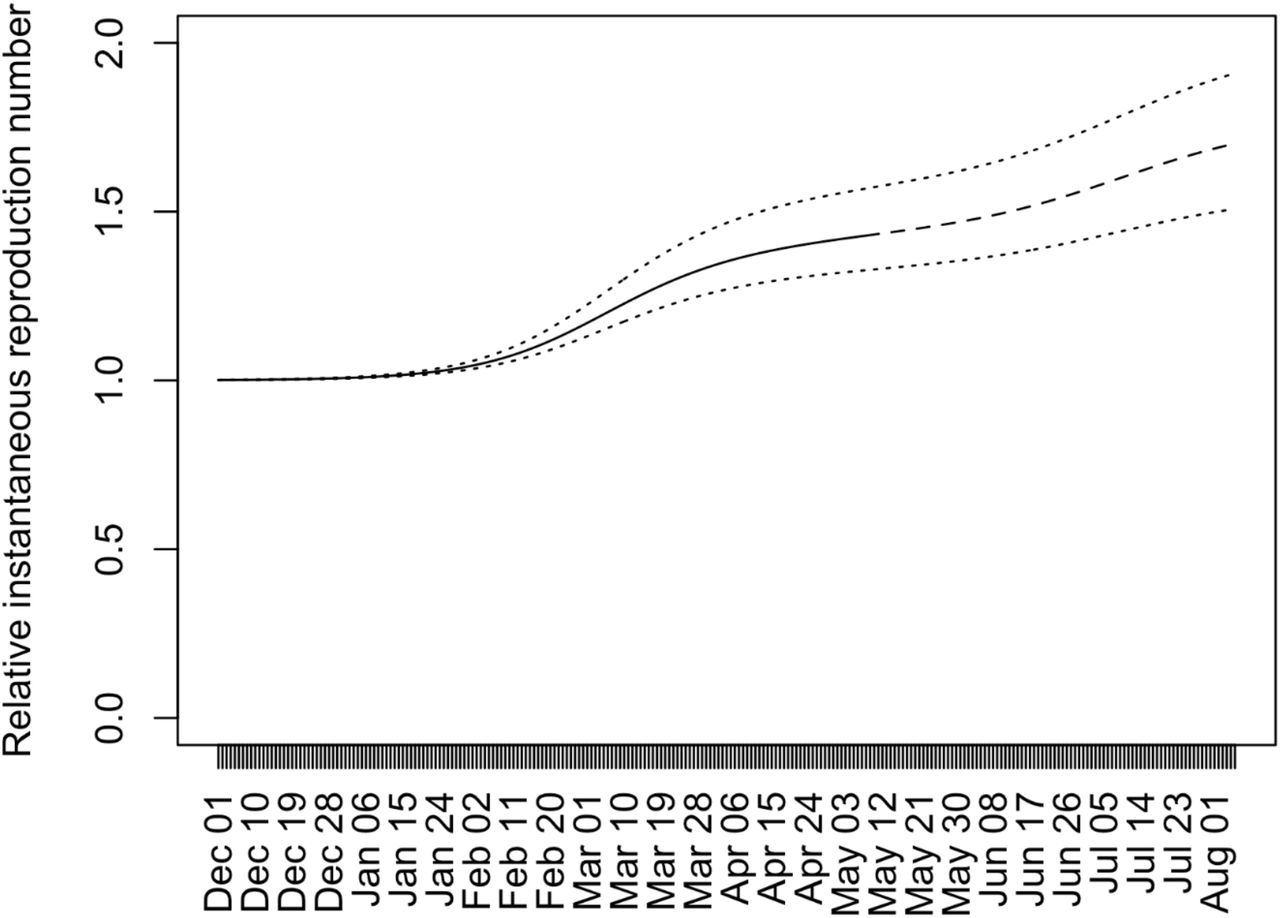
Figure 2 shows temporal changes in the population average of relative instantaneous reproduction numbers with respect to strains circulating before December 1 in Japan. The population average of relative instantaneous reproduction numbers stayed around one until the end of January 2021, since the strains other than the R.1, Alpha, or Delta variants were predominant around that time. From the beginning of February 2021, the population average of relative instantaneous reproduction has been elevated due to the increase of frequencies of the Alpha variant (Figure 1). The population average of relative instantaneous reproduction numbers reached at 1.20 on March 5, 2021. It should be noted that around this day the decrease in the number of COVID-19 cases in Tokyo leveled off although Tokyo was under the declaration of emergency status. From around the end of May 2021, the population average of relative instantaneous reproduction numbers was elevated because the frequencies of the Alpha started to decrease due to the replacement of the Alpha by the Delta (Figure 1). The elevation of population average of relative instantaneous reproduction numbers will continue until the Alpha is completely replaced by the Delta (Figure 2).

Temporal changes in the population average of the relative instantaneous reproduction numbers with respect to strains circulating before December 1 in Japan. The solid line (until May 8, 2021) and dashed line (after May 8, 2021) indicate the population average of the relative instantaneous reproduction numbers when sR.1 = 0. 256, sAlpha = 0. 449, and sDelta = 0. 776, which are calculated by assuming the lognormal serial interval distribution with μ = 1. 38 and σ = 0.563. The lower dotted line indicates the population average of the relative instantaneous reproduction numbers when sR.1 = 0. 198, sAlpha = 0. 342 and sDelta = 0.557, which are the lower bounds of sR.1, sAlpha, and sDelta calculated based of the 95% confidence area of the lognormal serial interval distribution. The upper dotted line indicates those when sR.1 = 0. 335, sAlpha = 0.596 and sDelta = 1. 00, which are upper bounds calculated in the same way (Figure 2).
Tokyo Olympic games
We have shown that the Delta variant possesses evidently greater transmissibility than the Alpha variant. The relative instantaneous reproduction number of the Alpha with respect to the strains circulating before December 1 in Japan was estimated at 1.449 and those of the Delta was estimated at 1.776. This means that the Delta possesses 1.226 times higher transmissibility than the Alpha. While the Alpha variant has just replaced other variants in Japan over the last 5 months, it is very likely that it is just a matter of time for the Delta variant to replace others including the Alpha. An important learning point of this rapid communications is that, unfortunately, the replacement is likely to happen mostly before the Tokyo Olympic games from July 23, 2021. The risk assessment must account for the fact that substantial number of international visitors during the Games will be exposed to the Delta variant, and an increased mobility could help further spread COVID-19 caused by this variant with an elevated transmissibility around the world.
Already we have seen that the interventions have had to be strengthened with the Alpha variant. We have just shown that the focused interventions on drinking and eating services that have been highly effective over the last 1 year was not effective to substantially reduce the reproduction number below the value of 1. However, the Delta variant may require even more.
Conflict of Interest
We declare that there is no conflict of interest.
Acknowledgement
We gratefully acknowledge the laboratories responsible for obtaining the specimens and the laboratories where genetic sequence data were generated and shared via the GISAID Initiative, on which this research is based. A major part of the sequence data we used in this study were from National Institute of Infectious Diseases, Japan, and prefectural institutes for public health in Japan. This work was supported by the Japan Agency for Medical Research and Development (grant numbers JP20fk0108535). K.I. received funding JSPS KAKENHI (21H03490). P.C. was supported by the World-leading Innovative and Smart Education Program (1801) from the Ministry of Education, Culture, Sports, Science, and Technology, Japan. H.N. received funding from Health and Labor Sciences Research Grants (20CA2024 and 20HA2007); the Japan Agency for Medical Research and Development (JP20fk0108140); JSPS KAKENHI (21H03198) and the Japan Science and Technology Agency (JST) SICORP (e-ASIA) program (JPMJSC20U3). The funders had no role in the study design, data collection and analysis, decision to publish, or preparation of the manuscript.


