
Abstract
A proportion of patients surviving acute COVID-19 infection develop post-COVID syndrome (long COVID) encompassing physical and neuropsychiatric symptoms lasting longer than 12 weeks. Here we studied a prospective cohort of individuals with long COVID (the ADAPT study) compared to age/gender matched subjects without long COVID, healthy donors and individuals infected with other non-SARS CoV2 human coronaviruses (the ADAPT-C study). We found an elevated diffuse serum inflammatory cytokine profile in symptomatic long COVID subjects that was maintained at 8 months post-infection and was not observed in asymptomatic COVID-19 survivors. This inflammatory profile consisted of 15 cytokines that positively correlated; revealing an apparent diffuse, potentially coordinated, low level up regulation of a spectrum of immune and inflammatory mediators. In addition, we found an absence of subsets of un-activated naїve T and B cells in peripheral blood of long COVID subjects, that did not reconstitute over time. In contrast, individual serum cytokines from the interferon I and III classes, T cell activation markers and plasma ACE2, while elevated in the serum of people previously infected with SARS-CoV-2 were not further elevated in subjects with long COVID symptoms. This work defines immunological parameters associated with long COVID and suggests future opportunities to prevention and treatment.
Introduction
Coronavirus disease 2019 (COVID-19), the illness caused by severe acute respiratory syndrome coronavirus 2 (SARS-CoV-2) infection is characterised by a wide spectrum of clinical severities in the acute phase, ranging from asymptomatic to severe fatal forms 1,2. Immunological disturbance during acute illness has been well described and is likely to both play a role in host defence and be involved in the pathogenesis of severe COVID-19 3, as evidenced by occurrences of systemic inflammatory syndromes of haemophagocytic lymphohistiocyosis (HLH) and cytokine release syndrome (CRS) 4,5. Immunological abnormalities described in the acute phase include significant immune dysregulation with lymphopaenia and elevations in IL-2, IL-6, TGF-β, IL-10, GM-CSF and TNF 3,6.
A proportion of patients surviving acute COVID-19 develop post-COVID syndrome encompassing various physical and neuropsychiatric symptoms lasting longer than 12 weeks, also known as chronic COVID syndrome (CCS), post-acute sequelae of COVID-19 (PASC) and long-haul COVID (long COVID) 7-10. Although well described following other viral infections including Severe Acute Respiratory Syndrome Coronavirus (SARS-CoV-1)11-13 and Middle East Respiratory Syndrome Coronavirus (MERS-CoV)14, these syndromes appear commonly following SARS-CoV-2 infection including following initial mild-moderate illness 15-18. Persistent symptoms 6 months after hospitalization were observed in 76% of discharged patients in a study by Huang et al, with the most frequent symptoms reported being muscle weakness and fatigue 19,20. Amongst community managed COVID-19 cases, prevalence of persisting symptoms is lower, but remains higher than might be expected given the severity of the intial illness, affecting between 10-30% of individuals at 2-3 months post infection, 21,22 continuing out to at least 8 months after initial illness 23.
The spectrum of post-acute sequelae of COVID-19 (henceforth denoted as long COVID) is broad encompassing as many as 50 plus symptoms (long COVID meta-analysis) although characteristically manifests as severe relapsing fatigue often accompanied by dyspnoea, chest tightness, cough and headache 24. The underlying pathophysiology of long COVID is poorly understood and there is currently little evidence defining the mechanisms of systemic inflammation following COVID-19 and any immune correlates of ongoing symptoms.
We examined a prospective cohort of individuals followed systematically post confirmed COVID-19 infection (the ADAPT study) and compared them to healthy donors and individuals contemporaneoulsy infected with other non-SARS CoV2 human coronaviruses (HCoV, ADAPT- C) to firstly characterise their immunological features up to 8 months post COVID-19 infection and secondly to compare those with and without persisting symptoms at this time point. Serum profiles of 29 analytes from 62 patients, 31 with long COVID and 31 matched asymptomatic controls were evaluated at 5- and 8-months post SARS-CoV-2 infection. Immune profiles identified in COVID-19 were compared with subjects who had been infected with common cold coronaviruses (HCoV-NL63, O229E, OC43 or HKU1) and unexposed healthy donors.
Methods
Cohort Characteristics
The ADAPT study is a prospective cohort study of post-COVID-19 recovery established in April 2020 23. 147 participants with confirmed SARS-CoV-2 infection were enrolled, the majority following testing in community based clinics run by St Vincent’s Hospital Sydney, with some self-reffered long COVID care patients also also enrolled. Initial study follow-up was planned for 12 months post-COVID-19, but was recently extended to 2 years. Extensive clinical data and a biorepository was systematically collected prospectively. The aims of ADAPT are to evaluate a number of outcomes after COVID-19 relating to pathophysiology, immunology and clinical sequalae. Laboratory testing for SARS-CoV-2 was performed using nucleic acid detection from respiratory specimens with the EasyScreen™ Respiratory Detection kit (Genetic Signatures, Sydney, Australia), and the EasyScreen™ SARS-CoV-2 Detection kit. Two ADAPT cohort sub-populations were defined based on initial severity of COVID-19 illness; 1. patients managed in the community and 2. patients admitted to hospital for acute infection (including those requiring intensive care support for acute respiratory distress syndrome (ARDS). Patients were defined as ‘long COVID’ at 4-months based on the presence of any ≥ 1 of the following; fatigue, dyspnoea or chest pain 23. These patients were gender and age (+/- 10 years) matched with ADAPT participants without long COVID (Matched ADAPT controls) (Table 1). Samples for these analyses were collected at the 3-, 5- and 8-month assessments. A further population of patients presenting to St Vincent’s Hospital clinics for COVID-19 testing on the multiplex respiratory panel who were PCR positive for any of the 4 human common cold coronaviruses (HCoV-NL63, O229E, OC43 or HKU1) and PCR negative for SARS- CoV-2 were recruited into the ADAPT-C sub study and used as a comparator group.
Patient characteristics. Age, gender, ethnicity and co-morbidities within the cohorts sampled. HCoV patients who were PCR positive for 229E were also positive for NL63.
Ethics
The ADAPT study was approved by the St Vincent’s Hospital Research Ethics Committee (2020/ETH00964) and is a registered trial (ACTRN12620000554965). ADAPT-C sub study was approved by the same committee (2020/ETH01429). All data were stored using REDCap electronic data capture tools. Unexposed healthy donors were recruited through St Vincent’s Hospital and was approved by St Vincent’s Hospital Research Ethics Committee (HREC/13/SVH/145). The University of Melbourne unexposed donors were approved by Medicine and Dentistry HESC-Study ID 2056689. All participants gave written informed consent.
Sample processing and Flow cytometry
Blood was collected for biomarker analysis (SST 8.5mLs ⨯ 1 (Serum) and EDTA 10mLs ⨯ 1 (Plasma)) and 36mLs was collected for PBMCs (ACD 9mLs ⨯ 4). Phenotyping of PBMC was performed as described previously 25. Briefly, cryopreserved PBMCs were thawed using RPMI (+L-glut) medium (ThermoFisher Scientific, USA) supplemented with Penicillin/Streptomycin (Sigma-Aldrich, USW), and subsequently stained with antibodies binding to extracellular markers. Extracellular panel included: Live/Dead dye Near InfraRed, CXCR5 (MU5UBEE), CD38 (HIT2) (ThermoFisher Scientific, USA); CD3 (UCHT1), CD8 (HIL-72021), PD-1 (EH12.1), TIM-3 (TD3), CD27 (L128), CD45RA (HI100), IgD (IA6-2), CD25 (2A3), and CD19 (HIB19) (Biolegend, USA); CD4 (OKT4), CD127 (A019D5), HLA-DR (L234), GRP56 (191B8), CCR7 (G043H7) and CD57 (QA17A04) (BD Biosciences, USA). Perm Buffer II (BD Pharmingen) was used for intracellular staining of granzyme B (GB11, BD Biosciences). Samples were acquired on an Cytek Aurora (Biolegend, USA) using the Spectroflo software. Prior to each run, all samples were fixed in 0.5% Paraformaldehyde.
Serum Analytes
LEGENDplex™ Human Anti-Virus Response Panel (IL-1β, IL-6, IL-8, IL-10, IL-12p70, IFN-α2, IFN- β, IFN-λ1, IFN-λ2/3, IFN-γ, TNF-α, IP-10, GM-CSF) and custom-made panel (IL-5, IL-9, IL-13, IL- 33, PD-1, sTIM-3, sCD25, CCL2(MCP-1), Pentraxin-3(PTX3), TGF-β1, CXCL9(MIG-1), MPO, PECAM-1, ICAM-1, VCAM-1) were purchased from Biolegend (San Diego, CA, USA) and assays performed as per manufacturer’s instructions. Beads were acquired and analysed on BD Fortessa X20 SORP (BD Biosciences, San Jose, CA, USA). Samples were run in duplicate, and 4000 beads were acquired per sample. Data analysis was performed using Qognit LEGENDplex™ software (Biolegend, San Diego, CA, USA).
Catalytic ACE2 detection in plasma
Plasma ACE2 activity was measured using a validated, sensitive quenched fluorescent substrate-based assay as previously described 26. Briefly, plasma (0.25 ml) was diluted into low-ionic-strength buffer (20 mmol/L Tris-HCl, pH 6.5) and added to 200 ml ANXSepharose 4 Fast-Flow resin (Amersham Biosciences, GE Healthcare, Uppsala, Sweden) that removed a previously characterized endogenous inhibitor of ACE2 activity. After binding and washing, the resulting eluate was assayed for ACE2 catalytic activity. Duplicate samples were incubated with the ACE2-specific quenched fluorescent substrate, with or without 100 mM ethylenediaminetetraacetic acid. The rate of substrate cleavage was determined by comparison to a standard curve of the free fluorophore, 4-amino-methoxycoumarin (MCA; Sigma, MO, USA) and expressed as rmole of substrate cleaved/mL of plasma/min. The intra- assay and inter-assay coefficient of variation was 5.6% and 11.8% respectively.
Dimensional Reduction and Clustering Analysis
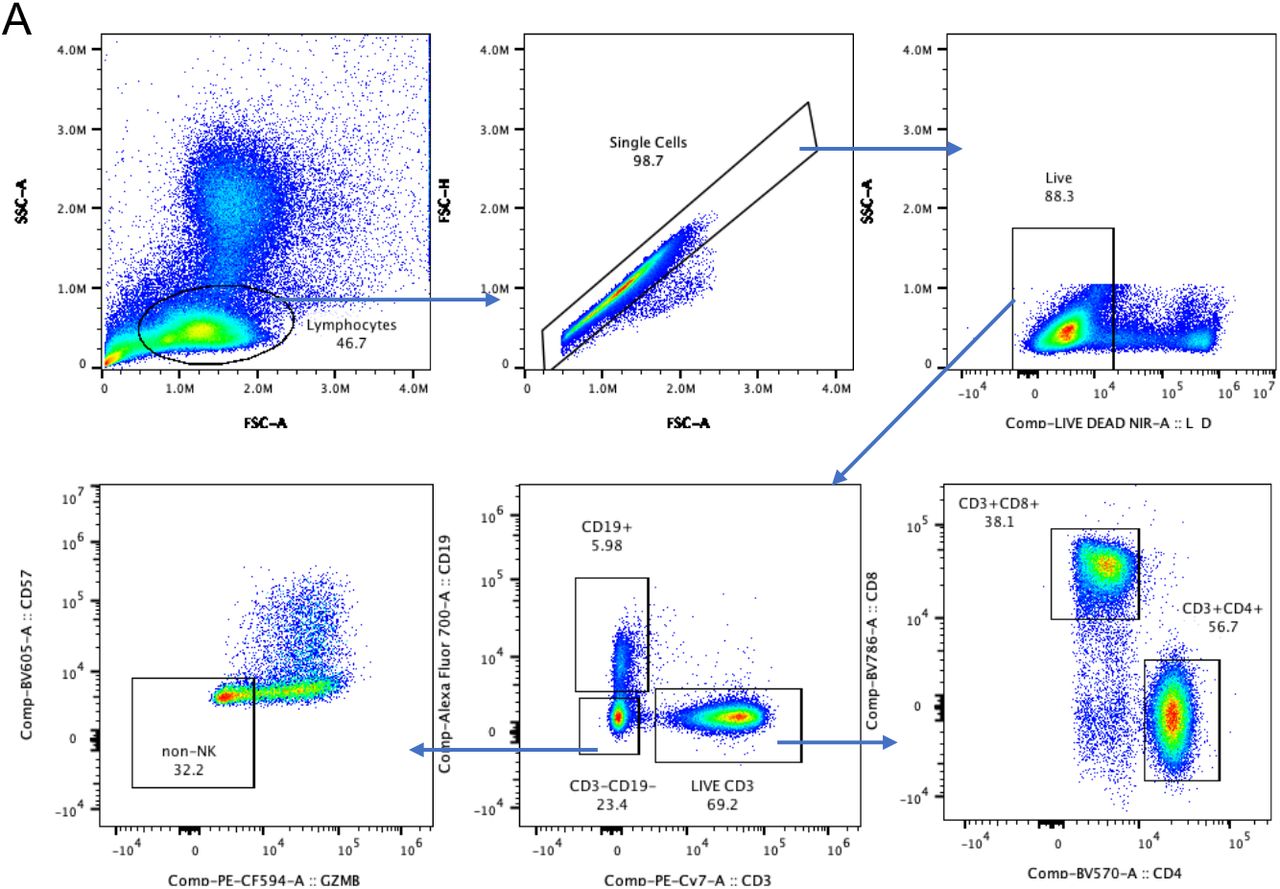
FCS3.0 files were compensated manually using acquisition-defined matrix as a guide, and gating strategy was based on unstained or endogenous controls. Live singlets were gated from long COVID and asymptomatic matched controls using Flowjo v.10.7.2, samples were decoded and statistical analysis between groups and unsupervised analysis was performed, with matched asymptomatic controls as the primary comparator group. For unsupervised analysis, the following FlowJo plugins were used: DownSample (v.3), TriMap (v.0.2), Phenograph (v.3.0) and ClusterExplorer (v.1.5.9) (all FlowJo LLC). First, 100 000 events per sample were downsampled from the total live singlet gate (Supp. Fig. 1). The newly generated FCS files were labelled according to control or patient group (long COVID or matched controls) and concatenated per group. Subsequently, 20, 000 events were taken from each grouped sample by downsampling. The two new FCS files corresponding to long COVID and matched controls were then concatenated for dimensionality reduction analysis using TriMap (40, 000 events in total). TriMap was conducted using the following parameters- to include the markers CD25, CD38, CCR7, CD19, IgD, CD45RA, PD-1, TIM-3, CD4, CD57, CD127, CD27, HLA- DR, CD8, CXCR5,GPR56 and Granzyme B, and using the following conditions: metric = euclidean, nearest neighbours = 15, and minimum distance = 0.5. Phenograph plugin was then used to determine clusters of phenotypically related cells. The same markers as TriMap and parameters k = 152 and Run ID = auto was used for analysis. Finally, ClusterExplorer plugin was used to identify the phenotype of the clusters generated by phenograph.

Statistical Analysis
All column graphs are presented as medians with inter-quartile ranges. Wilcoxon paired t test was used to analyse statistical data employing Prism 9.0 (GraphicPad, La Jolla, CA, USA) software. For unpaired samples Mann-Whitney U test was used. RStudio version 1.2.1335 was used to generate correlograms utilizing corrplot package and Spearman’s rank-order correlation coefficient with an adjusted FDR <0.05. p values <0.05 were considered significant (*<0.05, **<0.01, ***<0.001, and ****<0.0001).
Results
Elevated levels of pro-inflammatory cytokines following SARS-CoV-2 infection that are maintained at 8 months
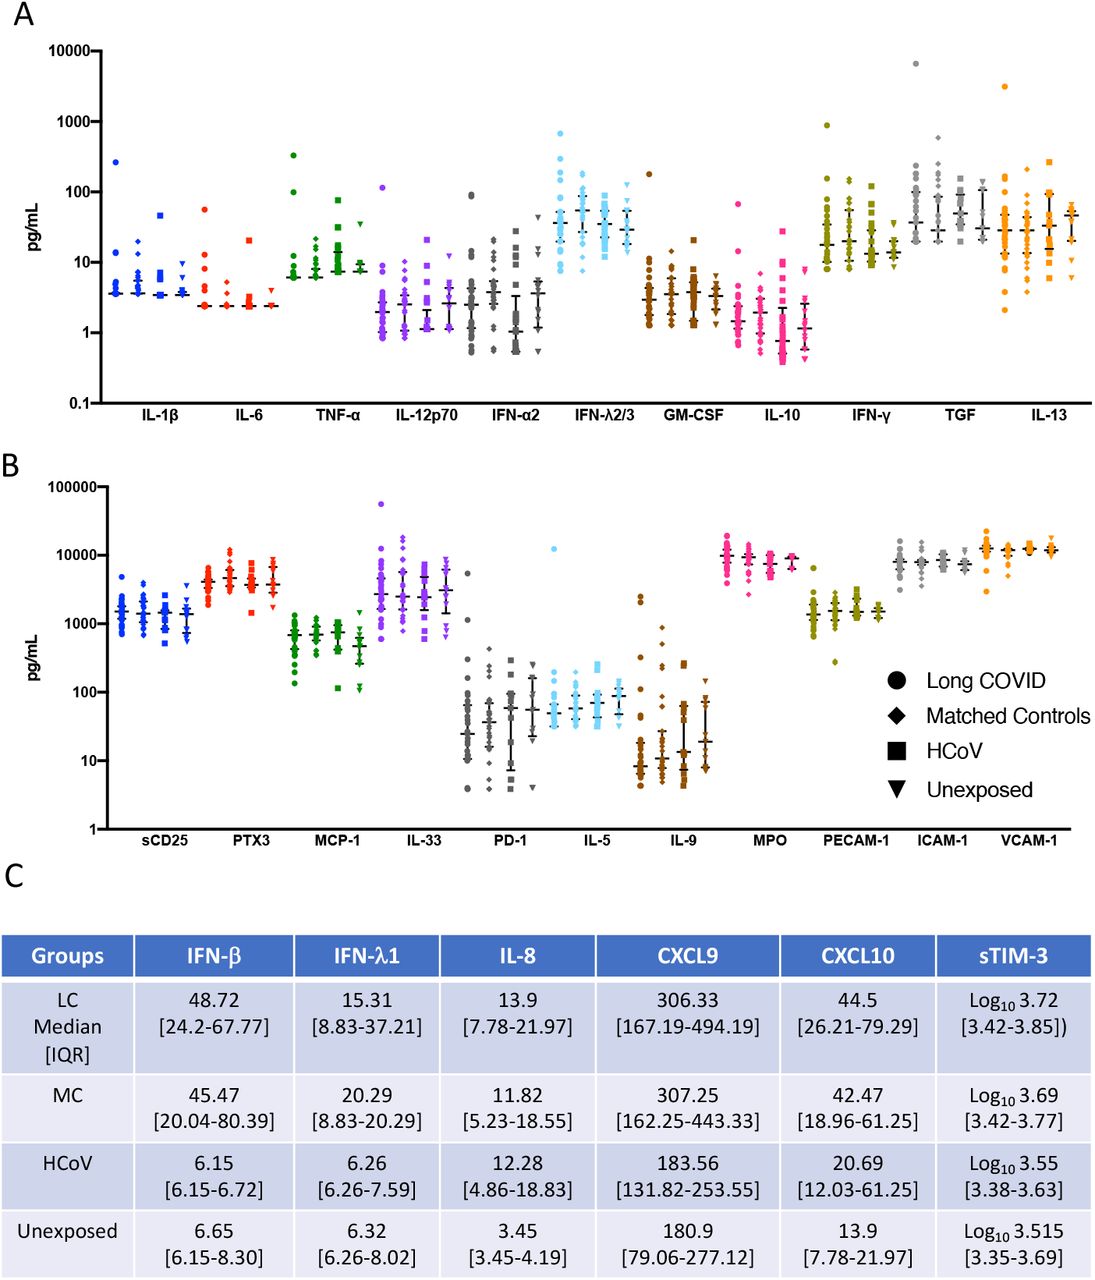
In order to assess biomarkers associated with recovery from symptomatic SARS-CoV-2 infection; 28 analytes were analysed from serum of convalescent subjects with long COVID (LC) or asymptomatic matched controls (MC) at 5 months post-infection. Individuals that were PCR positive for prevalent common cold coronaviruses (HCoV) and sampled within the same time frame following infection (3-6months) and unexposed healthy donors sampled prior to December 2019, were used as comparator groups. Six pro-inflammatory analytes were highly elevated in the two COVID-19 convalescent ADAPT groups compared to control groups (Fig. 1A), while no difference was observed with the 22 other analytes (Supp. Fig. 2A&B). Type I interferon-β (IFN-β) was 7.92-fold (median values shown in Supp. Fig 2C) and 7.39-fold higher in LC and MC compared to HCoV (both p<0.0001), and 7.32- and 6.83-fold higher compared to unexposed healthy controls (both p<0.0001, respectively). Type III interferon-lamdba1 (IFN-λ1) was 2.44-fold and 3.24-fold higher in LC and MC compared to HCoV (both p<0.0001), and 2.42- and 3.21-fold higher compared to unexposed, (both p<0.0001, respectively). This was also the case for IL-8 (CXCL8) levels; LC=3.43-fold and MC=3.56-fold higher compared to both HCoV and unexposed (all p<0.0001). Interferon gamma induced chemokines CXCL9 (MIG-1) and CXCL10 (IP-10) were elevated in LC and compared to HCoV 1.67-fold (p<0.05 and 2.15-fold (p<0.001) and unexposed (1.69-fold, p<0.0001 and 3.20-fold, p<0.0001), whereas the MC group were only significantly higher than unexposed donors (1.7-fold, p<0.0001 and 3.06-fold, p<0.01, respectively). Soluble TIM-3 levels were only elevated in LC and not MC when compared to comparator groups (HCoV=1.46-fold, p<0.05 and unexposed= 1.60-fold, p<0.05). No difference was observed between long COVID and asymptomatic matched controls for any of the individual analytes examined at 5 months post infection.


To elucidate the persistence of these elevated analytes over a longer period of time, serum from 10 subjects with the highest levels of the six pro-inflammatory cytokines from the LC and MC groups at month 8 was examined and compared with levels at 5 months (Fig. 1B). Decreases of both IFN-β and IFN-λ1 in MC group at 8 months were observed (23.78[14.07- 48.13] pg/mL, p<0.01 and 10.51[7.72-16.30] pg/mL, p<0.05, respectively), however this was not the case for LC group, where IFN-β slightly increased by 1.3-fold (76.38[26.63-199.50] pg/mL) and IFN-λ1 slightly decreased by 0.6-fold (15.03[7.72-36.08] pg/mL) at 8 months, albeit not statistically significant. Overall, type I and type III interferons remained high in LC subjects at 8 months post-infection. There was no change in IL-8 levels between 5 and 8 months in LC, a 0.6-fold reduction at month 8 was observed in MC albeit not significant. Reduction of CXCL9 (MIG-1), CXCL10 (IP-10) and sTIM-3 were evident in both groups at 8 months. There were also decreases in the levels of some of the 22 analytes not significantly different to control groups at month 5 by month 8 (Supp. Fig. 2A&B).
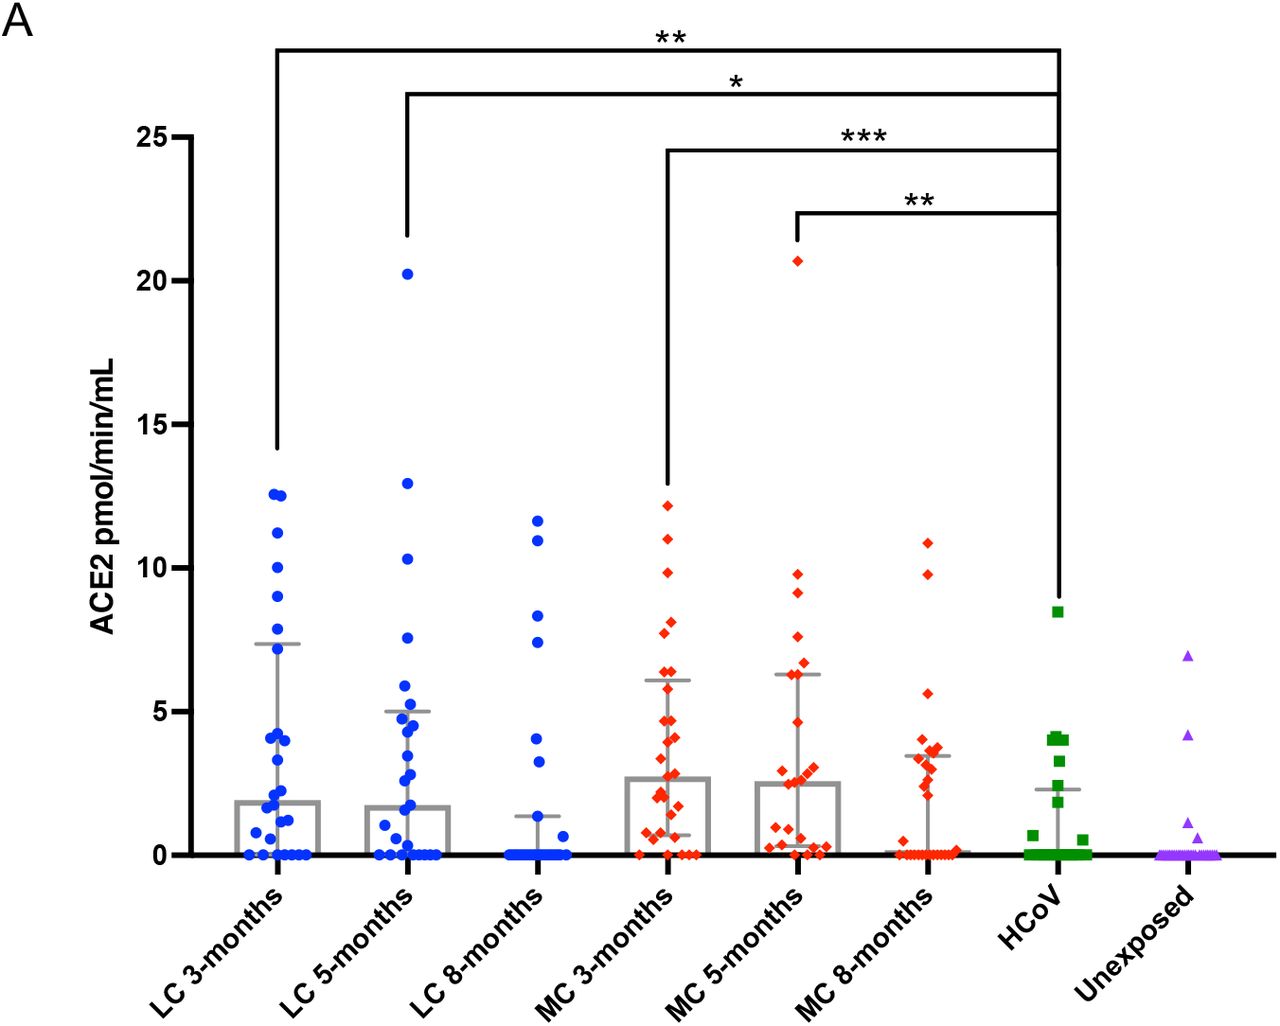
Elevated levels of ACE2 in SARS-CoV-2 convalescent subjects
Plasma ACE2 activity levels have recently been shown to be elevated out to a median of 114 days following SARS-CoV-2 infection 27, and we sought to investigate whether this was the case within the ADAPT longitudinal cohort at 3-, 5- and 8-months post-infection. At 3-months post-infection, median plasma ACE2 activity was significantly higher in both LC and MC groups compared to HCoV (LC=1.92 [0.02-7.36], MC=2.47 [0.63-5.94] versus HCoV =0.02 [0.02-1.99] pmol/min/mL, p<0.01 and p<0.001 respectively). These levels remained elevated at 5 months post-infection in both groups (LC=1.75 [0.02-5.01], MC=2.62 [0.36-6.3] versus HCoV =0.02 [0.02-1.99] pmol/min/mL, p<0.05 and p<0.001 respectively). Plasma ACE2 activity decreased at 8 months for LC (0.02[0.02-1.36] pmol/min/mL) and MC (0.18[0.02-3.46] pmol/min/mL), and no significant difference was observed when compared to levels at 3-and 5-months or when compared to HCoV. This indicated that increased plasma ACE2 activity is specific to SARS-CoV-2 infection and is not a common feature of other coronaviruses.
Diffuse elevated inflammatory cytokine milieu distinguishes long COVID
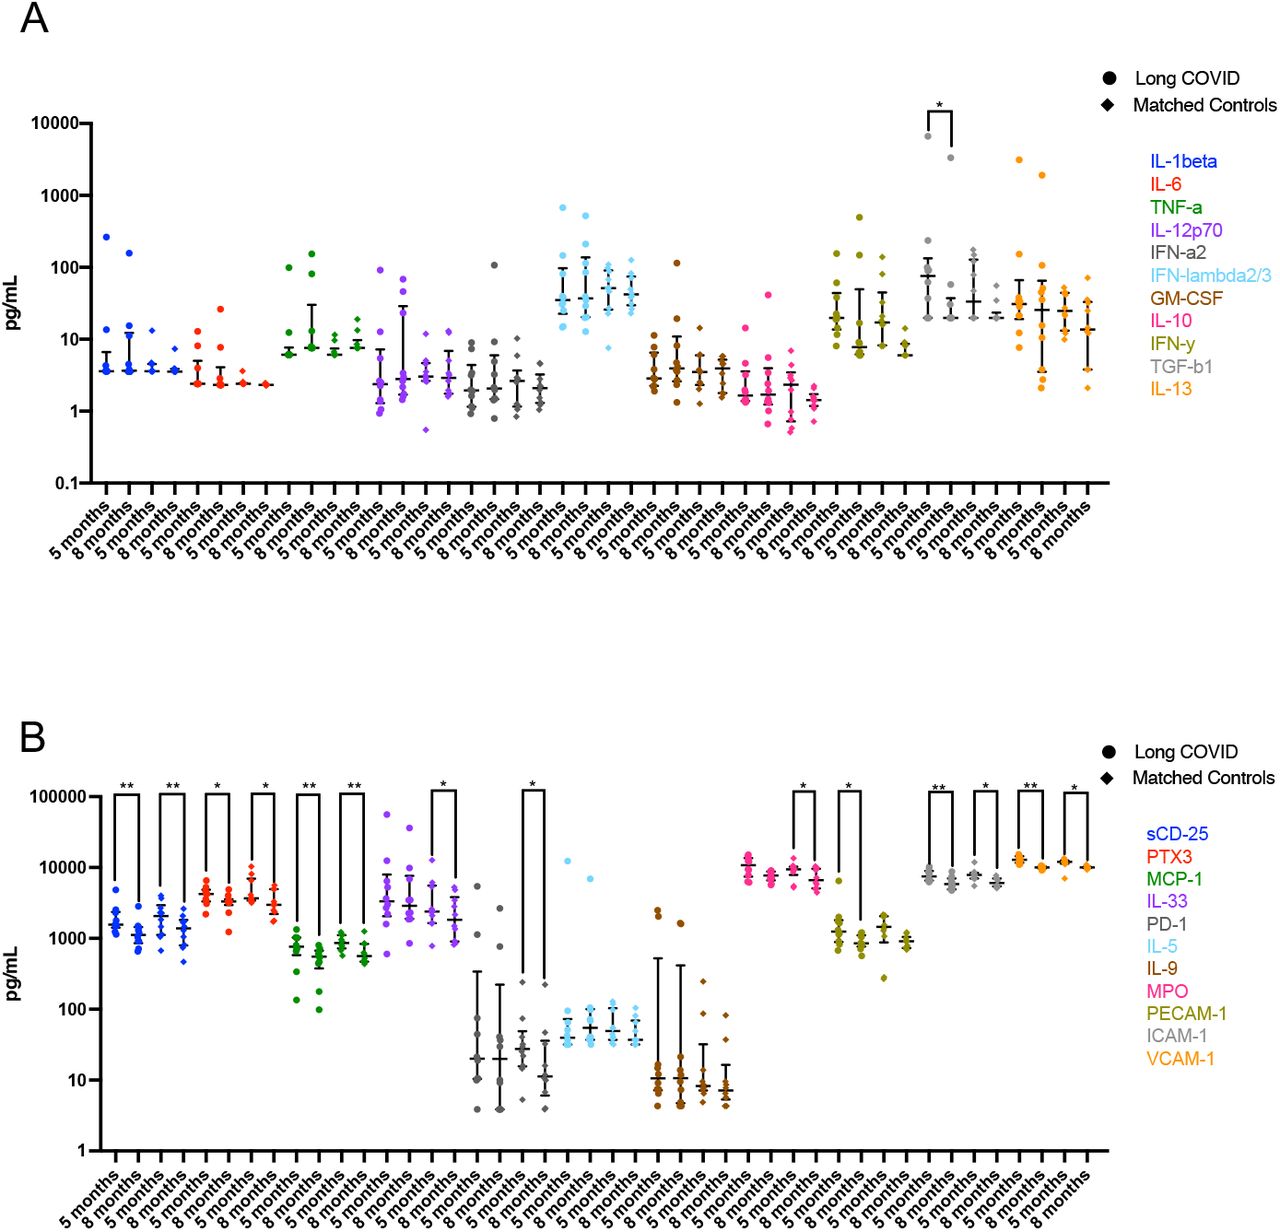
Immune responses to viral infections involve communication of multiple specialised cell populations through direct interactions, secreted cytokines and various mediators in a concerted effort to combat the infectious agent. To obtain a broader scope of systems-level interactions following convalescence, we generated correlation matrices from 29 analytes present in blood at 5 months post-infection (Fig. 3). This analysis revealed multiple positive correlations across a spectrum of 15 markers of inflammation and immune activation that include: IL-1β,, IL-33 (IL-1 family cytokines); IL-12p70, IFN-γ, TNF-α (Type 1 (Th1) cytokines); IL-5, IL-6, IL-9, IL-13, TGF-β1 (Type 2 (Th2) cytokines); IFN-α2, IFN-λ2/3 (interferons), GM-CSF, sCD25,and MCP-1 (CCL2), in the LC group most of which were not present in the asymptomatic MC group, where there was mostly no correlation or an inverse correlation between analytes (Fig. 3 A&B). These correlations in the LC group included analytes that were not significantly increased, revealing an apparent diffuse, potentially coordinated, low level up regulation of a spectrum of immune and inflammatory mediators in this group. At 8 months a similar diffuse inflammatory profile persisted for LC subjects (Fig. 3C) and was again not observed in MCs (Fig. 3D). Notably among these correlations, IFN-β (rho=0.38, p<0.05), CXCL9 (rho=0.55, p<0.001) and sTIM-3 (rho=0.42, p<0.05) levels correlated with older age in LC subjects. These 3 analytes, as well as IFN-λ1 positively correlated with increased levels of catalytic ACE2 activity (IFN-β [rho=0.50, p<0.01], CXCL9 [rho=0.623, p<0.001], sTIM-3 [rho=0.30, p<0.01] and IFN-λ1 [rho=0.42, p<0.05]). Of note, IP-10 (CXCL10) was the only analyte that correlated with age and ACE2 activity in MCs (rho=0.49, p<0.001 and rho=0.44, p<0.001, respectively). This diffuse inflammatory profile was not observed in HCoV (Supp. Fig. 4A) or unexposed donors (Supp. Fig. 4B).


Highly activated non-lymphoid cells combined with absence of un-activated naїve T and B cell subsets- a distinguishing feature of long COVID
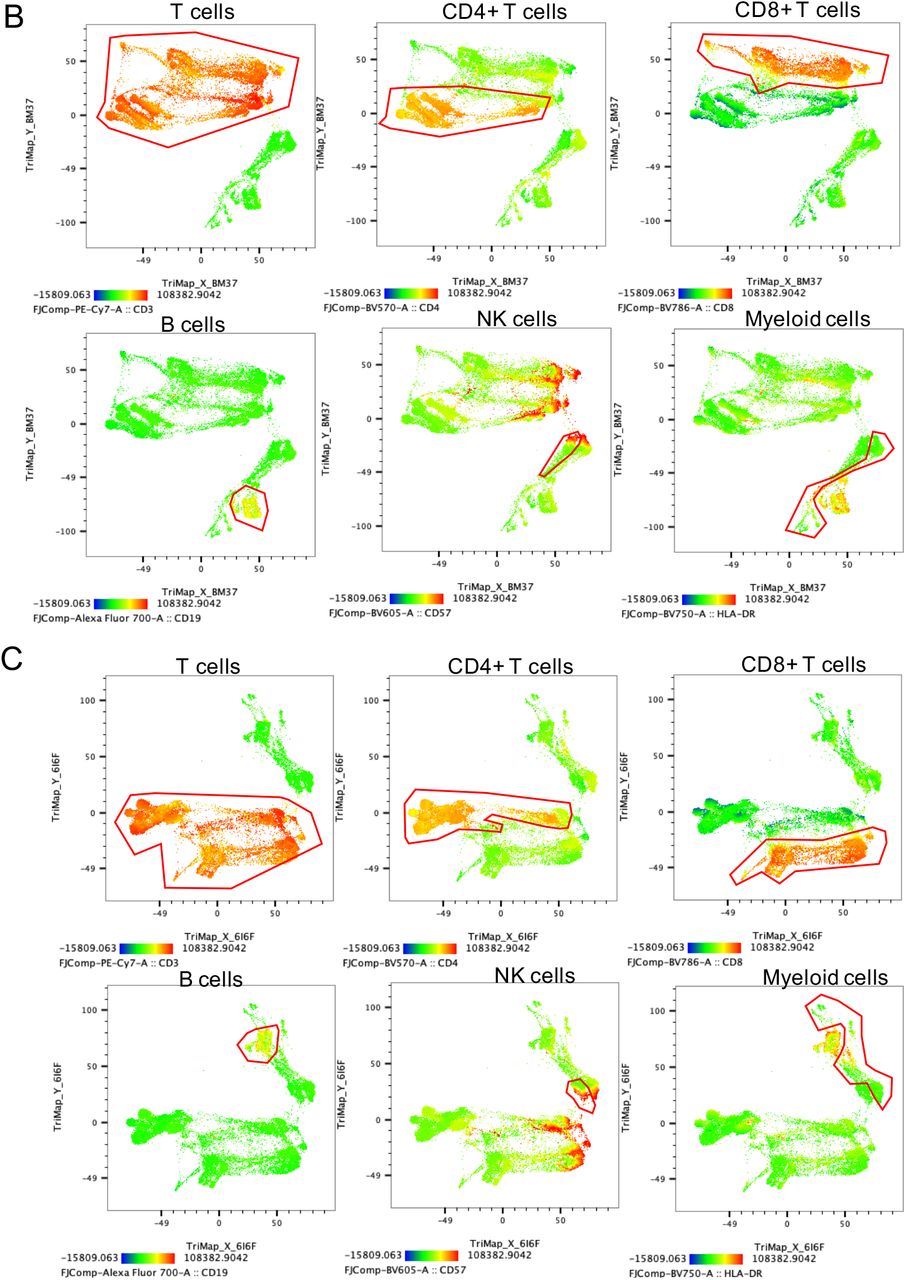
To investigate differences in immune cell phenotypes between LC and MC, a 19-parameter phenotyping panel was developed and utilised for PBMC samples from 7 patients in both the LC and MC groups at 3 months and 8 months following infection, with MC group being the primary comparator. Dimensional reduction via TriMap coupled with Phenograph clustering identified 24 distinct cell clusters at month 3 and 21 clusters at month 8 (example of cell cluster identification shown in Suppl. Fig 5A); comprising T cells, B cells, NK cells and non- lymphoid (myeloid) cells (Supp. Fig. 5B&C). Of the 24 subsets identified at month 3, five were absent in LC subjects (Fig. 5A), these include:- 1) CD127-GzmB-CCR7+CD45RA+CD27+ naїve CD8+ T cells, 2) CD57+ highly cytotoxic (GPR56+GzmB+) CD8+ T cells, 3) CD127-TIM- 3negCCR7+CD45RA+CD27+ naїve CD4+ T cells, 4) CD3+CD4-CD8- innate like T cells (may comprise NKT cells and γδ-T cells), and 5) naїve CD38lowCD27-IgD+ B cells. At 8 months only 3 populations remined absent, that is 1) CD127-GzmB-CCR7+CD45RA+CD27+ Naїve CD8+ T cells, 2) CD127-TIM-3negCCR7+CD45RA+CD27+ Naїve CD4+ T cells, and 3) CD38lowCD27-Naїve IgD+ B cells (Fig. 5B). These findings are indicative of ongoing inflammation through to 8 months in LC subjects. There was no reconstitution of these un-activated naїve T and B cell subsets even at 8 months post-infection in peripheral blood, however other naїve subsets that are more activated are present (Suppl. Fig 6). Highly activated non-lymphoid cells (defined by the coexpression of CD38+HLA-DR+) remained elevated at 8 months in LC (Fig. 5C). In contrast, activation markers on non-lymphoid cells decreased over time in asymptomatic matched controls (median 3 months= 11.2[3.43-12.5] and 8 months 8.12[2.07- 9.23], p<0.05). Notably, the immune checkpoint receptor commonly associated with T cell inhibiton/exhaustion PD-1 was highly expressed on CD8+ T cells at 3 months in LC compared to MC (17.9[9.64-29.9] and 7.13[3.41-9.74], p<0.05).


Discussion
Our study demonstrates several unique and important findings in relation to understanding long-term outcomes from COVID-19. Firstly, we show that several cytokines, mostly from interferon I and III classes, but also chemokines down stream of IFN-γ, were highly elevated in people following resolution of active SARS-CoV-2 infection compared to controls and remained so up to 8 months after initial infection. This finding was observed largely irrespective of persistent symptoms. Secondly, we demonstrate similar findings in relation to elevation of plasma ACE2 levels at 5 months compared to controls, with some observed decrease by 8 months. Finally, and of most interest, we report an elevated diffuse inflammatory cytokine profile in symptomatic ‘long COVID subjects’ that is maintained at 8 months post-infection and is not observed in those with post-COVID-19 recovery. In addition, immune cell phenotyping reveals an absence of un-activated naїve T and B cell subsets in peripheral blood and an increase in cellular activation markers CD38 and HLA-DR that are highly expressed on myeloid cells from long COVID subjects at 8 months, suggesting maintenance of long-lasting inflammation in these individuals. Together these findings suggest that SARS-CoV-2 infection exerts a uniquely prolonged effect on aspects of both the innate and adaptive immune systems, and that this may be driving the post COVID symptomology known as ‘long COVID’.
Type I and III Interferons, namely IFN-β and IFN-λ1 were highly elevated in our COVID-19 convalescent subjects compared to HCOV and unexposed subjects, and their levels decreased over time in recovered subjects but remained high in those with long COVID. IFN-β can be expressed by most cell types and can be induced early during viral infection, before most IFN- α subtypes 28-30. IFN-λ 1 or IL-29 can also be induced in a broad range of cell types by stimulation of toll-like receptors (TLRs), Ku70, and RIG-1-like receptor 31, however the main producers were found to be type 2 myeloid dendritic cells (plasmacytoid DCs)32-34. Type I interferon receptors are widely expressed on immune cells, and IFN-β responses during influenza and SARS-CoV-1 infection can result in immunopathology 35,36. In contrast, IFN-λ receptors are mainly expressed at epithelial barriers and confer localised antiviral protection 37,38. The morbidity of acute COVID-19 infection appears to correlate with high expression of type I and III interferons in the lung of patients 39. Furthermore IFN-λ produced by dendritic cells in lungs of mice in response to synthetic viral RNA damages lung epithelium 40, and IFN- λ signalling can hamper lung repair during influenza infection of mice 41. Diminished type I interferon and enhanced IL-6 and TNF-α responses in severe and critical acute COVID-19 patients were reported by Hadjadj et al, in contrast to our observations40. Our cohort of long COVID subjects, however, mostly consisted of patients with mild and moderate initial illness, and maintenance of elevated type I and III interferon levels at 8 months demonstrates ongoing inflammation within these individuals.
CXCL9 (MIG-1) and CXCL10 (IP-10) are pro-inflammatory T cell chemoattractants that are expressed by monocytes, endothelial cells, and fibroblasts downstream of interferon-gamma signalling 42. Upon engagement with their receptor CXCR3, mainly expressed on T cells, they drive naїve CD4+ T cell differentiation into effector Th1 cells, as well as recruiting CD4+ and CD8+ T cells in sites of tissue damage, which has been documented during vascular disease and pulmonary fibrosis 43,44. Both chemokines have been implicated in symptomatic acute coronavirus infections, including COVID-19, where levels were higher in severe compared to asymptomatic subjects 45, consistent with our data. Similarly, CXCL8 (IL-8) produced by lung epithelium and airway resident macrophages, has previously been shown to be released by lung cells after activation by spike proteins from SARS-CoV-1 46. CXCL8 acts as a chemoattractant that facilitates migration of inflammatory T cells and neutrophils, that may contribute to alveolar damage 47,48. In contrast to CXCL9 and CXCL10, IL-8 levels persist at 8 months in subjects with long COVID and may play a role in sustaining the inflammatory milieu.
Increased shedding or cleavage of ectodomains of cell surface proteins during inflammation has been well documented 49,50. Increased levels of soluble T-cell immunoglobulin mucin domain-3 (sTIM-3) a marker of T-cell activation/exhaustion has been reported in viral infections (i.e., HIV, hepatitis B and C)51-53, and recently in COVID-19 infection, where patients admitted to ICU had high plasma levels of sTIM-3 and myeloperoxidase (MPO) 54. Elevated sTIM-3 levels was seen in those with long COVID, but not recovered subjects or those with other HCoV, suggesting a higher degree of T cell activation/exhaustion in these individuals. Another membrane bound protein found to be ‘shed’ during COVID-19 is ACE2, which is also an important receptor for host cell entry 55. Patel et al showed that shedding of ACE2 from the cell membrane resulted in increased plasma ACE2 activity levels in convalescent COVID- 19 subjects 27. Our data corroborates with this finding, where elevated plasma ACE2 activity occurred in COVID-19 infection regardless of symptom severity, at a higher level than HCoV and unexposed, persisted at 5 months, and decreased at 8 months in most subjects. It remains to be determined whether increased plasma ACE2 activity is associated with prolonged cardiac abnormalities following COVID-19 infection.
Finally, T cell activation via surrogate markers CD38 and HLA-DR, T cell exhaustion, together with an increase in B cell plasmablasts during severe COVID-19 has been reported 56-58. We found no difference between activation levels as judged by cell surface expression of these molecules on T cells between long COVID and asymptomatic (data not shown) but identified highly activated myeloid cells comprising monocytes and dendritic cells. CD38+HLA-DR+ myeloid cells decreased over time within asymptomatic subjects but remain unchanged in those with long COVID. It is known that type I and type III interferons upregulate MHC-class expression including HLA-DR 59. PD-1 expression on CD8+ T cells remained high in LC at 8 months, which demonstrates ongoing inhibition/exhaustion. When an unbiased large-scale dimensional reduction using triplets (TriMap) approach was used, we identified 5 population clusters that were absent in long COVIDs. These consisted of mostly un-activated naїve T and B cell subsets (CD4 (CD127-TIM-3negCCR7+CD45RA+CD27+), CD8 (CD127-GzmB-CCR7+ CD45RA+CD27+) and CD127-TIM-3negCD38lowCD27-IgD+ B cells), as well as double negative (CD4-CD8-) Innate-like T cells and highly cytotoxic CD57+GPR56+GzmB+ CD8+ T cells at 3 months. These un-activated naїve subsets remained absent at the 8-month time-point. Other more activated naїve subsets were present at 3 months in both groups and remained at 8 months. It is possible that the underlying prolonged inflammation that we have shown in long COVIDs causes activation and differentiation of T and B cells, and when this inflammation is constant, exhaustion and dysfunction of these cells will eventuate. Bystander activation of these un-activated naїve subsets into more activated phenotypes is evident in long COVID, and is consistent with observations in some acute severe patients 60,61. Increased myeloid activation is associated with activation of the antigen processing and presentation machinery and up regulation of co-stimulatory molecules necessary for differentiation and polarisation of T and B cells. The diffuse inflammatory cytokine milieu found in long COVID subjects may be the cause of activation/exhaustion at the cellular level.
Our data does have some limitations. Firstly, although our long COVID ‘cases’ and controls were matched for two major characteristics (age and gender) it is possible that the differences observed reflect other key demographic or other factors between the groups. Secondly, although 7 of the 29 analytes were observed to be abnormally elevated, 22 of 29 were not (including key cytokines often implicated in chronic fatigue syndromes such as Pentraxin- 3(PTX3), TGF-β1, and IL-13)62,63. This suggests long COVID may be differentiated from other post viral fatigue syndromes, however, our results require validation in other cohorts of long COVID to ensure their replicability. Finally, our definition of ‘long COVID’ cases was internally set given the lack of international consensus regarding this and thus is not definitive. Nevertheless, the inclusion of three of the commonest persisting symptoms and the blinding of cases and controls from the laboratory scientists has helped to ensure the validity of our findings. Additional strengths of our study include the prospective protocol defined collection of samples and data and the establishment of an ADAPT–C cohort of individuals affected contemporaneously with other human coronaviruses to act as controls.
In summary, taken together our data identifies a distinct but diffuse profile of elevated inflammatory cytokines in people with persisting symptoms post COVID-19 infection, the majority of whom had initial mild-moderate illness. This inflammatory profile persists up to 8 months post-infection. We also demonstrate a lack of naїve T and B cell reconstitution in peripheral blood long after the acute phase in this group suggesting immunological inflammation at a cellular level. To our knowledge, this is the first demonstration of an abnormal immune profile in COVID-19 patients at an extended time point post infection and provides clear support for the existence of a syndrome of ‘long COVID’. Our findings require validation in other similar cohorts but provide an important foundation to understanding further the pathophysiology of this syndrome and potential therapeutic avenues for intervention.
Data Availability
Source data files will be uploaded upon submission to intended journal
Acknowledgements
The authors thank the staff at the St Vincent’s Institute for Applied Medical Research-Clinical Trials Unit. We appreciate grant support from the St Vincent’s Clinic Foundation, the Curran Foundation, the Rapid Reesponse Research Fund (UNSW) and the Medical Research Futures Fund (Australia). SKP and LMB- NHMRC programme grant APP 1055214 (LMB), Medical Research Future Fund award GNT 1175865, Austin Medical Research Foundation Grant. SJK and JAJ- the Victorian Government, MRFF Award (2005544), NHMRC program grant (1149990 (SJK, ADK), NHMRC Fellowships (1136322-SJK, 1123673-JAJ).
References


