
Abstract
Risk for late-onset Alzheimer’s disease (LOAD) is driven by multiple loci primarily identified by genome-wide association studies, many of which are common variants with minor allele frequencies (MAF)> 0.01. To identify additional common and rare LOAD risk variants, we performed a GWAS on 25,170 LOAD subjects and 41,052 cognitively normal controls in 44 datasets from the International Genomics of Alzheimer’s Project (IGAP). Existing genotype data was imputed using the dense, high-resolution Haplotype Reference Consortium (HRC) r1.1 reference panel. Stage 1 associations of P<10−5 were meta-analyzed with the European Alzheimer’s Disease Biobank (EADB) (n=20,301 cases; 21,839 controls) (stage 2 combined IGAP and EADB). An expanded meta-analysis was performed using a GWAS of parental AD/dementia history in the UK Biobank (UKBB) (n=35,214 cases; 180,791 controls) (stage 3 combined IGAP, EADB, and UKBB). Common variant (MAF≥0.01) associations were identified for 29 loci in stage 2, including novel genome-wide significant associations at TSPAN14 (P=2.33×10⁻¹²), SHARPIN (P=1.56×10⁻⁹), and ATF5/SIGLEC11 (P=1.03×10⁻⁸), and newly significant associations without using AD proxy cases in MTSS1L/IL34 (P=1.80×10⁻⁸), APH1B (P=2.10×10⁻¹³), and CLNK (P=2.24×10⁻¹⁰). Rare variant (MAF<0.01) associations with genome-wide significance in stage 2 included multiple variants in APOE and TREM2, and a novel association of a rare variant (rs143080277; MAF=0.0054; P=2.69×10⁻⁹) in NCK2, further strengthened with the inclusion of UKBB data in stage 3 (P=7.17×10⁻¹³). Single-nucleus sequence data shows that NCK2 is highly expressed in amyloid-responsive microglial cells, suggesting a role in LOAD pathology.
Introduction
Alzheimer’s disease (AD) is the most common neurodegenerative disease with an estimated 50 million persons affected globally. With the prevalence predicted to triple by 2050, AD is an intensifying public health crisis requiring insight into key genetic and environmental risk contributors to guide the development of therapeutic interventions to prevent and treat the disease. The common form of the disease, late-onset AD (LOAD) accounts for ∼ 95% of all cases and is highly heritable (h2∼60-80%)1 and polygenic2. Previous genetic studies of LOAD including genome-wide association studies3–16 and more recently sequencing studies17–23 yielded confirmed associations at nearly 30 distinct loci24, 25, including many common variants (minor allele frequency [MAF]>0.01) and more recently rare variants (MAF≤0.01) in APP26, TREM227, 28, PLCG211, ABI311, SORL117, 29, and ABCA730–32. While whole genome sequencing (WGS) studies can identify novel rare variants and private mutations in families enriched for disease33, 34, current LOAD WGS study samples sizes are much smaller than available GWAS samples34, limiting statistical power to detect genome-wide significant associations at many rare variants35. High-resolution imputation of rare and low frequency variation in large GWAS studies is a cost-effective alternative to de novo sequencing for identifying rare LOAD loci36.
This multi-stage LOAD GWAS incorporated genotype data from 109,973 cases and 285,418 controls from the International Genomics of Alzheimer’s Project (IGAP; Stage 1), European Alzheimer’s Disease Biobank37 (EADB; IGAP+EADB, Stage 2), and the UK Biobank (UKBB: IGAP+EADB+UKBB, Stage 3), imputed using the Haplotype Reference Consortium (HRC) r1.1 (IGAP and UKBB) or the Trans-Omics for Precision Medicine (TOPMed) Freeze 5 panels (EADB). We also explored the association and potential functional roles of these imputed variants with function-informed analyses including genetically-regulated gene expression and co-expression analyses. Furthermore, we applied functional genomics approaches to characterize potential roles of identified variants at the chromatin level and on the cellular level in AD pathogenesis.
Results
Study Design and Participant Characteristics
We conducted a discovery meta-analysis (Stage 1) of 44 GWAS datasets of non-Hispanic Whites (NHW) subjects [n= 25,170 cases; 41,052 cognitively normal elders] in the IGAP. IGAP comprises data from five consortia including the Alzheimer’s Disease Genetics Consortium (ADGC), the Cohorts for Heart and Aging Research in Genomic Epidemiology Consortium (CHARGE), the European Alzheimer’s Disease Initiative (EADI), and Genetic and Environmental Risk in AD/Defining Genetic, Polygenic and Environmental Risk for Alzheimer’s Disease Consortium (GERAD/PERADES) and a dataset from the University of Bonn (BONN) (cohort details in the Supplementary Note and Supplementary Table 1). We validated Stage 1 suggestive associations of P<10−5 in IGAP by meta-analysis with association results from the EADB [n= 20,301 cases; 21,839 cognitively normal elders] (Stage 2). Additionally, we performed secondary replication in an AD/dementia family history GWAS in the UKBB using 35,214 ‘proxy cases’ (defined as individuals reporting a history of AD/dementia in one or both parents and with age≥65 years) and 180,791 ‘proxy controls’ (individuals reporting no history of AD/dementia in either biological parent and with age≥65 years). Stage 3 was a meta-analysis of IGAP, EADB, and UKBB findings for variants associated with P<10−5 in IGAP. Analytic methods for the EADB replication and the UKBB secondary replication dataset are also in the Supplementary Note. The structure of the analyses is depicted in Figure 1.

A diagram of the IGAP study design. Stage 1 included HRC-imputed data in ADGC, GERAD/PERADES, EADI, CHARGE, and Bonn cohorts. Stage 2 and Stage 3 variants were selected from variants with Stage 1 associations of P<10−5. Stage 2 genotyping was performed by EADB and collaborators and genotype data were imputed to the TOPMed Freeze 5 haplotype reference panel. Stage 3 genotyping was performed by the UKBB and genotype data were imputed to the HRC + UK10K reference panel. Secondary analysis depicted included multiple follow-up analyses of variants with GWS associations, as well as a discovery analysis of UKBB for comparison against discovery-level associations in IGAP.
IGAP, EADB, and UKBB all included a similar proportion of more females than males (IGAP, 60.3% female; EADB, 59.4%; UKBB, 55.2%). Mean ages-at-onset among LOAD cases were 74.6 and 71.1 years for IGAP and EADB, respectively, with a higher onset age for the CHARGE cohorts (mean ± SD: 83.6±1.1). Average ages-at-last-exam were later among IGAP cognitively normal controls (mean ± SD: 77.4±6.4) than EADB (mean ± SD: 66.9±14.3). APOE ε4 frequencies in IGAP were 35.1% and 13.2% among cases and controls, respectively, while in EADB, they were similarly 32.6% among cases and 13.2% among controls.
Association Analysis of Common Variants (MAF>0.01)
In Stage 1 (IGAP analyses), the strongest genome-wide association was observed as expected in the region around APOE on chromosome 19q13.32 (rs7259620; P=2.25×10−199; Table 1, Supplementary Table 2, Supplementary Figures 1 and 4). Fifteen loci outside of the APOE region yielded associations with genome-wide statistical significance (P<5×10⁻⁸; GWS) in Stage 1 analyses, including variants at loci observed in prior GWAS: BIN1, PICALM, CR1, the MS4A region, CLU, SORL1, CD2AP, ABCA7, USP6NL/ECHDC3, SLC24A4, SPI1, PTK2B, IQCK, and NYAP1. Two loci newly significant in IGAP were TSPOASP1-AS1 on chromosome 17q22 (rs2526377, P=5.90×10⁻⁹) and HBEGF on chromosome 5q31.3 (rs11168036, P=1.95×10⁻⁸).
Strongest regional common variant (MAF≥0.01) association results in IGAP (Stage 1), their associations in EADB, and combined analysis of IGAP and EADB (Stage 2)
For Stage 2, we meta-analyzed data on all variants in IGAP meeting our discovery threshold (P<10−5; 3,345 variants) in Stage 1 with associations of those variants in EADB. Although the most significantly associated variants changed at many loci, Stage 2 GWS associations (Table 2, Supplementary Table 2) included all Stage 1 GWS loci. GWS associations were observed in Stage 2 at known AD loci ADAMTS1, EPHA1, HLA-DRB1/5, SPI1, SORL1, IQCK, NME8, ACE, and UNC5CL/OARD1, and at several novel loci, including TSPAN14 (rs6586028, 2.33×10⁻¹²), SHARPIN (rs34173062, P=1.56×10⁻⁹), and ATF5/SIGLEC11 (rs875121, P=1.03×10⁻⁸). Several loci that had been observed in studies mixing proxy cases and controls with clinically- and pathologically-defined cases and controls were now observed to be associated in data without proxy cases/controls, including APH1B (rs117618017, P=2.10×10⁻¹³), CLNK (rs2904297, P=1.20×10⁻¹⁰), and MTSS1L/IL34 (rs11538963, P=7.80×10⁻⁹),
Strongest common variant (MAF≥0.01) association results by genomic region in Stage 2 and Stage 3. Variants depicted had P<10−5 in IGAP (Stage 1) analysis (n=3,345 variants) and had the strongest regional association in meta-analysis of IGAP+EADB (Stage 2). UKBB AD-proxy association results and meta-analysis of IGAP, EADB, and UKBB (Stage 3) are also shown.
For stage 3, we meta-analyzed IGAP and EADB with the UKBB parental history GWAS (Table 2, Supplementary Table 2). Although parental history of dementia/AD is predictive of dementia in later life38–40, the lower precision of this phenotype as a proxy for the clinical/neuropathologic AD phenotypes in IGAP and EADB likely resulted in more heterogeneity and smaller effect sizes among the associations observed in UKBB compared to IGAP and EADB without applying any corrective factors. We considered an association replicated in the UKBB data if there was nominal statistical significance (P<0.05) and the effect direction was consistent with Stage 1 and 2 results. Replication was obtained for associations in the APOE Region, BIN1, PICALM, CR1, the MS4A region, CLU, CD2AP, ABCA7, USP6NL/ECHDC3, SLC24A4, TSPOAP1-AS1, PTK2B, NYAP1, CASS4, EPHA1, NME8, ACE, and UNC5CL/OARD1. Several of the novel loci demonstrated GWS association in Stage 3, including TSPAN14 (rs6586028, P=5.74×10⁻¹²), CLNK (rs2904297, P=1.92×10⁻¹³), SHARPIN (rs34173062, P=2.67×10⁻¹³), APH1B (rs117618017, P=9.62×10⁻¹³), and ATF5/SIGLEC11 (rs3896609, P=4.84×10⁻⁹).
We also analyzed the UKBB data alone as a GWAS of parental history of AD/dementia to compare patterns of association between AD and AD proxy phenotypes. GWS common variant associations (Supplementary Tables 3 and 4) included signals in or around known susceptibility loci such as APOE, BIN1, NYAP1/PILRB, and HLA-DRB1, as well as an association near VKORC1/BCKDK (P=3.82×10⁻⁸), which was observed in the Schwarzentruber AD family history analysis41 and reported as KAT8 in the Jansen et al. study13 which also included UKBB AD/dementia family history data. Discovery-level associations (P<10−5) were observed for several known AD susceptibility loci, including ABCA7, PICALM, MS4A Region, ADAM10/MINDY2, EPHA1, and CR1. We followed up UKBB associations with P<10−5 by meta-analysis with IGAP data and identified a GWS association at EPHX2 (rs7341557, P=5.33×10⁻¹¹) (Supplementary Tables 3 and 4), although it is unclear if this is independent of common variant associations at proximal loci CLU and PTK2B.
Association Analysis of Rare Variants (MAF≤0.01)
Stage 1 analysis of rare variants (Table 3, Supplementary Table 5, Supplementary Figures 2 and 5) identified 22 variants at 12 distinct genomic regions with associations of discovery-level significance (P<10−5) for further follow-up. In addition to multiple associations in the APOE region and in/around TREM2, novel signals attaining discovery-level significance were present in/around the genes RORA, NCK2, LINC02033/TRANK1, DYTN/MDH1B, ZBTB10/ZNF704, CNTNAP4, ODC1/NOL10, LINC00320, EPHA3, and CCDC102B, though only APOE region and TREM2 were GWS.

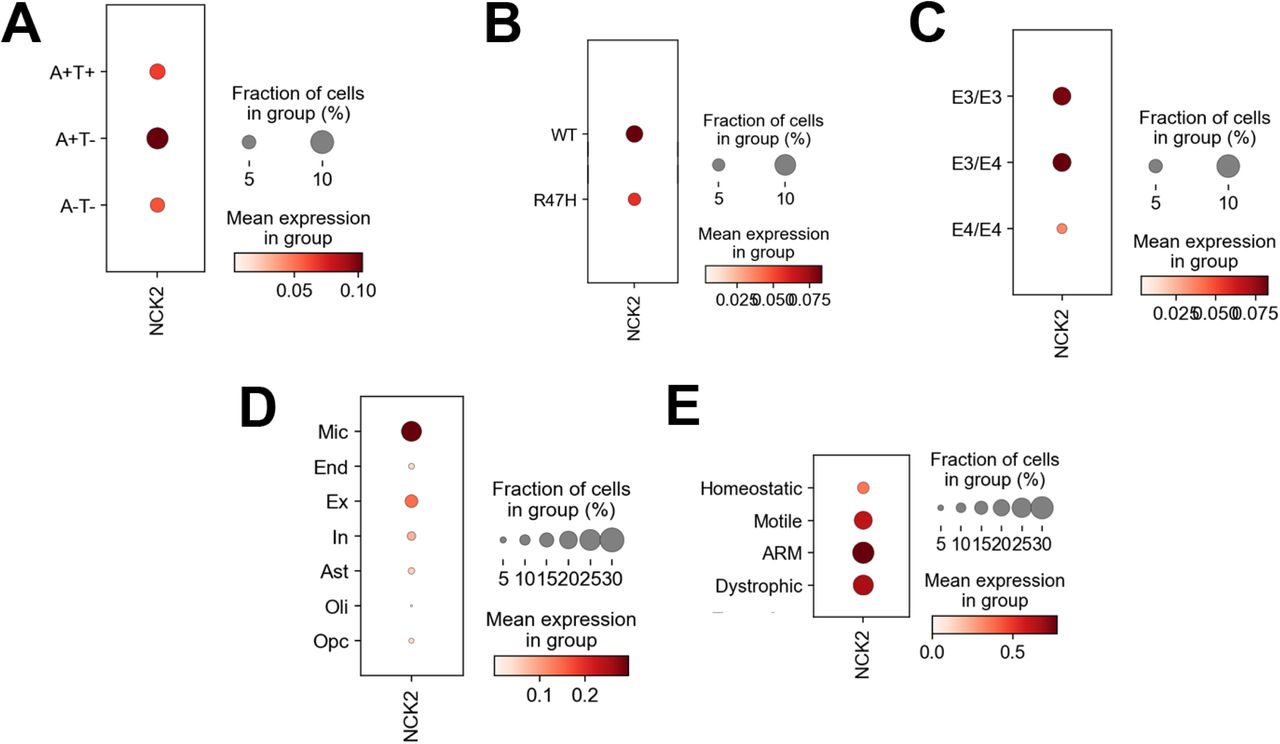
NCK2 expression was analyzed using a single nucleus RNA-sequencing dataset consisting of human cortex samples that included normal tissue without amyloid or tau aggregates (A-T-), tissue with amyloid only (A+T-) and tissue with both amyloid and tau aggregates (A+T+). NCK2 expression was highest in amyloid only brain tissues (panel A). Moreover, NCK2 expression was reduced in cases with TREM2 R47H and APOE ε4 risk genotypes (panels B and C), reminiscent of amyloid-responsive microglia. Expression analysis grouped by cell type showed that NCK2 expression was highest in microglia (Mic, panel D) compared to endothelial cells (End), excitatory neurons (Ex), inhibitory neurons (In), astrocytes (Ast), oligodendrocytes (Oli) and oligodendroglial precursor cells (Opc). Within microglial subclusters, NCK2 expression was highest in amyloid responsive microglia (ARM, panel E).
All strongest rare variant (MAF<0.01) association results in IGAP (Stage 1) [no filtering on LD], their associations in EADB, and combined analysis of IGAP and EADB (Stage 2)
Stage 2 associations (Table 4, Supplementary Table 5) meta-analyzing IGAP and EADB revealed one novel GWS association at the chromosome 2q12.2 gene NCK2 (rs143080277; Stage 2: MAF=0.0054, OR[95% CI]: 1.48 [1.29, 1.70], P=2.69×10⁻⁸; IGAP: MAF=0.0052, OR[95% CI]: 1.65 [1.36, 2.01], P=3.66×10⁻⁷; EADB: MAF=0.0056, OR[95% CI]: 1.32 [1.08, 1.61], P=0.00576).
Strongest rare variant (MAF<0.01) association results by genomic region in Stage 2 and Stage 3. Variants depicted had P<10−5 in IGAP (Stage 1) analysis (n=372 variants) and had the strongest regional association in meta-analysis of IGAP+EADB (Stage 2). Variants in close proximity with similar allele frequencies were not included. UKBB AD-proxy association results and meta-analysis of IGAP, EADB, and UKBB (Stage 3) are also shown.
Stage 3 meta-analyses (Supplementary Table 5) greatly strengthened the association at the NCK2 variant rs143080277, (Stage 3: MAF=0.0048, OR[95% CI]: 1.40 [1.28, 1.54], P=7.17×10⁻¹³; UKBB: MAF=0.0041, OR[95% CI]: 1.34 [1.18, 1.52], P=3.22×10⁻⁶). Since these NCK2 associations were inferred from imputed genotypes, we used Sanger sequencing to independently validate imputed genotypes. Assigning genotypes where imputation probabilities were >0.9, we observed 98% agreement (98% sensitivity and specificity for the minor allele) between imputed and directly observed genotypes (n=127 samples sequenced, 50% predicted referent homozygotes and 50% predicted heterozygous carriers).
Rare variant association analysis in the UKBB parental history of dementia/AD GWAS identified novel associations in the chromosome 16p13.12 gene MRTFB (rs149416930, P=1.94×10⁻⁸) and on chromosome 12p12.1 near the genes AC019209.2/MIR4302/RASSF8 (rs148024771, P=3.89×10⁻⁸) (Supplementary Tables 6 and 7).
We performed several follow-up analyses in the ADGC data on all APOE, TREM2, and NCK2 associations to determine if they were independent from known associations in APOE (the common risk-increasing ε4 and rarer protective ε2 haplotypes) and in TREM2 (R47H and R62H). For rare APOE region variants, adjustment for only APOE ε2 did not substantially reduce the association observed for any of the variants but after adjustment for both APOE ε2 and ε4, main effects were no longer statistically significant (Supplementary Table 8a), suggesting the association is driven by correlation with APOE ε4. Similarly, for TREM2, variants adjustment for R47H and R62H saw a reduction in the association of all rare variants upstream of TREM2, suggesting those associations are correlated with existing signals at R47H and R62H (Supplementary Table 8b). Separately modeling covariate adjustment for APOE ε2 and TREM2 R47H, the strength of the association NCK2 SNP rs143080277 was not substantially changed. We also tested statistical interaction between rs143080277 and TREM2 R47H and also between rs143080277 and APOE ε2; the main effects of the NCK2 variant in these models were not substantially changed, suggesting the NCK2 variant remains largely independent of APOE ε2 and TREM2 R47H (Supplementary Table 8c). We also examined NCK2 for common variant and other rare variant associations, and though a discovery-level association was observed in the UKBB for a variant of MAF=0.022 (rs17269688, P=1.52×10⁻⁶), no NCK2 variants other than rs143080277 had discovery-level associations in IGAP (Stage 1) (data not shown).
Re-analysis with weighted AD/dementia parental history GWAS statistics
In prior analyses of the AD/dementia family history phenotype, the β and SE were doubled in order to account for the proxy phenotype being a measure of the reported AD/dementia affection status of two parents. We re-analyzed the Stage 1-3 common variant and rare variant analyses using a doubled β and SE to examine potential strengthened associations. For common variants, several loci which attained GWS in Stage 2 but not in Stage 3 were GWS in Stage 3 re-analysis (Supplementary Table 9a), including ADAMTS1 (rs2830500, P=3.98×10⁻¹⁰), SPI1 (rs11039202, P=2.88×10⁻⁹), SORL1 (rs3781831, P=2.85×10⁻¹⁰), USP50 [near SPPL2A] (rs3131610, P=1.35×10⁻⁸) and IQCK (rs9926151, P=3.61×10⁻⁸). In addition, a newly GWS association was observed in Stage 3 for a variant in EIF4G3 (rs12407731, P=2.36×10⁻⁸). For rare variants, while the level of significance for most variants increased, no additional loci demonstrated GWS in Stage 3 re-analysis (Supplementary Table 9b), only the rare variants at APOE, TREM2, and NCK2. Revisiting the UKBB common variant and rare variant discovery analyses (Supplementary Tables 9c and 9d, respectively), no additional variants demonstrated GWS in the UKBB + IGAP meta-analysis.
Gene-Based Association Analysis
Performing gene-based association testing on all rare variants (MAF≤0.01) (Supplementary Table 10), we observed only Bonferroni-corrected statistically significant associations at APOE and TREM2. After applying additional filtering on CADD C-score predicted deleteriousness (Supplementary Table 11), again only APOE and TREM2 demonstrated association at Bonferroni-corrected significance thresholds at all three deleteriousness thresholds, C≥5, C≥10, and C≥15 and including variants with imputation R2≥0.3,
We also examined gene-based association with MAGMA using common variants (MAF>0.01) within a 35kb upstream (5’) and 10kb downstream (3’) window around gene boundaries. Using a gene-based testing approach aggregating P-values for the most associated SNP and the mean SNP association (“Pmulti”), we identified several gene associations meeting a Bonferroni-corrected threshold for significance for 19,427 genes tested (α=2.57×10⁻⁶) (Supplementary Table 12). In addition to associations at multiple genes in the APOE region, many genes containing GWS-associated SNPs from single-variant analyses were also strongly associated in gene-based analyses, including CR1/CR1L, BIN1, multiple MS4A region genes, CLU, PICALM, TREM2, CD2AP, SPI1, SORL1, IQCK, PTK2B, and HBEGF. Notably, multiple genes in the immediate vicinity of SPI1 on chromosome 11p11.2 demonstrated highly significant associations exceeding both GWS and Bonferroni-corrected thresholds in both single-variant and gene-based analyses, including the genes SLC39A13, MTCH2, PSMC3, FNBP4, NDUFS3, NUP160, RAPSN, AGBL2, PTPMT1, and MYBPC3.
Pathway Analysis
MAGMA-based pathway analyses using multiple annotation sources identified 30 distinct pathways with FDR-corrected associations of Q<0.05 when using gene-wide statistics from the MAGMA “multi” association model and a 35kb upstream/10kb downstream window to assign SNPs to genes (Supplementary Table 13). These included more significant associations for LOAD pathologic processes identified in previous IGAP analyses12, such as both negative and positive regulation of APP protein catabolism (GO:1902991, GO:1902993), tau protein binding (GO:0048156), Aβ formation (GO:1902003); pathways capturing cognitive processes, such as learning or memory (GO:0007611) and cognition (GO:0050890); and immune-related pathways like those involving the MHC protein complex (GO:0042611). Examining the strongest gene-based associations among genes assigned to the 30 pathways with strongest associations (Q<0.05) in the MAGMA pathway analysis (Supplementary Table 14) identified multiple genes containing confirmed loci, including APOE, CLU, BIN1, PICALM, SORL1, PTK2B, and ACE, as well as several biological candidates including SCARA3, and SPI1 region genes such as NUP160 and PTPMT1.
Co-expression Analysis
MAGMA analyses (“multi” gene association module with a 35kb 5’/10kb 3’ window) using co-expression modules from multiple sources (Supplementary Table 15) identified strong associations in modules from multiple sources that are enriched for immune response-related genes, some of which have considerable overlap with others (Gibbs:34, Gandal:CD11, Neueder:28, and Neueder:54) while others included distinct gene sets (Zhang:25). Two of the most strongly associated modules (Gibbs:34 and Gibbs:56), both previously correlated with AD42, were enriched for genes in the TYROBP causal network which relates to immune receptor binding on microglia, however none of the overlapping genes included GWAS signals or other known AD susceptibility loci.
The genes most strongly associated in the top co-expression modules (Neueder:28, Gibbs:34, Zhang:37, and Gandal:CD11) (Supplementary Table 16) include many genes containing top LOAD susceptibility loci from GWAS (several APOE region genes, MS4A4A/MS4A6A, PICALM, SPI1, TREM2, SORL1, SLC24A4, and ACE) as well as genes (RERE, PURA) implicated in AD pathology in functional or transcriptomic analyses43.
Analysis of Genetically Regulated Expression Using PrediXcan
We used PrediXcan to assess whether the variants (Supplementary Table 17a-b) and genes (Supplementary Table 17c-d) with discovery-level association (P<10−5 for variants; Bonferroni-corrected α thresholds for genes) were associated with expression patterns imputed using whole-body tissue transcriptome reference data from the GTEx Consortium (version 8). Looking at genes containing GWS variants, we observed 137 genes associated with FDR-corrected Q<0.05 (Supplementary Table 17a) across a broad range of tissues, including brain region-specific associations with CR1 and CLU as well as multiple SPI1-region genes including MTCH2 and SLC39A13. Collapsing expression patterns across brain tissues (“cross-brain”), we observed brain-specific associations (Q<0.05) in APOE region genes, CLU, CR1, and MS4A region genes (Supplementary Table 17b). Following up on 20 genes of interest from gene-based analyses, five genes met FDR-corrected Q<0.05 in preliminary analyses of expression of individual tissue types (Supplementary Table 17c), while six of the 20 genes had at least one significant association of FDR-corrected Q<0.05 with collapsed expression patterns across all tissues (“cross-all”) or “cross-brain” (Supplementary Table 17d): TOMM40, BCAM, PPP1R37, and CLASRP in the APOE region; PSMC3 in the vicinity of SPI1; and TREM2.
NCK2 Tissue-Specific Expression
The GWS variant rs143080277 is in the first intron of NCK2 (encoding the NCK adaptor protein 2; MIM: 604930). This gene is in a 743 kb topologically-associating domain (TAD)44 containing only three other genes, C2orf49, FHL2, and ECRG4 (C2orf40). Of these genes, only C2orf49 and NCK2 are expressed in multiple brain regions. NCK2 is also highly expressed in a variety of cell types including CD19+ B-Cells, CD4+ T cells, and CD8+ B cells (Supplementary Figure 6, data from BioGPS45). Single nuclei RNA-Seq of these genes show that NCK2 is selectively expressed in the AD-relevant cell type, microglia (Figure 2). We examined human cortex samples46 that included normal tissue without amyloid or tau aggregates (A-T-), tissue with amyloid only (A+T-) and tissue with both amyloid and tau aggregates (A+T+). The highest expression was observed is in amyloid-responsive and homeostatic microglia in tau-negative regions (A+T-). NCK2 expression in microglia is also influenced by TREM2 genotypes and is reduced in R47H TREM2 carriers compared to the wildtype genotype. Also, NCK2 expression is reduced in APOE ε4/ε4 subjects compared to APOE ε3/ε3 or ε3/ε4. Both TREM2 and APOE are part of the microglial response triggered in AD.
Mapping Regulatory Roles and Chromatin Interactions of rs143080277/NCK2
The NCK2 variant rs143080277 falls within enhancer regions in 47 ROADMAP47 enhancer tracks, including tissues in four brain regions (dorsolateral prefrontal cortex, inferior temporal lobe, substantia nigra, and anterior caudate nucleus) and cell types including monocytes and T cells, among others. Analyzing Hi-C data48 from six human cell lines with ENCODE/ROADMAP functional genomic data, we found interactions between the rs143080277 location and multiple other genomic regions, but not the promoter of NCK2 (Supplementary Figure 7). Using our high-resolution promoter-focused Capture C and ATAC-Seq database that includes >40 cell types and conditions49, we observed two enhancer-promoter interactions in follicular B helper T (TFH) cells50. One is a loop (∼390 kb) from this SNP to an open alternative promoter of a short isoform (NM_001253876.1) of UXS1 in TFH cells (Supplementary Figure 8a). The other contacted a closed alternative promoter of a short isoform (NM_001004720.3) of NCK2.
We also performed a more relaxed search in neural cell types only without requiring the SNP or the gene promoter to reside in open chromatin and investigating both the index SNP (rs143080277) and a proxy SNP (rs144636993; r2∼0.5 (D’=1) in the 1000 Genomes European [EUR] populations). One loop was observed between one loop between rs144636993 and an alternative promoter of the same short isoform (NM_001004720.3) of NCK2 in ESC-derived hypothalamic neurons51, however neither the SNP nor the promoter were found to be open (Supplementary Figure 8b).
Discussion
In this study, we imputed rare variants using a high-density haplotype reference panel in a large collection of LOAD GWAS to identify novel associations with individual variants, genes, and gene sets, with the goal of further elucidating the genetic contributors to the pathology of this highly prevalent disease. We extended our genomic interrogation with functional genomics annotation and AD-relevant functional genomics resources including expression data and chromatin structure data to better characterize the role of novel variants we identified. This strategy proved effective in identifying a novel rare variant association with LOAD in the gene NCK2, rs143080277 (MAF=0.0054), which appears to alter expression patterns in amyloid-responsive microglia. Although more functional characterization is needed, this suggests a potential role in AD pathology worth additional exploration.
While little is understood about the specific role or roles NCK2 (encoding the NCK adaptor protein 2; MIM: 604930) may play in neurodegenerative processes, it is known to interact with a variety of genes/proteins that have already been implicated in AD (Supplementary Figure 9), including ephrins (EFNB1, EFNB2, EFNB3) [genes encoding ephrin receptors include known AD gene EPHA1]; VLDLR, which encodes an ApoE receptor; and IGF1R12.
Our exploratory functional work noted that the associated rs143080277 variant may perform a regulatory role in the expression of NCK2 in brain tissues, and in particular amyloid-responsive microglia. Furthermore, our examination of differential expression patterns of NCK2 against APOE ε2/ε3/ε4 and TREM2 R47H backgrounds suggests that there may be some functional interactions with these major contributors to AD risk.
In addition to the novel rare variant association, we observed several novel common variant associations at APH1B, TSPAN14, CLNK, SHARPIN, MTSS1L/IL34, and ATF5/SIGLEC11 as well as the first ancestry-specific confirmatory GWS associations of TSPOASP1-AS1 and HBEGF, which were previously observed in a multi-ethnic GWAS of LOAD52. Among the novel loci, TSPAN14, encoding tetraspanin 14, is one of a family of proteins involved in proteolytic processing of the amyloid precursor protein (APP)53 through physical interactions with APP secretases, and appears to regulate ADAM10 cleavage of substrates54, which may alter levels of Aβ production55. SHARPIN, which encodes Shank-associated RH domain-interacting protein, is a key regulator of neuroinflammatory response, stimulating macrophage activity and promoting Aβ phagocytosis in the presence of circulating Aβ56. A rare variant in SHARPIN have been shown to limit immune response57, which may promote LOAD development. ATF5, encoding activating transcription factor 5, and plays a critical regulatory role in neuronal development, downregulating differentiation of neuroprogenitor cells58. SIGLEC11 is a member of the sialic acid-binding, immunoglobulin-like lectin family, and Siglec-11 mediates anti-inflammatory activity and acts as an inhibitory receptor of inflammatory responses of microglia, potentially regulating microglial neurotoxivity59, 60. Among the loci identified in previous studies which used proxy cases/controls, APH1B, which encodes the Aph1B subunit of the γ-secretase complex, is critical to processing APP and inhibition or deletion of the subunit leads to reduced clearance of Aβ61 and memory issues62. MTSS1L, encoding metastasis suppressor 2 (formerly metastasis suppressor 1-like), is involved in plasma membrane dynamics. It is highly expressed in brain with modest or little expression in other tissues63. Though there is limited information on its potential role in Alzheimer’s disease, whole exome sequencing in 143 consanguineous families identified variation in this gene associated with neurodegeneration64. Variants of MTSS1L have also been implicated in a spectrum of neurodevelopment-related phenotypes including global development delay65 and educational attainment66. IL34 encodes the cytokine Interleukin-3467 which promotes the proliferation of microglia and clearance of soluble oligomeric Aβ, reducing neuronal damage in AD68. CLNK encodes cytokine-dependent hematopoietic cell linker and is known to play a role in immunoreceptor-mediated signaling events. CLNK has been shown to interact, when phosphorylated, with PLCG269. PLCG2 is a transmembrane signaling enzyme with critical regulatory functions in the immune system70 in which variation has been shown previously to be associated with AD11. While CLNK has previously been identified in GWAS of family history of AD and studies mixing AD status with AD/dementia family history, this is first time GWS association with a pure AD phenotype has been observed at this locus.
The emerging LOAD loci confirmed in this analysis, TSPOAP1 and HBEGF, were both observed with GWS in a prior GWAS meta-analysis52 of 33,269 ADGC subjects, including 26,320 individuals of European ancestry, 4,983 African Americans, 1,845 Japanese subjects, and 115 Israeli-Arab participants). It should be noted that in a multi-ethnic study, allele frequencies and strength of association may be variable across ancestries; this study is the first time that these associations have been observed to attain genome-wide significance within ancestry among subjects of European ancestry, strengthening support for true association. That these loci were only observed as GWS in a single-ancestry sample of 80,685 cases and 243,682 controls of European ancestry, a study nearly 10 times larger than the multi-ethnic sample, reflects the power and utility of trans-ethnic meta-analyses in identifying novel loci over much larger ancestrally homogeneous data collections.
TSPOAP1 (formerly BZRAP1) encodes benzodiazepine-associated protein 1, a subunit of the benzodiazepine receptor complex in mitochondria, of which increased binding activity may indicate brain inflammation71–73. Additionally, benzodiazepine use has been shown to increase risk of dementia74. HBEGF, which encodes heparin EGF-like growth factor, has varied roles including cardiac hypertrophy and development75. Some functional work suggests that HBEGF may have a role in AD: a murine model with HBEGF expression knocked out in cortex and hippocampus demonstrated the impaired psychiatric and cognitive functions expected with down-regulation of NMDA receptors76.
While our analyses benefitted from the combined statistical power of large, well-characterized AD GWAS collections with biobank GWAS data, we had several concerns about the different phenotype (AD/dementia parental history) we used in the UKBB. Following up discovery-level associations first in EADB and then in UKBB, while we expected and observed reduced statistical significance in those data because of the “winner’s curse,” we noticed lower strength of association (ORs closer to 1) across variants in UKBB compared to IGAP and EADB, which had similar strength of association, although the directions of association and minor allele frequencies were similar for most variants across all three datasets/collections. We surmise that this may indicate the effect of two forms of “misclassification” in the AD/dementia parental history phenotype relative to LOAD affection status: (1) as subject ages-at-exam in UKBB are mostly below the LOAD average age-of-onset in IGAP and EADB, the parental history phenotype misclassifies true future AD status, as some persons with parental history will not develop AD and some persons without parental history will develop AD; (2) as the phenotype includes parental history of dementia, some subjects are likely at elevated risk of alternate causes of dementia (e.g., Parkinsonian dementia, Frontotemporal Dementia, and Lewy Body Disease, among others) relative to their risk for AD. While we expect that (1) might explain reduced associations in UKBB, we performed a discovery GWAS analysis using UKBB and the parental history phenotype to determine whether a large set of non-AD loci would be identified. If this were the case, this would suggest that the more concerning form of misclassification might be (2). In comparing the top hits of the two analyses, a substantial overlap was observed among the strongest associations, which included GWS associations in the APOE region, BIN1, HLA-DRB1, ABCA7, PICALM, ADAM10, the MS4A region, and CR1. Several of these top associations are shared across multiple neurodegenerative phenotypes (e.g., HLA-DRB1 in Parkinson’s disease (PD)). One association with GWS after combining UKBB and IGAP was observed in EPHX2, which has some prior evidence of association with AD77 and upregulation of its hydrolase activity leads to increased neuronal cell death78, though it is unclear if this association is capturing the effects of variation at the proximal genes CLU and PTK2B. A discovery-level association (rs575683378, P=4.85×10⁻⁶) was observed for a rare variant (MAF=0.0014) in the gene encoding α-synuclein (SNCA), as established PD locus, however a similar rare variant association was not observed at or near this variant in IGAP. While this does not rule out possible misclassification effects from persons with higher risk of dementia from non-AD causes, it suggests that the higher prevalence of AD relative to other forms of dementia likely exerts minimal effect on the most strongly associated AD loci. It remains unclear if combining LOAD GWAS studies in IGAP and EADB with less rigorously defined case definitions like in UKBB would increase the possibility of misclassification. Therefore, the increased sample size available from the integration of studies with “silver standard” phenotypes (such as UKBB) may be useful if evaluated with appropriate caution regarding study conclusions79.
This study has several potential limitations, including modest increases in sample sizes from prior AD GWAS meta-analyses and potentially reduced power to detect novel AD loci by excluding the UKBB GWAS from discovery-level analyses. While the modest growth in sample size may have provided limited additional power to detect several additional novel common variant loci, we believe the strength of the analysis lie in the ability to robustly identify rare variant associations by combining high-quality rare variant imputation and a score-based regression approach that stabilized measures of effect size and standard error estimates across individual studies. Without this strategy, it is unlikely that rare variant associations could have been examined in small datasets due to wide variability in effect betas and standard errors, which would not be distinguishable from other sources of heterogeneity between studies. Regarding the decision to not include UKBB in our IGAP discovery analyses, our secondary analysis of UKBB showed that while combining IGAP and UKBB may have identified additional AD GWAS loci, it may have also led to discovery-level significance (P<10−5) of risk variants for other dementia causes being potentially misreported as AD susceptibility loci if those loci have strong effects in UKBB alone. Those loci might yield valuable insights into AD pathogenesis, but would require additional scrutiny with pleiotropy analyses and functional genomics studies to confirm that their roles in neurodegeneration are important to AD.
Methods
Variant- and sample-level quality control (QC) on Stage 1 IGAP data
Standard QC was performed on individual IGAP datasets using PLINK v1.980–82 and including filtering and re-estimating all quality metrics after excluding variants with a missingness rate of >10% of genotype calls. QC filters included exclusions on SNPs with call rates below 98% for Illumina and 95% for Affymetrix panels; SNPs with departure from Hardy-Weinberg Equilibrium (HWE) of P<10−6 among cognitively normal elders (CNEs, either non-cases or controls) for variants of MAF>0.01; and SNPs with informative missingness by case-CNE status of P<10−6. Samples were dropped if the individual call rate was <95%; if X chromosome heterozygosity indicated inconsistency between predicted and reported sex; or if population substructure analyses (described below) indicated the sample did not cluster with 1000 Genomes Phase 3 populations of European ancestry. More details including differences in QC approach for EADB and UKBB are provided in the Methods section of the Supplemental Note.
Relatedness Checks in Stage 1 IGAP data
Relatedness was assessed using the “--genome” function of PLINK v1.9. Using ∼20,000 linkage disequilibrium (LD)-pruned SNPs sampled from among genotyped variants,  (the proportion of alleles shared IBD) was estimated across all pairs of subjects across all ADGC datasets. Among pairs of subjects with no known familial relationships, one sample was excluded among pairs with
  >0.95 if phenotype and covariate data matched, otherwise both samples were excluded; among all pairs with
  >0.4 but less than 0.95, one sample was kept giving preference to cases over CNEs, age (earlier age-at-onset among case pairs, later age-at-exam among CNE pairs). Pairs of relatives were dropped from family datasets if
  differed substantially from expectation based on their reported relationships.
Population substructure in Stage 1 IGAP data
To identify samples of non-European ancestry, we performed a principal components (PCs) analysis using ‘smartpca’ in EIGENSOFT83, 84 on the subset of ∼20,000 LD-pruned SNPs used for relatedness checks on genotypes from all samples within each individual dataset and from the 1000 Genomes Phase III reference panels. Subjects not clustering with European ancestry groups were excluded from analysis. To account for the effects of population substructure in our analysis, a second PC analysis was performed using only the remaining subjects in each dataset. PCs 1-10 were examined for association with AD case-control status and eigenvector loading, and only PCs showing nominal association with AD (P<0.05) and eigenvector loadings >3 were used in covariate adjustment for populations substructure, (average number of PCs used is 3; range: 2-4).
Imputation of Stage 1 IGAP data
For each dataset, SNPs not directly genotyped were imputed on the Michigan Imputation Server (MIS)85 using samples of all ancestries available on the Haplotype Reference Consortium (HRC) 1.1 reference panel86, which includes 39,235,157 SNPs observed on 64,976 haplotypes (from 32,488 subjects), all with an estimated minor allele count (MAC)≥5 and observed in samples from at least two separately-ascertained data sources. Phasing on the MIS was done with EAGLE87 while imputation was performed using Minimac385. Quality of imputation for all variants was assessed using R2 for imputation quality, although all variants were retained and not filtered prior to analysis. Following imputation and analysis, variants were filtered using two quality thresholds, a conservative R2≥0.8, suggested to assure high quality of rare variants with MAF≤0.01, and a more liberal R2≥0.3 to evaluate common variants (MAF>0.01). Analysis of SNP imputation quality by bin of MAF revealed that more than 80% of variants of MAF>0.0005 had R2≥0.8; among variants with MAF≤0.0005, approximately 50% of variants had R2≥0.8 in most datasets with n>1,000 subjects. Final Stage 1 (IGAP) analyses include only variants of R2≥0.8, using a global average of R2 across all datasets weighted by sample size, to minimize potential bias from differences in imputation quality across datasets, while imputation quality were relaxed to R2>0.4 for the same variants followed up in EADB and UKBB. Genotyped and imputed variants were all mapped to the mapped to the GRCh137/hg19 human genome build.
Single-variant Association Analysis and Meta-analysis for Common Variants (MAF>0.01)
Single variant-based association analysis on datasets of unrelated cases and CNEs were performed in SNPTEST88 using score-based logistic regression under an additive model with minimal covariate adjustment for PCs and study-specific indicator variables only. Additional analyses with adjustment for age (defined as age-at-onset for cases and age-at-last exam for CNEs), sex, and dosages of APOE ε4 (0/1/2 copies) and APOE ε2 were evaluated and we observed similar findings to those reported for the minimally adjusted model, however those results are not shown. Family-based datasets were analyzed using the GWAF89 package in R90 which implemented a generalized estimating equation (GEE) approach to account for correlation between subjects. After association analysis on imputed data, variants with regression coefficient of |β| > 5, negative standard errors, or P-values equal to 0 or 1 were excluded from further analysis. Within-study association results for common variants (MAF>0.01) were meta-analyzed using a fixed-effects approach with inverse variance-weighting and with genomic control using METAL91.
Single-variant Association Analysis and Meta-analysis for Rare Variants (MAF≤0.01)
Rare variant association and meta-analysis was performed for individual variants using the SeqMeta92 package in R90. SeqMeta performs a score-based logistic regression, estimating scores in individuals using ‘prepScores()’ and performing meta-analysis using ‘singleSNPMeta()’. Family-based datasets were analyzed by selecting a maximally informative subset of unrelated individuals for analysis, and no datasets with fewer than 100 cases and/or CNEs were analyzed (including the CSDC which demonstrated extreme association patterns and genomic inflation suggesting potential bias). As in common variant analyses, models evaluated included covariate adjustment for PCs. After meta-analysis of imputed rare variants, any SNPs with a regression coefficient of |β| > 5, negative standard errors, or P-values equal to 0 or 1 were excluded from further analysis.
MAGMA Gene-based Association and Pathway Analyses
We performed gene-based analyses and multiple pathway analyses of the IGAP GWAS using common variants (MAF>0.01) with MAGMA v1.0893. For gene-based analysis, MAGMA uses GWAS summary statistics to perform a SNP-wise analysis within a gene using either (a) the mean association statistic across all SNPs in a gene, denoted by “mean” in Supplementary Tables 12-14 and 16 or (b) a combination of the mean statistic and that of the most significant single SNP, denoted by “multi”. MAGMA uses a numerical integration procedure combined with simulation to produce an accurate P-value that corrects for LD structure between variants.
Pathway/gene-set analyses perform a joint test of association on multiple genes to determine strength of association with the phenotype of interest compared to the association of all other genes in the genome (a “competitive” analysis), correcting for LD between genes. The version of MAGMA used (v1.08) was recently updated to fix an elevated rate of false-positive associations observed in prior analyses94. Gene sets used in the analyses were from GO95, 96, KEGG97, 98, REACTOME99, 100, BIOCARTA101, and MGI102 pathways. Analyses examined 17,574 genes with 7,565,152 common variants (MAF>0.01), in two subsets of analyses: (a) using variants within the annotated 5’ and 3’ boundaries of the genes and (b) using a 35-kb upstream/10-kb downstream window around each gene to incorporate potential regulatory variants103. LD structure from MAGMA was determined using a combined ADGC reference panel using HRC imputation and genotype assignment (based on genotype probability from imputation exceeding 0.9) including data on 31,876 subjects and 8,299,079 variants. GO pathway analysis was restricted to GO terms containing between 10 and 2000 genes. No size restrictions were placed on the other gene sets, since there were many fewer of them. This resulted in a total of 10,042 gene sets for analysis. Multiple testing correction for the number of gene sets tested was applied by calculating Q-values using the R package ‘qvalue’104.
MAGMA Co-Expression Analysis
While pathway analyses examine gene sets defined by their shared role in known biological pathways, co-expression analyses examine gene sets (modules) defined by correlated expression patterns in the same or related tissues, on the grounds that such genes are likely to have similar biological functions. Here we analyzed co-expression data from multiple annotation sources to identify modules of co-expressed genes enriched for the current GWAS signals using an approach implemented in previous IGAP studies12, 42. We collated a large set of co-expression modules derived from brain tissue from the following studies: BRAINEAC105, the Common Mind Consortium106, Gandal et al. (2018)107, Gibbs et al. (2010)108, Neueder & Bates (2014)109, ROSMAP110, PsychENCODE111, and Zhang et al. (2013)112. Since immunity plays an important role in genetic susceptibility to AD, we also used WGCNA113 to derive co-expression modules from the monocyte gene expression data of Fairfax et al. (2014)114. A complete description of the datasets, along with the number and size of modules, is given in Supplementary Table 19. These modules were used as gene sets for testing enrichment of association signals with MAGMA v1.0893. To facilitate biological interpretation of modules showing statistically significant enrichment, annotations of the modules were performed using gProfiler115.
Gene-based Association Analysis of Rare Variants
We performed gene-based testing on rare variants (MAF≤0.01) using two approaches: (a) burden tests116, 117; and (b) SKAT-O118, which optimally combines the features of the sequence kernel association test (SKAT)119 and burden tests. SKAT testing pre-specified beta distribution weighting of β(1, 25) (“Wu weights”). As we examined variants with frequencies as low as MAF∼0.0008 in IGAP datasets of varying sample size, we used the meta-analytic framework of SeqMeta in R to perform gene-based testing across datasets to limit asymptotic effects on the estimation of betas and standard errors due to small cell sizes. Using subject-level scores in individuals previously estimated using ‘prepScores()’ for single variant analyses, we performed gene-based testing of 29,138,970 variants assigned to 22,650 genes with RefSeq120 release 85 using the ‘skatOmeta()’ argument for SKAT-O testing and ‘burdenMeta()’ for burden testing. Pre-analysis filtering of variants excluded variants at two imputation quality thresholds, R2>0.3 and R2>0.8, with gene-based analysis performed in parallel on variant sets at both thresholds. Post-analysis filtering of gene-based results excluded genes with fewer than two variants of MAF≤0.01, leaving a final set of 21,198 genes in the R2>0.3 analysis and 20,377 genes in the R2>0.8 analysis.
Gene-based Association Analysis of Rare Variants Using Predicted Deleteriousness
We further extended gene-based testing in SeqMeta/R by filtering on predicted deleteriousness using the Combined Annotation-Dependent Depletion (CADD)121 method. CADD122 systematically integrates multiple functional annotation metrics into the “C-score” to indicate predicted deleteriousness. We downloaded CADD C-score annotations (Development release v1.6) from the CADD server at the University of Washington for all ∼39.2M variants imputed by HRC and mapped these annotations to variants accordingly. After removing all variants of MAF>0.01 and variants of MAF≤0.01 to which no C-scores mapped, we applied imputation filters of R2>0.3 and R2>0.8 as before to generate two sets of variants, and then further filtered these into sets of variants with C≥5, C≥10, and C≥15 prior to gene-based testing. We used C≥15 as the highest threshold following CADD recommendations123 as this includes 5% of variants genome-wide and is the median C-score for all possible non-synonymous variants and canonical splice site changes. Following filtering on MAF, R2, and C-score, less than 25% of all genes in the R2>0.8/C≥10 and R2>0.8/C≥15 subsets had at least one variant, so the only subsets analyzed were R2>0.8/C≥5, R2>0.3/C≥10, R2>0.3/C≥15, and R2>0.8/C≥5.
Functional Genomics Follow-Up at Loci with GWS Associations
To explore potential functional effects at the newly associated variants identified in this analysis, we performed several follow-up analyses and functionality assessments on both individual variants and genes such as (1) chromatin interaction analyses using annotation in whole-body and brain-specific tissue and cell types; (2) chromatin accessibility analyses using chromosome conformation capture and ATAC-Seq methods; (3) expression pattern differences between brain/non-brain tissues and cell types from existing resources; (4) genetically-regulated expression patterns using inferred expression patterns through PrediXcan; and (5) effects of variation on alternate splicing and on populations of microglia subtypes in postmortem AD and cognitively normal brains.
PrediXcan and MultiXcan Analysis
These comprised two different analyses, a basic PrediXcan124 analysis examining individual tissues and a MultiXcan125 analysis aggregating expression across multiple tissue types. Tissue-specific genetic expression modules (GReX) in IGAP were imputed with publicly-available gene expression imputation models constructed in reference transcriptome datasets, including the whole blood model for DGN126, the dorsolateral prefrontal cortex (DLPFC) model from the CommonMind Consortium127, 128, and another 49 tissues models from the Genotype-Tissue Expression (GTEx) project (version v8)129. DGN and DLPFC models were trained using an elastic net approach, and the other models from GTEx v8 used multivariate adaptive shrinkage. S-PrediXcan was then run with summary statistics of qualifying GWS associations (R2>0.3 and MAF>0.01) with all 51 tissue-specific models described above and S-MultiXcan with two cross-tissue models, one model looking across all 49 GTEx tissues (“cross-all”) and one model looking across 13 GTEx brain tissues (“cross-brain”).
Gene-based Phenome-wide Association Study
To investigate phenotypes and traits with shared genetic components, we conducted a phenome-wide association study in the DNA biobank at Vanderbilt University (BioVU). BioVU has collected DNA samples from over 280,000 participants and linked genetic data for over 70,000 to their electronic health records. To identify gene-trait associations phenome-wide, we used PredixVU, a PrediXcan-based application which estimates genetically regulated expression based on each individual’s genotype data using GTEx v8 models in a subset of 23,000 genotyped BioVU individuals of European ancestry. ICD-9 (International Classification of Disease, 9th Edition) codes from electronic health records were mapped to phenotype codes (“PheCodes”), defining cases and control for a set of diseases and symptoms130, 131; a total of 1,514 PheCodes were included. Then, association between imputed expression and PheCode was calculated.
All genes identified from single-variant and gene-based common and rare variant analyses were tested to characterize traits associated with their imputed expression in the electronic health records linked to BioVU samples. To identify traits with shared expression architecture, we first tallied significant (P<0.05) PredixVU association results for each trait with the selected genes. To obtain the P-value for each phenotype, we created an empirical distribution for each trait by first identifying the subset of selected genes expressed in a given tissue and then randomly selecting the same number of genes and assessing the number of genes in the random set that were associated with each trait in PredixVU. The process was repeated 100,000 times to create a null distribution, and the empirical P-value was estimated based on this permutation procedure. We performed a Bonferroni correction for 1,514 PheCodes, making the significance level P<3.3×10⁻⁵ for determining selected gene enrichment in GReX-trait association.
Chromatin Interaction and Regulatory Variant Modeling Database Interrogation
To determine whether variants of interest may be involved in physical interactions with elements such as enhancers, insulators, or promoters, we applied HIPPIE248 to high-throughput chromosome conformation capture (Hi-C) data from six human cell lines (GM12878, IMR90, K562, HMEC, HUVEC, NHEK) with matched Encyclopedia of DNA Elements (ENCODE) project132, 133 and Roadmap Epigenomics Project47 functional genomic data to infer physically-interacting regions (PIRs). We examined the chromosomal region ±50kb flanking the variant to identify a potential enhancer/promoter interaction pair. We also explored chromatin interactions using the high-resolution (1 kb) haploid and diploid three-dimensional (3D) genome maps constructed by Rao and colleagues134 using Hi-C to characterize chromatin ‘loop anchors’, stretches of sequence motifs that typically bind to the CTCF protein in a paired fashion at the ends of a chromatin loop. To determine potential regulatory effects of variants of interest, we looked at enhancer mapping from ChromHMM135, which integrates epigenomic states measured through chromatin immunoprecipitation and sequencing (ChIP-Seq) of histone modifications to mark active enhancers136, 137 using 127 tissues and cell types from ENCODE and Roadmap data.
Examining Chromatin Accessibility and Looping using high resolution promoter-focused Capture C and ATAC-Seq
To examine chromatin looping and accessibility at the variants of interest, we queried our ATAC-Seq (Assay for Transposase-Accessible Chromatin using Sequencing) and high-resolution Capture C database comprising multiple cell types and conditions. Our Capture C library design utilizes custom Agilent SureSelect capture baits targeting both ends of DpnII restriction fragments (mean size ∼450bp) encompassing promoters (including alternative promoters) of all human coding genes, noncoding RNA, antisense RNA, snRNA, miRNA, snoRNA, and lincRNA transcripts, totaling 36,691 RNA baited fragments. Protocols for ATAC-Seq and Capture C have been described previously138.
We also investigated putative active promoters-enhancer interactions in epigenomic data from multiple brain cell types from the Nott et al. (2019)49 study. This dataset comprises ATAC-Seq, H3K4me3 and H3K27ac for neurons, astrocytes, microglia and oligodendrocytes from human brain biopsies, as well as cell specific-enhancers and chromatin looping data (PLAC-Seq) from microglia, neurons and oligodendrocytes.
Candidate Gene Expression Patterns across Tissue Types
We queried two publicly available databases for expression information on genes of interest, BioGPS139 and Brain RNA-Seq140. BioGPS45, an online portal which combines extensive gene annotation resources to provide comprehensive information on genes of interest, includes expression data from a multitude of sources including multi-tissue reference expression patterns from the Gene Atlas data sets141, mouse brain expression in the Allen Brain Atlas142, multiple expression quantitative trait loci studies143 among others. Brain RNA-Seq144, 145 is an on-line a transcriptomics database with single-cell RNA-Seq data on multiple cell types including neurons, astrocytes, oligodendrocyte precursor cells, newly formed oligodendrocytes, myelinating oligodendrocytes, microglia, endothelial cells, and pericytes from mouse and human brains.
Examining effects of candidate variants on microglia subpopulations in postmortem brains
We examined the effects of variants of interest on levels of microglia subpopulations originally identified using single-nucleus RNA sequencing applied to postmortem human brains from individuals with varied neuropathology and varied APOE and TREM2 genotypes. This approach identified a subpopulation of CD163-positive microglia responsive to amyloid deposition that were significantly attenuated in individuals carrying APOE and TREM2 risk haplotypes/genotypes46.
Data Availability
Summary statistics will be made available upon publication. Original genotype and phenotype data may be made available upon request through study principal investigators and/or controlled-access genetics data repositories- see individual dataset descriptions for additional details. All the data used in the gene prioritization are publically available: GTEx pipeline: https://github.com/broadinstitute/gtex-pipeline GTEx v8 eQTL and sQTL catalogues: https://www.gtexportal.org/ GTEx v8 expression and splicing prediction models: http://predictdb.org/
Author Contributions
(Currently under revision)
Competing Interests Statement
(Currently under revision)
Acknowledgements
(Currently under revision)
Footnotes
REFERENCES
- 1.↵
- 2.↵
- 3.↵
- 4.
- 5.
- 6.
- 7.
- 8.
- 9.
- 10.
- 11.↵
- 12.↵
- 13.↵
- 14.
- 15.
- 16.↵
- 17.↵
- 18.
- 19.
- 20.
- 21.
- 22.
- 23.↵
- 24.↵
- 25.↵
- 26.↵
- 27.↵
- 28.↵
- 29.↵
- 30.↵
- 31.
- 32.↵
- 33.↵
- 34.↵
- 35.↵
- 36.↵
- 37.↵
- 38.↵
- 39.
- 40.↵
- 41.↵
- 42.↵
- 43.↵
- 44.↵
- 45.↵
- 46.↵
- 47.↵
- 48.↵
- 49.↵
- 50.↵
- 51.↵
- 52.↵
- 53.↵
- 54.↵
- 55.↵
- 56.↵
- 57.↵
- 58.↵
- 59.↵
- 60.↵
- 61.↵
- 62.↵
- 63.↵
- 64.↵
- 65.↵
- 66.↵
- 67.↵
- 68.↵
- 69.↵
- 70.↵
- 71.↵
- 72.
- 73.↵
- 74.↵
- 75.↵
- 76.↵
- 77.↵
- 78.↵
- 79.↵
- 80.↵
- 81.
- 82.↵
- 83.↵
- 84.↵
- 85.↵
- 86.↵
- 87.↵
- 88.↵
- 89.↵
- 90.↵
- 91.↵
- 92.↵
- 93.↵
- 94.↵
- 95.↵
- 96.↵
- 97.↵
- 98.↵
- 99.↵
- 100.↵
- 101.↵
- 102.↵
- 103.↵
- 104.↵
- 105.↵
- 106.↵
- 107.↵
- 108.↵
- 109.↵
- 110.↵
- 111.↵
- 112.↵
- 113.↵
- 114.↵
- 115.↵
- 116.↵
- 117.↵
- 118.↵
- 119.↵
- 120.↵
- 121.↵
- 122.↵
- 123.↵
- 124.↵
- 125.↵
- 126.↵
- 127.↵
- 128.↵
- 129.↵
- 130.↵
- 131.↵
- 132.↵
- 133.↵
- 134.↵
- 135.↵
- 136.↵
- 137.↵
- 138.↵
- 139.↵
- 140.↵
- 141.↵
- 142.↵
- 143.↵
- 144.↵
- 145.↵


