
ABSTRACT
Non-invasive Gamma ENtrainment Using Sensory stimulation (GENUS) at 40Hz reduced Alzheimer’s disease (AD) pathology such as amyloid and tau levels, prevented cerebral atrophy and improved performance during behavioral testing in mouse models of AD. We report data from a randomized, placebo-controlled trial (n = 15) in volunteers with probable mild AD after 4 months of one-hour daily 40Hz sensory stimulation (NCT NCT04055376) to assess safety, compliance, entrainment and possible effects on brain structure, function, sleep activity and cognitive function. 40Hz light and sound GENUS was well-tolerated and compliance was high in both groups. Electroencephalography recordings show that our novel 40Hz GENUS device safely and effectively induced 40Hz entrainment in participants with mild AD. After 3 months of daily stimulation, the 40Hz GENUS group showed reduced ventricular dilation and stabilization of the hippocampal size compared to the control group. Functional connectivity was found to improve in the default mode network as well as with the medial visual network after 3 months of stimulation. Furthermore, actigraphy recordings show that circadian rhythmicity also improved with 40Hz stimulation. Compared to controls, the active group performed better on the face-name association delayed recall test. These results suggest that 40Hz GENUS can be used safely at home daily and shows favorable outcomes on cognitive function, structure and functional MRI biomarkers of AD-related degeneration. These results support further evaluation of GENUS in larger and longer clinical trials to evaluate its potential as a novel disease modifying therapeutic for Alzheimer’s dementia.
ONE SENTENCE SUMMARY 40Hz sensory stimulation can safely and efficiently induce entrainment of neural oscillations in patients with mild probable Alzheimer’s disease and may be a novel therapeutic that can prevent brain atrophy while improving functional connectivity, sleep and cognition.
INTRODUCTION
Alzheimer’s disease (AD) is a multi-faceted neurodegenerative disorder characterized by excessive accumulation of amyloid-beta and phosphorylated tau tangles as major pathological features (1). In addition to molecular pathology, disruptions in neuronal network oscillations are observed in AD (2–5). For example, gamma band (30-80 Hz) oscillations, which are related to cognitive functions such as attention and memory (6–8) are altered both in human patients with AD (9–14) and mouse models of the disease (15–17). Increasing gamma band oscillations through genetic modifications or optogenetic stimulation can reduce amyloid levels and improve memory in AD model mice (15,18,19). However, the relationship between AD pathology and disrupted gamma band oscillations is not yet fully elucidated.
Recently, we discovered that entraining gamma frequency oscillations non-invasively using a light flickering at 40 Hz reduced amyloid load and induced glial response in the visual cortex of AD model mice, effectively attenuating AD-related pathology (17). Furthermore, gamma frequency oscillations were entrained across multiple brain regions beyond the visual cortex and preserved neuronal as well as synaptic densities across the brain areas that showed entrainment; mice also showed and improved cognitive performance (20). In another study, we found that auditory stimulation using trains of tones repeating at 40 Hz can induce gamma frequency neural activity and ameliorate pathology and combined 40 Hz visual and auditory stimulation produces enhanced beneficial effects in AD model mice (21). These studies suggest that entraining gamma frequency oscillations using sensory stimulation (i.e., Gamma ENtrainment Using Sensory stimuli or GENUS) can effectively ameliorate pathology and improve cognition in these mouse models and suggests that it is worth pursuing as a therapeutic avenue for the treatment of AD. Given the non-invasive nature of GENUS, we translated this technology for use in humans. We hypothesize that inducing 40Hz entrainment in patients with probable mild AD dementia may modify pathophysiology related to neurodegeneration, leading to improved memory and function.
Previous studies investigating the use of sensory stimulation to induce entrainment showed that 40Hz auditory stimuli created the highest response as measured by electroencephalography (EEG) and increased regional cerebral blood flow in healthy participants (22). Other neuromodulation modalities such as transcranial alternative current (TACS) have also been used to induce 40Hz oscillations to improve abstract reasoning, working memory and insight in cognitively normal people (23–25). Taken together with data from using different gamma frequencies in mouse models of AD, we concluded that 40Hz was the optimal frequency to evaluate whether induced gamma entrainment can be applied prevent neurodegeneration and improve cognition.
We report here two studies of 40Hz combined visual and auditory GENUS: (i) testing target engagement in cognitively normal adults and patients with mild AD dementia and (ii) a single-blinded, randomized, placebo-controlled trial testing the safety and efficacy of 40Hz GENUS in patients with mild probable AD dementia. The main objective of this paper is to report on the feasibility and safety of daily, at-home light and sound GENUS in this population, and target engagement (40Hz entrainment) in cognitively normal adults and patients with AD dementia. The secondary objectives were to explore the effects of daily GENUS on cognition, sleep, and AD biomarkers including structural and functional MRI.
RESULTS
GENUS development occurred in two phases: (i) an initial safety and feasibility study to optimize entrainment during stimulation with our light and sound device and (ii) a single-blinded, randomized, sham-controlled trial to evaluate for safety of daily stimulation, compliance of usage and exploratory measures to see if pathophysiology related to neurodegeneration can be modified using 40Hz GENUS (demographics described in Table 1 and 2).
Demographics and Baseline Clinical Characteristics of Acute Stimulation Subjects
Adverse Events of Acute and Longitudinal GENUS Stimulation in Participants
Optimization of GENUS for safety and induced entrainment
To assess entrainment of neural oscillations by 40 Hz visual, auditory or synchronized visual and auditory stimulation and to assess for safety, we exposed cognitively normal adults and patients with mild AD dementia to 40 Hz while recording their scalp EEG (Table 1, Fig. 1). The 40Hz GENUS device is comprised of a 2 feet × 2 feet light panel, speaker and tablet that is programmable to deliver light or sound alone at 40Hz, synchronized light and sound at 40Hz and control settings with constant light with or without white noise. In all groups, GENUS with synchronized light and sound at 40Hz significantly increased the 40 Hz power spectral density (PSD) from the mock-stimulation level (constant light and white noise) at both the frontal and the occipital electrode sites, engaging brain regions not responding to visual or auditory stimulation alone (Figure 1A and 1B). The median change in the 40 Hz PSD at the frontal electrode site was 7.71 dB (range, 0.68 to 16.88; p < 0.001) for the cognitively normal young group, 7.22 dB (range, 0.79 to 13.10; p = 0.002) for the cognitively normal older group, and 5.82 dB (range, −0.02 to 10.51; p < 0.001) for the mild AD group; the median change in the 40 Hz PSD at the occipital site was 7.74 dB (range, 3.51 to 19.45; p < 0.001) for the cognitively normal young group, 7.95 dB (range, 1.18 to 14.70; p = 0.002) for the cognitively normal older group, and 7.68 dB (range, 4.23 to 18.26; p < 0.001) for the mild AD group. The increases in 40 Hz PSD were accompanied by significant increases in 40 Hz coherence (Figure S1A, B, C and Table S2), indicating that the combined stimulation induced synchronized 40 Hz neural oscillations across multiple electrode sites in cognitively normal participants and patients with mild AD dementia.

(A) Scalp EEG power spectral density (PSD) at the frontal (Fz, F3, F4, F7, F8) and the occipital (Oz, O1, O2) electrode sites, in cognitively normal young subjects (n = 13; top row), cognitively normal older subjects (n = 12; middle row), and patients with mild AD (n = 16; bottom row). Solid lines, group median; shaded areas, 95% confidence interval; blue, no stimulation; red, 40 Hz combined stimulation. Peaks at 60 Hz are from electrical line noise.
(B) Topographic maps showing the median change in 40 Hz PSD from the no-stimulation level with 40 Hz visual alone, 40 Hz auditory alone, and 40 Hz combined stimulation, in cognitively normal young subjects (n = 13; top row), cognitively normal older subjects (n = 12; middle row), and patients with mild AD (n = 16; bottom row). Filled circles represent scalp electrodes at which the increase in 40 Hz PSD from the no-stimulation level was significant (p < 0.05, Wilcoxon’s sign rank test, Bonferroni corrected for 32 electrodes).
(C) Example coronal MRI images before electrode implantation (top row) and intracranial EEG power spectral density (PSD; bottom row) from a single patient with medically intractable epilepsy (Patient 483), for depth electrode contacts placed in the gyrus rectus, amygdala, anterior hippocampus, and posterior insula. Red plus sign, approximate location of the depth electrode contact; blue, no stimulation; red, 40 Hz combined stimulation. For the PSD between 58 Hz and 62 Hz, interpolated values are plotted, because bandstop filtering around 60 Hz during signal preprocessing (for line noise removal) led to a large dip in the PSD around 60 Hz.
We also assessed the effects of 40Hz GENUS light and sound in patients with epilepsy who had implanted intracranial EEG leads for epilepsy surgical planning purposes to evaluate for target engagement with the brain during stimulation. Intracranial EEG shows that 40 Hz light and sound GENUS entrains deeper regions of the brain, including the gyrus rectus, amygdala, hippocampus, insula as well as in more superficial areas such as frontal and temporal gyri (Fig. 1C and Figure S2A, B). The largest increases in 40 Hz PSD were detected in the insula and the superior temporal cortex, which have been shown to be involved in multi-sensory integration (26,27). Across subcortical and deep cortical regions, there was an overall increase in 40 Hz PSD during the combined stimulation compared to the no-stimulation period (median [range] change in the 40 Hz PSD from the no-stimulation level: 4.58 dB [-1.22 to 23.27] in Patient 483; 0.77 dB [-1.95 to 6.44] in Patient 493), with the increase in 40 Hz PSD appearing at the majority of the electrode contacts (Figure S2A; 75/78 contacts in Patient 483; 10/15 contacts in Patient 493). Additionally, the combined stimulation led to an increase in 40 Hz coherence not only between nearby electrode contacts but also between deep and superficial electrode contacts (Figure S2C, D), suggesting that the stimulation led to synchronized 40 Hz oscillations across deep and superficial brain areas, including those beyond primary sensory areas. GENUS was well tolerated by all subjects with no significant adverse effects as evaluated by adverse effects questionnaire (Table 2).
Longitudinal Study Design
We conducted a longitudinal, randomized, placebo-controlled study was conducted to evaluate whether it is safe for participants with probable mild AD dementia to use GENUS chronically and whether they can be compliant with usage of our device. Participants with mild probable AD were recruited and randomized into control and active arms (Table 3; n = 7, n = 8, respectively; see Methods and Supplement for full details). Both groups were given the same light and sound devices described above with a programmable light panel, speaker and tablet delivering the same light and sound level. The control device delivered constant white light and white noise while the active device delivered 40Hz synchronized light and sound. The device was used by participants at home for 1 hour daily. Compliance was measured using a built-in timestamp indicating when the device was on and through pictures taken of the participant every 5 seconds when the device was turned on. Participants were evaluated with EEG for entrainment, both structural and functional magnetic resonance imaging (MRI) of the brain, cognitive assessments at baseline and after 3 months of at-home stimulation. Actigraphy watches worn by participants constantly through the study period recorded sleep and activity and safety was assessed with EEG at baseline and 3 months and weekly phone calls to assess safety with an adverse effects questionnaire. The participants continued to use the GENUS devices at home daily and compliance, actigraphy and safety was assessed as described until the end of the planned trial at 9 months. The study had another clinical assessment (EEG, MRI, cognitive battery) at 9 months, but due to the COVID-19 pandemic, this visit was not possible. Cognitive assessment was done virtually at 9 months but not reported here, since the testing modality was different than that used in the earlier time points.
Demographics and Clinical Characteristics of Longitudinal Stimulation Subjects Diagnosed with Probable Mild Alzheimer’s Disease
A total of 87 patients with probable mild AD dementia were screened, of whom 15 declined to participate and 57 were excluded as they did not meet study criteria (see Methods for inclusion/exclusion criteria). Fifteen participants were enrolled in the longitudinal study, of whom 8 completed the active arm and 7 completed the control arm. Patient characteristics including age, sex, APOE status, cognitive scores were similar across the two trial groups except for years of education where the control group had significantly fewer years of education compared to the active group (Table 3; p = 0.01). However, education was not significantly correlated with any outcome variables of interest, reducing concern that differences in education might be a confounding factor.
Safety and Compliance of Usage
Safety was assessed with EEG during stimulation with the GENUS device at baseline and after 3 months to monitor for epileptiform discharges and through weekly phone calls with participants. 40Hz GENUS was well-tolerated by all participants with no significant adverse effects (Table 2). Compliance was measured using timestamp recordings built into the device to indicate when the device was on and also with photographic records of participants as they are using the device. After 4 months of daily stimulation, there was no significant difference in compliance of usage between the groups – mean usage was 91.04% ± 6.84% and 86.81% ± 9.43% for the control and active groups, respectively. Both the control and active groups used their devices at home for an hour daily equally (p = 0.355).
The GENUS group showed less brain atrophy and stronger functional connectivity at 3 months
Cerebral atrophy occurs in the natural progression of AD and ventricular enlargement can be seen in the course of this atrophy. Using structural MRI, we found a significant difference in ventricular enlargement between the control and active group following 3 months of GENUS (p = 0.024) (Fig. 2A and 2B, Table S5). Analysis of change in total ventricular size from baseline to month 3 indicates that the control group exhibited ventricular enlargement (4.34+/-1.72%, p = 0.0016). In contrast, the active group did not have a significant change in ventricular volume (1.33+/-2.33%). Hippocampal (HPC) volume was also preserved after 3 months of 40 Hz GENUS as compared to the control group which showed decreases in volume (Fig. 2C; Table S5; left, right and bilateral HPC volume (n = 13, p = 0.076, 0.047, 0.034, respectively).

(A) Visualization of PVVC of example control subject from baseline to 3-months
(B) Group-level analysis of PVVC (n = 13, p = 0.024)
(C) Group-level analysis of control vs active HPC volume compared to 0 (n = 13, control p = 0.034, active p = 0.4384)
(D) Seed-to-Voxel analysis of PCC-FC in control group from baseline to 3-months (See Table S3)
(E) Seed-to-voxel analysis of PCC-FC for between group comparisons from baseline to 3-months (n = 12, p < 0.05 FEW-corrected)
(F) Group-level analysis of changes in mean functional connectivity of the MVN from baseline to 3-months. (n = 12, p = 0.004)
(G) Functional Connectivity in the medial visual network among E4 carriers is lower compared to E3/3 at baseline. N = 4 (E3/3), N = 7 (E3/4). p = 0.013 Data plotted as Tukey Min-Max, Line at Median
(H) Comparison of ApoE4 carriers to E3/3 in response to 3 months of 40Hz stimulation (E3/3 control vs active, p = 0.051; E3/4 control vs active, p = 0.065)
FP: Frontal Pole
MVN: Medial Visual Network
PCC-FC: Posterior Cingulate Cortex functional connectivity
PVVC: Percent Ventricular Volume Change
To evaluate whether neural networks were altered by 40Hz GENUS, we used functional MRI to probe circuits important for memory and sensory processing, including the default mode network (DMN) and medial visual network (MVN), respectively. A seed-to- voxel analysis of the posterior cingulate cortex (PCC), a major hub of the DMN, show that the control group experienced significant loss of functional connectivity between the PCC and bilateral frontal pole, bilateral lateral occipital, and mid frontal gyrus as compared to the active group (Fig. 2D and 2E, p<0.05, FWE-corrected). Additionally, the control group also observed loss in functional connectivity between the PCC and the posterior right supramarginal gyrus, left angular gyrus, inferior right frontal gyrus, and superior right frontal gyrus (Table S3). Similar analysis of the PCC in the active group showed no significant loss of functional connectivity between the PCC and other clusters in the brain. Finally, between-group comparison showed that the active group showed significantly less loss of functional connectivity between the PCC and the bilateral frontal poles in comparison to the control group (Fig. 2E, Table S3).
Seed-to-voxel analysis of the visual network indicated that the active group showed a significant increase in mean functional connectivity of the MVN after three months of GENUS (Fig. 2F; 0.14+/-0.07, p = 0.009). The control group did not show a significant change in mean functional connectivity (−0.11+/-0.14). No difference was observed in baseline values (Table S4). When the functional connectivity was analyzed with the hippocampus as the seed region, the active group had a significant increase in functional connectivity between the left and the visual cortex while the control group did not (Table S3, P<0.05, FWE-corrected).
The GENUS group showed improved sleep markers
The study was not statistically powered to detect differences in most of the variables tested. Therefore, we report statistical trends in this section, in addition to statistically significant differences.
There were no differences at baseline between active and control groups in two non-parametric metrics used to evaluate circadian rhythmicity and fragmentation, Interdaily Stability (IS) and Intradaily Variability (IV), respectively. Relative to their own unique values at baseline, the control group showed significantly reduced IS at Month 4 (M4), but not Month 3 (M3), while the active group showed a trend in higher IS at M3 and M4 (control, p = 0.312 (M3), 0.011 (M4); active, 0.065 (M3), 0.085 (M4)) (Fig. S3A). There were no differences in IV in either group at any timepoint (Fig. S3B).
Because IS and IV are fixed values between 0:1, and 0:2, respectively, we considered the linear subtraction of these values, each timepoint minus baseline for each subject. The active group had improved IS over the first four months and significantly improved IS compared to control group at M3 and M4 (active mean 0.074, control mean −0.055, p = 0.032, interaction p = 0.018 with Sidak’s multiple comparisons at M3 p = 0.049 and M4 p = 0.004) (Figure 3B). The IV of the active group does not change from baseline, while the IV of the control group worsens, although not significantly (active mean −0.029, control mean +0.10, p = 0.2182) (Fig. S3C).
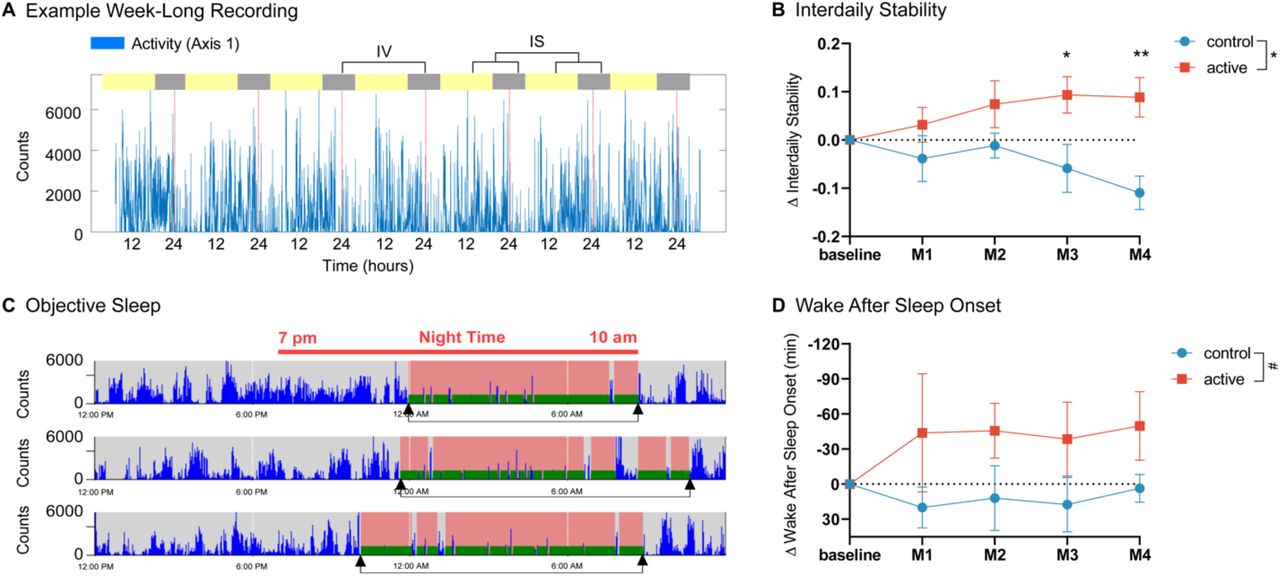
(A) Example 7-day activity recording of activity counts (blue) with dotted lines every 24 hours (red).
(B) Improved Interdaily Stability compared to baseline in active group (red) but not control group (blue) and significant differences between active and control groups at M3 and M4
(C) Example Objective Sleep Recording from same subject with activity counts (blue) and detected sleep periods (pink with green bottom) between 7 pm and 10 am (red bar), cumulative nights denoted by arrows (black) from Actilife software
(D) Trend in reduced Wake After Sleep Onset compared to baseline in active group versus control group, in minutes. all Error bars: +-SEM
Compared to baseline, the active group showed a trend in reduced Wake After Sleep Onset (WASO, min) (active mean −44.5, control mean 13.2, p = 0.086) (Figure 3D). Control participants had a trend towards more total sleep time (TST: active mean 391, range: 210 to 516 minutes control mean 532, range: 453 to 582 minutes, p = 0.067) with fewer, but not significant, number of nighttime awakenings in the active group (active mean 13.7, control mean 19.1, p = 0.19) (Fig S4A, B). During the nighttime hours between 10 pm and 6 am, the active group showed a trend in reduced activity counts compared to their baseline (active mean −50.1, control mean +79.8, p = 0.195) with the active group at M4 trending towards different from no-change p = 0.11 (Fig. S4C).
Post-hoc analysis revealed relationships among improvements in IS (M3) and imaging data (Fig. S5) and cognitive measures (Fig. S6). There was a significant association between improved IS and change in functional connectivity of the medial visual network, R2 = 0.43, p = 0.028) as well as between PCC to Frontoparietal (Left), R2 = 0.4, p = 0.036 (Fig. S5A, B). Change in IS was also associated with improvement in cognition: Alzheimer’s Disease Assessment Scale, R2 = 0.74, p = 0.001, Number Span Forward R2 = 0.47, p = 0.021, Number Span Forward Length R2 = 0.42, p = 0.036 and reached near significance with Montreal Cognitive Assessment R2 = 0.3, p = 0.078 (Fig. S6A-D).
The GENUS group showed improved associative memory at 3 months
Cognitive function was assessed at baseline and again during the three-month visit. One participant who was not able to attend both test sessions due to the COVID-19 pandemic was excluded from the analysis, leaving a total of 14 participants (active, n=8; control, n=6). After 3 months of daily 40Hz GENUS, there were no significant differences between groups in cognitive functioning as assessed using the MMSE (p = 0.536), MoCA (p = 0.198), ADAS-Cog (p = 0.237) or Global CDR (p = 0.792). Although between-group comparisons did not reach statistical significance, a trend was observed across neuropsychological tests at the three-month mark. The active group showed an improvement trend on average by 1.62, 0.50, and 1.75 points on the ADAS-Cog battery, MMSE and MoCA, respectively. Participants in the control group showed a trend in decline by an average of 0.28, 0.5 and 0.83 points on the ADAS-Cog battery, MMSE and MoCA, respectively. On the CDR sum of boxes, the mean score of control group was unchanged.
Associative memory tasks have been found to be especially sensitive in the early stages of AD (28–31). No significant changes in connectivity during encoding of the associative memory task were observed between baseline and after 3 months of stimulation in the fMRI portion of this protocol for either group. After three months of GENUS, the active group saw a significant improvement in the face-name association recall task performed outside of the MRI (Fig. 4A; 3.75+/-0.96 pts, p = 0.004) while no significant change was observed in the control group. Additionally, the change between the control and active group after 3 months of stimulation was significantly different (p = 0.027). Finally, the improvement in face-name association recall was significantly correlated with the change in mean functional connectivity of the medial visual network (Fig. 4B; R^2 = 0.52, p = 0.028).

(A) Group-level analysis of changes in face-name recall test from baseline to 3-months
(B) Correlation of change in face-name recall test score with change in mean functional connectivity of the MVN (MVN: Medial Visual Network)
GENUS group effects were present in mid AD regardless of APOE status
Population studies distinguish E4 carriers and homozygous E4 alleles as a major risk factor for developing sporadic AD (32). Even though we did not stratify or randomize by APOE status, there was no difference in the number of E3/3 and E3/4 genotypes between control and active groups in our study (chi-square 0.311, p = 0.577; Fig. S7). Notably, one member of the active group was unable to undergo blood draw and could not be genotyped. No members of our study were homozygous for the E4 allele.
At baseline, the functional connectivity with the medial visual network was significantly lower in the heterozygous E3/4 as compared to homozygous E3/3 (Fig. 2G). After 3 months of 40Hz GENUS, functional connectivity in the medial visual network improves in both the heterozygous E3/E4 and the homozygous E3/3 groups (Fig. 2H). This shows that heterozygous E3/4 individuals may respond to 40Hz GENUS as well as individuals with homozygous E3/3.
Heterozygous E3/4 carriers show greater improvement in actigraphy IS regardless of group but are no different than E3/3 among participants receiving daily 40 Hz stimulation (Sidak’s MC, p = 0.14). E3/4 carriers spend an hour more awake during the night than E3/3 at baseline, although not significant (p = 0.26). Despite these differences, E3/4 carriers receiving 40 Hz stimulation showed greater reduction in WASO from baseline than E3/3 (p = 0.19).
DISCUSSION
In AD mouse models, inducing gamma entrainment using 40 Hz sensory stimulation ameliorates pathology and improves cognition (17,20,21). In our optimization study, we demonstrated that 40Hz GENUS using synced light and sound can effectively induce gamma entrainment across multiple brain regions in cognitively normal individuals, patients with medically intractable epilepsy, and in patients with mild Alzheimer’s disease dementia. We also showed that the combined light and sound stimulation entrains both cortical and subcortical regions, including those that visual or auditory stimulation alone cannot entrain. 40Hz GENUS was safe, does not trigger epileptiform activity even in patients with epilepsy, and does not cause any severe adverse effects. In a single-blinded, placebo-controlled RCT in patients with mild AD dementia, we found that relative to the control group, the group that had daily usage of 40Hz GENUS over 3 months had less brain atrophy and reduced loss of functional connectivity, improved markers of sleep and improved performance in an associative memory. Overall, these findings suggest that 40Hz GENUS should be studied more extensively to evaluate its potential as a may be used as a disease-modifying intervention in AD.
Previously, we showed that chronic GENUS significantly reduced the expansion of ventricular size and ameliorated neuronal density loss in AD animal models (20). In this study, we observed that the active group did not show ventricular expansion nor hippocampal atrophy after 3-month of daily treatment while those in the control group experienced significant ventricular enlargement and hippocampal atrophy consistent with the natural progression of AD. Given that ventricular expansion and hippocampal atrophy correlate with cognitive function and clinical disease progression, this may indicate a slowing or delay in normal progression of the disease (33–35). However, given the well-established heterogeneity of rates of progression in AD dementia, it is also possible that the two groups would have shown these differences without the intervention. A within-participant cross-over design or a larger parallel-group design would be a logical next step to determine whether these results are robust and reproducible.
Resting-state fMRI has been used to examine functional brain network disruptions in AD that correlate with cognition (36,37). The network that shows the greatest amount of dysfunction in AD is the default mode network (DMN), which has been shown to exhibit hypoconnectivity in AD, mild cognitive impairment (MCI), and even those at high risk for AD, especially within its major hub – the PCC (38–40). This region has been shown to play a critical role in attention, internally-directed thought, and is connected with the medial temporal lobe system and correlated with memory encoding and recall (41–43). Consistent with changes seen in the DMN in the natural progression of AD (44–46), our control group had significant loss of connectivity between the PCC and several regions in the frontal cortex, as well as the angular gryus. While declines over such short durations have been previously reported, longer term follow up should provide further insight into the functional changes in the network.
We quantified the functional connectivity of the visual network was quantified due to our mode of intervention, even though it is not typically evaluated in resting-state fMRI studies in AD research. Our work in animal models showed the impact of GENUS on the oscillatory activity and amyloid deposition within the related sensory cortices, and the significantly greater EEG response to visual stimuli compared to auditory (17,21). Changes in functional connectivity in regions of the brain in AD patients have been shown to be heavily linked with amyloid deposition measured using PET biomarkers and cortical atrophy (Hampton, 2020, Myers, 2014). A significant increase in mean functional connectivity in the medial visual network following chronic GENUS may indicate an impact on AD pathology within the region. To further this hypothesis, this study also included analysis of a face-name association task, which required significant visual involvement, which has previously shown significant functional connectivity differences in AD and MCI versus control, as well as differences in post-scan testing (47). Additionally, very similar face-name association tasks have shown that successful recall of face-name pairs is heavily correlated with amyloid deposition (48). While other cognitive tasks such as the MOCA, MMSE, ADAS-Cog did not show significant changes over this short time period of 3 months, the improvement in the face-name association task may indicate that visually evoked memory may selectively improve due to 40Hz GENUS using visual and auditory modalities. Alternatively, this could be due to practice effects in the active intervention group or a more biologically aggressive form of AD in the sham group. Additionally, significant increases in the connectivity between the hippocampus and the visual cortex was observed in the active group which may underlie the improvement observed in this visual-based cognitive task.
Interestingly, the connectivity of the medial visual network is significantly lower at the baseline in the ApoE3/4 carriers compared to ApoE3/3 carriers. However, we observed that ApoE3/4 carriers showed similar increased medial visual network connectivity as the non-carriers after 3 months of 40Hz GENUS. These results though promising, should be interpreted with caution as the number of participants in each group is too low to be conclusive.
Prospective studies of circadian rhythms demonstrate reduced stability and increased fragmentation with age, these changes accelerate with diagnosis of MCI or AD and fasten the transition between the two (49). Critical biochemical and behavioral changes appear to work bi-directionally between sleep and neurodegeneration, although the precise temporal dynamics are unknown (50). In our study, 40 Hz GENUS increased day-to-day regularity of activity patterns (as quantified using Interdaily Stability, IS)) over four months, with significant improvements in the active compared to the control group by Month 3. These changes were also significantly associated with changes in functional connectivity and cognitive outcomes. There was also a trend to more consolidated and less fragmented sleep (quantified as decreased WASO), by nearly 45 minutes. Independent of their sleep, we also see a non-significant reduction in overall activity levels during the nighttime hours in the active group, a broad measure of reduced fragmentation. Our finding suggests 40 Hz stimulation can intervene with processes that ordinarily degrade in age and rapidly-so in AD and improvements correlate with cognitive and functional changes.
Little is known about the mechanisms relating gamma stimulation to circadian rhythms. One month of daily hour-long 40 Hz visual stimulation rescues central clock gene expression deficits present in AD mouse models, including CLOCK, BMAL1, and PER2, suggesting 40 Hz stimulation could directly impact the suprachiasmatic nucleus (the site of the circadian pacemaker in mammals) and underlying circadian rhythms (51). These genes are critical regulators of the circadian system and are posited to explain age and disease related patterns in activity levels. Sleep is also a crucial mediator of waste clearance including Aβ peptides, facilitated by glymphatic flow and it is hypothesized that changes to sleep architecture, increased nighttime disturbances and reduced REM sleep underlie the accumulation of harmful peptides in both prodromal and AD patients (52). Emerging evidence demonstrates CSF flow is mediated by astrocytic transport and that these processes are most prominent during sleep states (53,54). Improving individual’s rest-activity patterns and in turn, maintaining consolidated sleep may promote resilience to disease progression. Employing wearable devices to track progression using tangible markers like Interdaily Stability is particularly suited for this study population. Future trials are likewise to include biological markers, including melatonin measurements to measure the effect of light-treatment on circadian rhythms. In examining participant’s specific chronotypes, there is opportunity to personalize stimulation paradigms to optimize the effects on improving circadian rhythms.
Manipulation of neural oscillations to augment gamma entrainment using 40Hz GENUS was shown to broadly and robustly reduce AD pathology and improve cognition in AD mouse models. Our study is the first to show that 40Hz GENUS induced gamma entrainment can be done in patients with mild AD dementia, and may be associated with positive cognitive and biomarker outcomes, while recognizing the limitations of interpreting results from such a small sample. Our analyses used robust methodology to control for multiple comparisons and important cofounders. However, we must acknowledge some limitations to our study including our small sample size, which made it difficult to conclusively delineate contributions of ApoE4 on functional connectivity and sleep outcomes. In addition, while our intervention was continued at home for a full 9 months as planned, the COVID-19 pandemic interfered with data collection for MRI and EEG after 3 months of stimulation. Despite these limitations, our study supports the possibility that 40Hz GENUS should be studied in larger, longer RCTs in AD, including future studies investigating effects of 40Hz GENUS on amyloid and tau biomarkers of AD.
METHODS
Additional details of the methods are provided in the Supplemental Materials.
Study Design
We report results from initial safety, feasibility and optimization studies to evaluate induced entrainment in response to 40 Hz sensory stimulation performed at the Massachusetts Institute of Technology (MIT) and the University of Iowa and a longitudinal study designed to evaluate the effects of long-term 40 Hz stimulation in participants with mild AD, as described in the demographics below and in the Supplemental Materials in full. The study was registered on clinicaltrials.gov (NCT04042922). All studies were approved by the Committee on the Use of Humans as Experimental Participants (COUHES) at the MIT and the University of Iowa Institutional Review Board (IRB), respectively. These studies were carried out in accordance with the Code of Ethics of the World Medical Association (Declaration of Helsinki). All participants and their primary caregivers provided written informed consent before participation. The longitudinal study registered on clinicaltrials.gov was a single-blinded, randomized, placebo-controlled study in which participants were given stimulation devices used 1-hour daily at home over the course of 9 months (NCT04055376). The placebo group used devices delivering constant light and white noise while the active group used devices delivering synchronized combined light and sound stimulation at 40 Hz, both set at the same light and sound levels. Details on these devices can be found in the supplement. The primary outcome measures for this study was safety and compliance of usage. Safety was assessed with adverse effects questionnaires completed over weekly phone calls with staff and evaluations for aberrant ictal spikes in response to stimulation using electroencephalogram (EEG) at baseline and 3 months. Compliance was assessed using built-in time-stamp log of when the device is on or off. Exploratory outcomes included effects on cognition, structural changes and functional connectivity in the brain, and sleep. Participants underwent baseline assessments including a neuropsychiatric battery, EEG, magnetic resonance imaging (MRI) and blood collection for sequencing. Participants wore actigraphy watches throughout the study. Safety was assessed with weekly calls. The neuropsychiatric battery, EEG and MRI was repeated at month 3 however, due to the COVID-19 pandemic, EEG and MRI could not be performed after the 3-month timepoint. Here, we report results from the 3-month timepoint.
Participants
This study involved three cohorts of participants. The first cohort included three groups of volunteers who were recruited at the Massachusetts Institute of Technology (MIT): (1) cognitively normal adults between the ages of 18-35 (young group); (2) cognitively normal adults between the ages of 50-100 (older group); and (3) adults with a previous diagnosis of probable AD, between the ages of 50-100, with a Mini-Mental State Examination (MMSE) (55) score of 19-26 at screening (mild AD group). Main exclusion criteria were: (1) active treatment with N-methyl-D-aspartate (NMDA) receptor antagonist (e.g., memantine), anti-epileptic agent, or psychiatric agent (e.g., antidepressant, antipsychotic); and (2) history of seizure or stroke within 24 months prior to the study participation (full criteria listed in Table S1). Participants in the mild AD group were additionally assessed using the Montreal Cognitive Assessment (MoCA) (56) and the clinical dementia rating scale (CDR) (57). Participants in this cohort completed a brief cognitive assessment and then were recorded using scalp electroencephalogram (EEG) during single-(visual or auditory) and multi-sensory (synchronized visual and auditory) stimulation at 40 Hz.
The second cohort included neurosurgical patients with medically intractable epilepsy who were recruited at the University of Iowa Hospitals & Clinics. These patients were being admitted to the hospital for 7-14 days for invasive monitoring with intracranial electrodes to localize their seizure focus. An intracranial EEG monitoring plan was generated by the University of Iowa Comprehensive Epilepsy Program. Following intracranial electrode implantation surgery, patients remained in an electrically-shielded epilepsy monitoring room in the University of Iowa’s Clinical Research Unit. After the final surgical treatment plan was agreed upon between the clinical team and the patient, 1-2 days before the planned resection and after the patient had restarted anti-epileptic medications, the patient was recorded using intracranial EEG during single- and multi-sensory stimulation at 40 Hz.
The third cohort included patients who met the National Institute of Aging-Alzheimer’s Association and Diagnostic and Statistical Manual of Mental Disorders, Fifth Edition (DSM-5) clinical criteria for probable mild AD dementia were recruited at MIT. The diagnosis was confirmed by the investigator based on interviews with the patient and their caregiver along with neurological assessments as part of the study. These patients were between the ages of 50-100 and had the MMSE score between 19-26 at screening. Main exclusion criteria were: (1) MMSE[17,21] score outside the range of 19-26 at screening; (2) history of seizure; and (3) refusal to participate in the study protocol at screening (full criteria listed in Table S1).
Participants enrolled in the longitudinal study were patients with probable mild AD dementia with the same criteria described above.
Evaluation of induced entrainment
Scalp EEG Recording with sensory stimulation
Participants underwent EEG recording while receiving sensory stimulation which was delivered using a system composed of a white light emitting diode (LED) panel (2’×2’, natural white color, 3900-4000K) that was modified for flicker and brightness control (Neltner Labs) and a sound system (SB2920-C6, VIZIO, or LP-2024A+, Lepy connected to BRS40, BOSS). The LED panel and the speaker were controlled by a custom circuit board (Neltner Labs) that housed Teensy USB Development Board (version 3.6, PJRC). Participants were seated five feet from the device during the EEG recording. Each participant was exposed to three 40 Hz stimulation conditions (visual, auditory, and combined) and three non-40 Hz conditions (visual, auditory, and combined), with each condition lasting for about 3 minutes (for cognitively normal participants) or 1 minute (for patients with mild AD). For the combined stimulation conditions, auditory and visual pulses were temporally aligned at their onset.
Scalp EEG was recorded throughout the stimulation experiments using an ActiveTwo system (Biosemi), with 32 scalp electrodes arranged according to the international 10-20 system. Electrooculogram (EOG) electrodes were used to monitor eye blinks and lateral eye movements, with one EOG electrode placed near the infraorbital ridge of the left eye and another electrode placed near the lateral canthus of the right eye. Two additional electrodes were placed over the mastoids bilaterally. The magnitude of the offset value was kept below 40 mV for each electrode. EEG signals were recorded with a low-pass hardware filter with a half-power cutoff at 104 Hz and then digitized at 512 Hz with 24 bits of resolution. The data were saved to a computer along with the “trigger events” that were manually inserted during the experiment to denote the start and finish of each stimulation period.
Intracranial EEG Recording with sensory stimulation
After the final surgical treatment plan was agreed upon between the clinical team and the patient, typically 1-2 days before the planned resection and after the patient had restarted anti-epileptic medications, participants underwent sensory stimulation. Each participant was exposed to three 40 Hz stimulation conditions (visual, auditory, and combined), with each condition lasting for about 1 minute. Intracranial EEG was recorded throughout the stimulation experiments using electrode arrays (Ad-Tech Medical Instrument) that included stereotactically-implanted depth electrodes (4-8 macro contacts per electrode, spaced 5-10 mm apart) and grid arrays (containing platinum-iridium disc contacts, with 2.3 mm exposed diameter, 5-10 mm inter-contact distance, embedded in a silicon membrane) placed on the cortical surface. A subgaleal electrode was used as a reference. Data acquisition was controlled by an ATLAS Neurophysiology system (NeuraLynx). Collected data were amplified, filtered (0.1-500 Hz bandpass), digitized at 2 kHz, and stored for subsequent offline analysis.
Detection of Epileptiform Discharges
All EEG recordings were reviewed for the presence of epileptiform discharges by an expert neurophysiologist blinded to the timing and the duration of the stimulation. For scalp EEG recordings, raw signals without any preprocessing were examined for epileptiform discharges. For intracranial EEG, due to strong line noise at 60 Hz, raw signals were bandstop filtered between 59 and 61 Hz and bandpass filtered between 0.1 and 100 Hz before examination.
MRI
For the Phase 2 study, MRI data was acquired using a 3-Tesla Siemens Tim Trio scanner (Siemens, Erlangen, Germany) paired with a 12-channel phased-array whole-head coil. Head motion was restrained with foam pillows. Sequences included 3D T1-weighted magnetization prepared rapid acquisition gradient echo (MP-RAGE) anatomical images, Functional T2-weighted images were acquired using a gradient-echo echo-planar pulse sequence sensitive to bold oxygenation level-dependent (BOLD) contrast (58,59) were acquired. To allow for T1-equilibration effects, 4 dummy volumes were discarded prior to acquisition. Functional resting data were acquired while the participant was instructed to rest with eyes open for a period of 5 minutes consisting of 120 volumes. Functional task data was recorded during the visual presentation of face-name stimuli described below for a total of 98 volumes per run. Online prospective acquisition correction (PACE) was applied to the EPI sequence. Structural MRI data was analyzed using FSL and Freesurfer. Functional MRI data was analyzed using CONNToolbox (60) and Statistical Parametric Mapping (SPM − https://www.fil.ion.ucl.ac.uk/spm/). Full MRI details can be found in the appendix.
Actigraphy
Sleep and Activity were assessed using an actigraphy device (ActiGraph Link GT9X+, Firmware 1.7.2, ActiGraph, Pensacola, FL) worn on the non-dominant wrist and worn continuously throughout the study. Five, 7-day recordings: the first 7-days after home installation of the stimulation device (baseline), 30 days and 60 days later (M1, M2), a median of 101 days, range: 85-109 (M3) aligned following their visit and 120 (±15 days) (M4) were used for analysis. We confirmed participants used the stimulation panel in at least 6 of the 7 days in which we analyzed their activity data, as referenced by their device log. Data were visually inspected to confirm availability and wear during these periods followed by Wear Time Validation preprocessing (ActiLife software version 6.13.4, ActiGraph, Pensacola, FL) using 90 minute non-wear threshold (61,62). Participants who had wear time below 60% of total recording length (n = 1) or an incomplete recording for any of the timepoint data collections (n = 3) were excluded from analysis. Data collected beginning in April 2020 and later was excluded because of the anticipated effects of the COVID-19 pandemic among our patient population.
Non-parametric analyses of actigraphy were used because of the statistical characteristics of activity counts (63,64). Our analysis used Y-axis acceleration data from the actigraph and compiled code from National Sleep Research Resource, (actiCircadian) implemented in MATLAB R2020a (Mathworks, Natick, MA). Individual days within a subject’s recording are excluded from this analysis if there were fewer than 10 hours of wear during daytime or more than 1 hour of non-wear in the major sleep period (9 pm to 7 am) as determined by the program. Interdaily stability (IS) was calculated as the ratio between the variance of the average 24-h pattern and the overall variance, a measure of circadian rhythmicity, higher values indicate more stability. Interdaily variability (IV) was calculated as the ratio between the mean square first derivative and the overall variance; it and quantifies fragmentation of rhythms, a lower value indicates fewer disruptions during the day.
Face-Name Association Task and Delayed Recall
The functional task consisted of viewing faces unfamiliar to study participants paired with fictional first names in a modified novel vs. repeated design as described in Sperling et al. (65). Each face-name pair was presented for 5 seconds followed by a 0.8 second period of fixation to a white, central crosshair. Participants viewed seven different face-name pairs per novel or repeated blocks. The repeated block consisted of alternation between two face-name pairs (one male, one female), while the novel condition consisted of new face-name pairs for each stimuli presentation across all runs. Up to six runs of the block design paradigm exhibited below were conducted for each participant. Participants were given explicit instructions to try to remember the name associated with each face.
Immediately following the imaging session, participants were tested on a subset of the face-name pairs. 14 pairs from the novel face-name sets presented were shown with two names listed below. Participants were asked to choose the name that had been presented with the face during the imaging session.A subset of participants was not able to complete the task due to the duration of the MRI session or missing scan during 3-month visit and were removed from this analysis. The total number of participants used in this analysis was 9 (Active n = 4, control n =5)
Neuropsychological testing
A comprehensive neuropsychological test battery was administered by the study neurologist at the initial visit (M0). Assessments included the Mini Mental State Exam (MMSE; (55)), Montreal Cognitive Assessment (MoCA; (56)) and the following measures from the National Alzheimer’s Coordination Center’s Uniform Data Set version 3.0 (66): Trail Making Test Part A (TMT-A, time in seconds); TMT Part B (TMT-B, time in seconds); Craft 21 Story Recall: Immediate (Story Recall Immediate, 44-item); Craft 21 Story Recall: Delayed (Story Recall Delayed, 44-item); Number Span Test Forwards (NST-F, longest span); Number Span Test Backwards (NST-B, longest span); Geriatric Depression Scale (GDS, 15-item); Functional Assessment Scale (FAS, 30-item); Neuropsychiatric Inventory Questionnaire (NPI-Q); and Clinical Dementia Rating (CDR). The Alzheimer’s Disease Assessment Scale-cognitive subscale (ADAS-Cog Total, 70 item) was also administered and sub-scores were calculated for word list immediate recall (ADAS-Cog Recall, 10-item) and delayed recognition (ADAS-Cog Recognition, 12-item; (67) A briefer assessment battery consisting of the MMSE, MoCA, ADAS-Cog, Number Span Test, TMT (A and B), CDR, NPI-Q, and GDS was completed at month 3 (median of 101 days, range: 85-109).
Sequencing
Genomic DNA was purified from approximately 5×10^6 peripheral white blood cells using a genomic DNA extraction kit (Qiagen, 69506). Extracted DNA was then submitted to Genewiz for SNP genotyping at rs429358.
Statistical Analysis
Group-level PSD and coherence results were expressed as the median across participants within each group. 95% confidence intervals for the median were obtained by bootstrapping across the participants 60,000 times with replacement. For comparisons between stimulation conditions or participant groups, if a condition or group was involved in more than one family-wise comparisons, the Friedman test (for paired comparisons) or the Kruskal-Wallis test (for unpaired comparisons), followed by Dunn’s multiple comparison test was used to calculate the p values. Otherwise, the Wilcoxon’s sign rank test (for paired comparisons) or the Mann-Whitney test (for unpaired comparisons) was used. For comparisons at multiple electrode sites or electrodes, the Bonferroni correction was applied by multiplying the p values by the number of electrode sites or electrodes. P values for categorical variables were calculated using Fisher’s exact test.
For actigraphy, we performed a 2-way ANOVA (Treatment Group × Time) with Sidak’s multiple comparisons to assess between or within group differences over time. Delta comparisons are the value at a given timepoint minus the Baseline value for any variable of interest. Comparison of this value to 0, or no change was used to assess if the stimulation protocol had a significant impact within each group.
A two-sided p value less than 0.05 was considered significant. Specific statistical tests and parameters are detailed in the figure legends. All statistical analyses were performed using MATLAB 2019b (MathWorks, Inc.) and GraphPad Prism 8.4 (GraphPad Software).
Funding
We are thankful to the following individuals and organizations for their support of the work: The JPB Foundation, Robert A. and Renee Belfer, Halis Family Foundation, the Eleanor Schwartz Charitable Foundation, the Degroof-VM Foundation, Gary Hua and Li Chen, Lester Gimpelson, the Ludwig Family Foundation, David B. Emmes, Elizabeth K. and Russell L. Siegelman, Joseph P. DiSabato and Nancy E. Sakamoto, Alan and Susan Patricof, Jay L. and Carroll D Miller, Donald A. and Glenda G. Mattes, Marc Haas Foundation, Alan Alda, and Dave Wargo. Dr. Chan received support from the NIH Loan Repayment Program, Picower Fellowship and the Harvard Catalyst KL2/Catalyst Medical Research Investigator Training (CMeRIT) Award.
Author contributions
Conceptualization: LHT, DC, HJS, BD, ENB, ESB
Methodology: DC, HJS, BJ, EBK, NPM, DS, SDB, SWG
Investigation: DC, HJS, BJ, NPM, DS, SDB, EK, VSFA, AB, BU, PG, MH, AB, EJS, ANC, SA, SWG
Visualization: DC, HJS, BJ, NPM, DS, EBK, EK, VSFA, AB, SWG, LHT
Funding acquisition: LHT
Project administration: DS
Supervision: LHT, DC
Writing – original draft: DC, HJS, BJ, NPM, DS, EBK, EK, VSFA
Writing – review & editing: DC, HJS, BJ, NPM, DS, EBK, EK, VSFA, BD, LHT
Competing interests
LHT is a scientific co-founder, SAB member and Board of Director of Cognito Therapeutics. ESB is a scientific co-founder, SAB member of Cognito Therapeutics.
Data and materials availability
All data are available in the main text or the supplementary materials.
Acknowledgments
We thank Emily Niederst for her careful reading, insight and comments on the paper.
REFERENCES


Subject Area
Reviews and Context
1
Comment
0
TRIP Peer Reviews
0
Community Reviews
0
Automated Services
3
Blogs/Media
Author Videos