
Abstract
Introduction During the first wave of COVID-19 it was hypothesized that COVID-19 is subject to multi-wave seasonality, such as other respiratory viral infections since time immemorial, including earlier respiratory pandemics. It has already been observed that the COVID-19 community outbreaks appear to have a similar pattern as other influenza like illnesses (ILI). One year into the pandemic, we aimed to test the seasonality hypothesis for COVID-19.
Methods We gather and calculated the average ILI annual time series based on incidence data from 2016 till 2019 in the Netherlands. And, compared this with two independent COVID-19 time series during 2020/2021 for the Netherlands, plotted on a logarithmic infection scale. We tested our hypothesis by calculating correlation coefficients and, as a sensitivity analysis, by performing univariate regression analysis.
Results The COVID-19 time series strongly and highly significantly correlates with the ILI time series r(45) = 0.75 (p < 0.00001) and (r(45) = 0.798, p < 0.00001). Also the univariate regression analyses that we performed as a sensitivity analysis are all highly significant: respectively F(1, 43) = 61.45, p < 0.0001, and F(1, 43) = 81.18, p < 0.0001 and the correlations (r2) are moderate to strong.
Conclusions Given the strong, and highly significant, correlations between the ILI and COVID-19 time series, we conclude that COVID-19 behaves as seasonal as ILI in a country in the temperate climate zone, such as the Netherlands. Moreover, the COVID-19 peaks are all during flu season, and lows are all in the opposing period as expected. Furthermore, the COVID-19 time series satisfies the two characteristics of earlier pandemics, namely a short first wave at the tail-end of a flu season, and a longer and more intense second wave during the subsequent flu season.
1. Introduction
During the first wave of COVID-19 it was hypothesized that COVID-19 is subject to multi-wave seasonality (Kissler et al., 2020; Grech et al., 2020), such as other respiratory viral infections since time immemorial (Moriyama et al., 2020), including earlier respiratory pandemics (Fox et al, 2017). It is observed that the COVID-19 community outbreaks have a similar pattern as other seasonal respiratory viruses (Sajadi et al., 2020; Poole, 2020). Also during the first COVID-19 cycle the data suggested seasonality, comparable to the seasonality of Influenza Like Illnesses (ILI), although the time series were typically too short for definitive conclusions (Hoogeveen et al., 2021). Currently, we are one year into the COVID-19 pandemic, and we can witness in the temperate climate zone in the Northern Hemisphere, a second wave which appears to rise and peak during the boundaries of a typical flu season, as the first cycle before.
Currently, it is not yet confirmed that COVID-19 behaves as seasonal as ILI. Therefore, we want to test our hypothesis that COVID-19 is as seasonal as ILI in a country in the temperate climate zone like the Netherlands, and therefore demonstrates similar seasonal patterns. To test our hypothesis, we performed in-depth time series analysis to compare the COVID-19 cycles with the multi-wave seasonality patterns of flu-like illnesses. In addition, we analyzed to what degree the COVID-19 pandemic fulfills the qualitative characteristics of earlier flu-like pandemics and seasonality as mentioned by Fox et al. Particularly, a short first wave at the tail end of a flu season, and a more severe second wave during the following flu season. We further expect peaks to occur within the seasonal boundaries between week 33 (± 2 weeks) and week 11 (± 5 weeks), and the nadir in the opposing period which coincides with allergy season (Hoogeveen, 2020; Hoogeveen et al, 2021).
The main objective of this study is to provide a predictive model for subsequent COVID-19 seasonal cycles.
2. Methods
2.1 Data
ILI incidence
We used data from the Dutch State Institute for Public Health (RIVM) gathered by the Dutch institute for research of the health care (Nivel) about weekly flu-like incidence (WHO code “ILI” - Influenza Like Illnesses). ILI is defined by the WHO as a combination of a measured fever of ≥ 38°C, and a cough, with an onset within the last 10 days. The Dutch ILI reports are gathered from primary medical care. Primary medical care is the first-line healthcare provided by local, general practitioners to their registered patients as typical in the Netherlands, with its current population of 17.4 million. The reports are confirmed by a positive RIVM laboratory test for ILI.
The flu-like incidence metric is a weekly average based on a representative group of 40 primary care units, and calculated using the number of influenza-like reports per primary care unit divided by the number of patients registered at that unit. This is then averaged for all primary care units in the Netherlands, extrapolated to the entire population, and reported as the ‘ILI incidence per 100,000 citizens in the Netherlands’. The datasets run from week 1 of 2016 up to week 52 of 2019 to preclude the COVID-19 measurement and avoid the impact of lockdowns and other COVID-19 restrictions on ILI in the 2020/2021 season. We used these data to calculate the average ILI incidence per week (n = 52) as our baseline times series.
COVID-19 incidence
To calculate the COVID-19 incidence, we used the RIVM.nl data set which reports the daily COVID-19 incidence per municipality. The incidence per municipality is based on positive COVID-19 tests that are reported via the local municipality health services (Gemeentelijke Gezondheidsdienst; GGD), that are under control of the RIVM. We aggregated the crude number into a weekly COVID-19 incidence for the Netherlands per 100,000 citizens, to create a metric on the same scale as the standard ILI metric. We calculated the values from week 13, 2020, the peak of the short first COVID-19 cycle in the Netherlands, till week 5, 2021 (n = 45). We assume that the cycles themselves are sufficiently representative for time series analysis, even though the COVID-19 incidence during the first cycle is most likely underestimated compared to incidence during the second cycle, due to test bias. With test bias, we mean that both the method of testing and the test capacity, altered during the development of the COVID-19 pandemic.
Therefore, as a sensitivity analysis, we used a second dataset from RIVM, which is based on data of the Dutch national intensive care evaluation (NICE) foundation. Based on hospital admissions, the RIVM estimated the COVID-19 incidence in the Netherlands, assuming a delay of at least 7 days between the COVID-19 infection and hospital admission. This dataset provides the average COVID-19 incidence per day with a 95% confidence interval (95% CI). Again, we calculated the average weekly COVID-19 incidence for the Netherlands per 100,000 citizens, to create a metric on the same scale as the standard ILI metric.
2.2 Statistical analysis
Variables are presented with their means (M) and standard deviations (SD).
We calculated correlation coefficients to test the hypotheses and to assess the strength and direction of relationships.
Linear regression (F-test) on the ILI and COVID-19 time series are performed as a sensitivity analysis and used descriptively to determine the strength of the relationship between the COVID-19 and ILI time series. More in detail to determine the equation using estimates and intercept values, probability, significance level, F-value, and the Multiple R squared correlation to understand the predictive power of the respective relation. Standard deviations and errors, and degrees of freedom (DF) were used as input for calculating the 95% probability interval.
We have reported in the text the outcome of statistical tests in APA style, adapted to journal requirements. For all time series we have used the log10 function to transform the data, to compensate for skewness or non-linear patterns, as it makes the relationships between variables appear linear, before calculation correlation coefficients and applying linear regression. The outcome of log10 were multiplied with factor 2 to create an intuitive scale from 0 to 10 for ILI and CLI, which is quite similar to the [1, 12] logarithmic Richter scale for earthquakes (Boore, 1989). The logarithmic scale we elaborated is rational, plots exponential characteristics on a linear infections scale (Steffen, 2018). We added descriptive labels to each scale as an aid for qualitative interpretation and comparison.
Correlations are calculated manually in Excel, and for linear regression Graphpad 2021 is used.
3. Results
3.1 Data analysis
The means and standard deviations of the dataset are summarized in Table 1.
Logarithmic scale [1, 10] of ILI or CLI (or other) incidence because of the exponential nature of epidemics, with proposed qualitative descriptions for convenience.
Figure 1 shows a short first COVID-19 wave at the tail end of the 2019/2020 flu season, and a more severe second wave during the 2020/2021 flu season in terms of total incidence. The peaks are all within the seasonal boundaries between week 33 (± 2 weeks) and week 11 (± 5 weeks), and the nadirs in the opposing period. The hospitalizations based estimates for COVID-19 incidence provide likely a more realistic picture of especially, the first wave, given test bias. However, on a logarithmic scale, the first COVID-19 wave appears more visually comparable in both time series.

Historical ILI incidence versus COVID-19 incidence per 100K citizens during the 2020/2021 season. Peaks are all during flu season, and lows during the opposite season. The shaded periods are the typical period in which seasonal switching occurs.
On our logarithmic infection scale (Fig. 2), the estimated COVID-19 incidence tops around 6 (severe epidemic level) and the nadir bottoms out around 3 (sever outbreak level). Interestingly, on this scale it becomes visible that COVID-19 incidence starts to rise slightly earlier than what’s usual for ILI (week 33 ± 2 weeks).
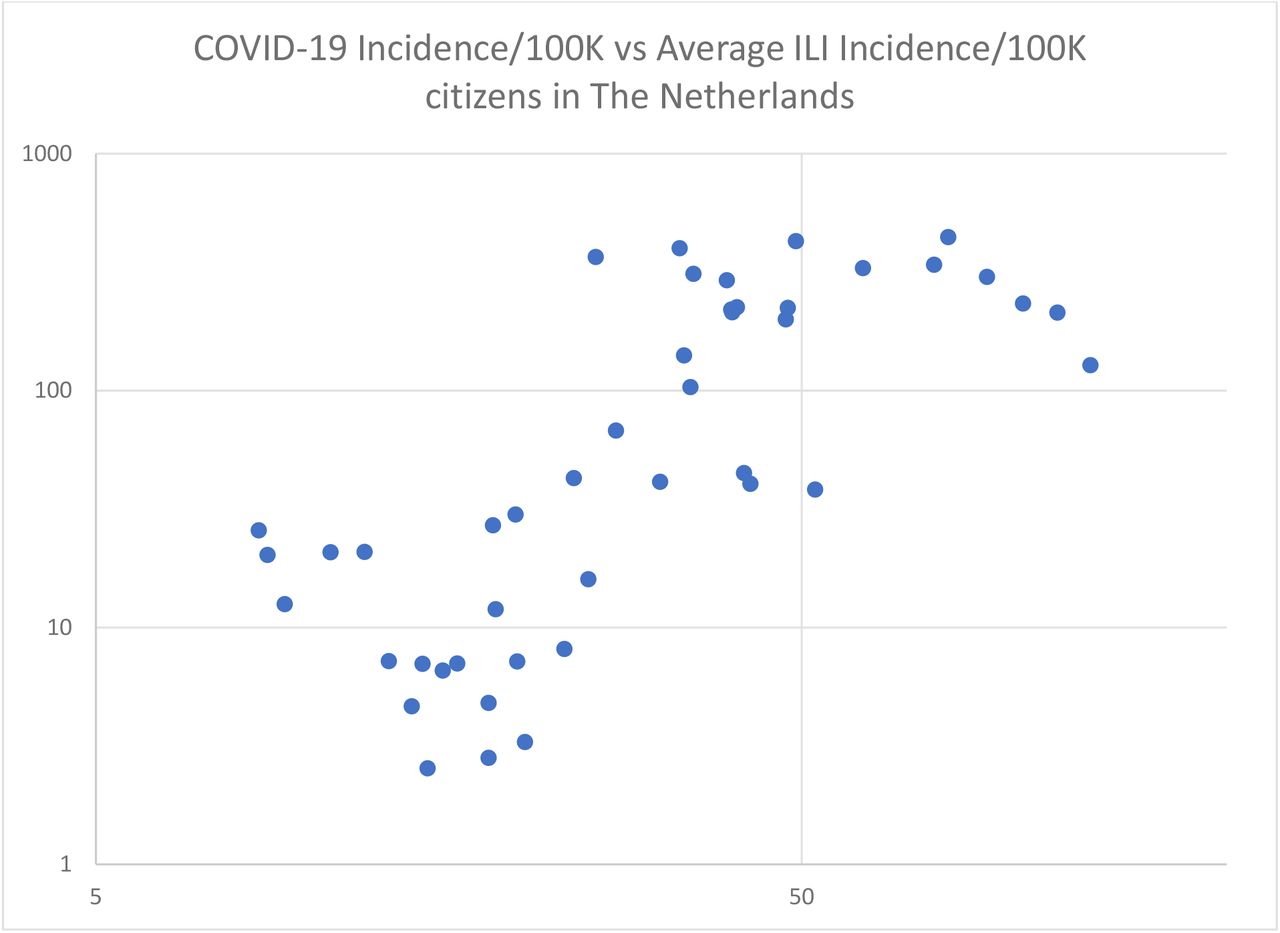
Scatter diagram showing the relation between COVID-19 incidence/100K citizens (Y-axis) and the seasonal, average ILI incidence/100K citizens (X-axis) in the Netherlands of the preceding 4 years.

Historical ILI incidence versus COVID-19 incidence per 100K citizens on the 1 to 10 logarithmic scale. It visualizes how similar the COVID-19 time series based on hospitalizations is with the historic ILI time series. The shaded areas are the typical seasonal switching periods.
3.2 Statistical outcomes
The COVID-19 time series strongly and highly significantly correlates with the ILI time series r(45) = 0.75 (p < 0.00001). The alternative, hospitalizations-based, COVID-19 time series, which provides estimates that seems to control for test bias, correlates even somewhat stronger, (r(45) = 0.798, p < 0.00001), and as significantly. The correlations with the 95% CI lower and higher boundaries of the estimated COVID-19 incidence time series are very close, respectively r(45) = 0.788, p < 0.00001 and r(45) = 0.803, p < 0.00001. Therefore, we conclude that the COVID-19 time series have a similar wave pattern to the ILI time series, which have long been established as being seasonal. Furthermore, the COVID-19 peaks, similar to ILI peaks, all happen during flu season, i.e., between week 33 (± 2 weeks) and week 11 (± 5 weeks). And, the COVID-19 nadirs, similar to ILI nadirs, happen all in the opposing allergy season.
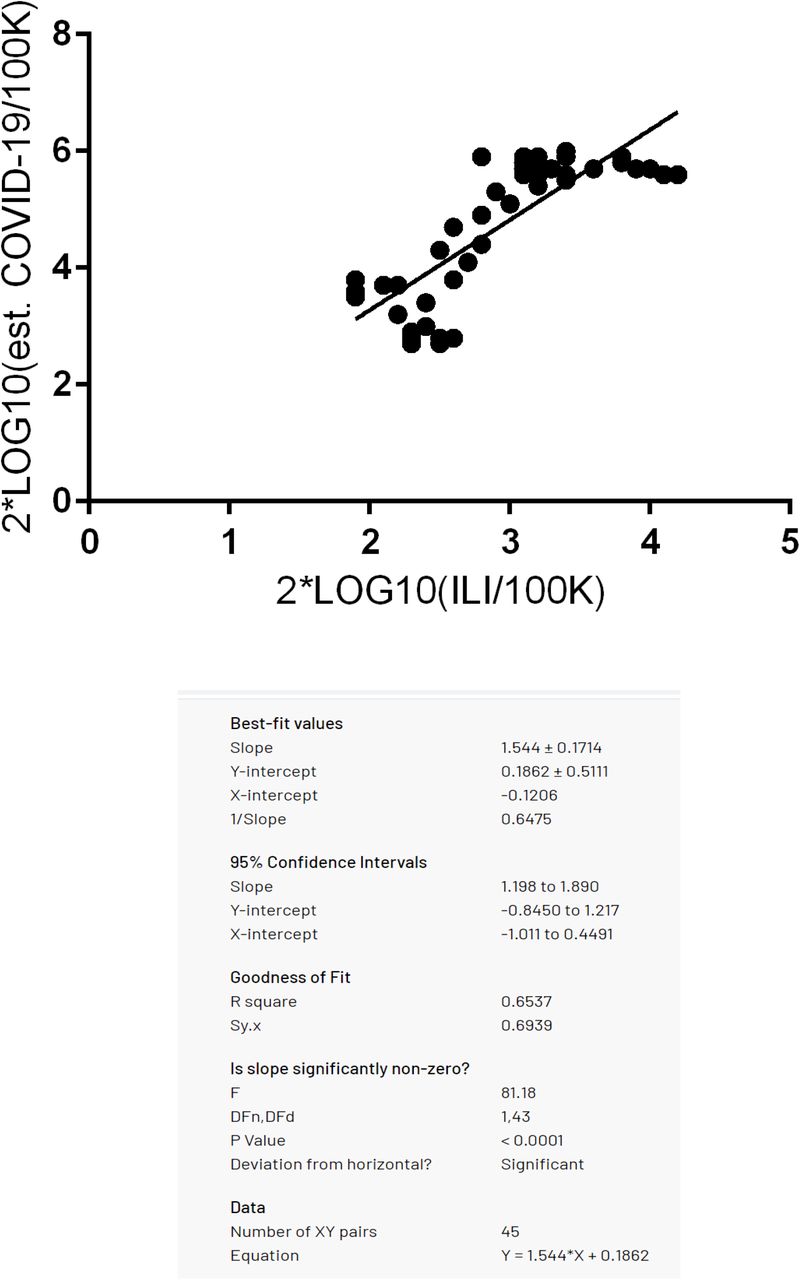
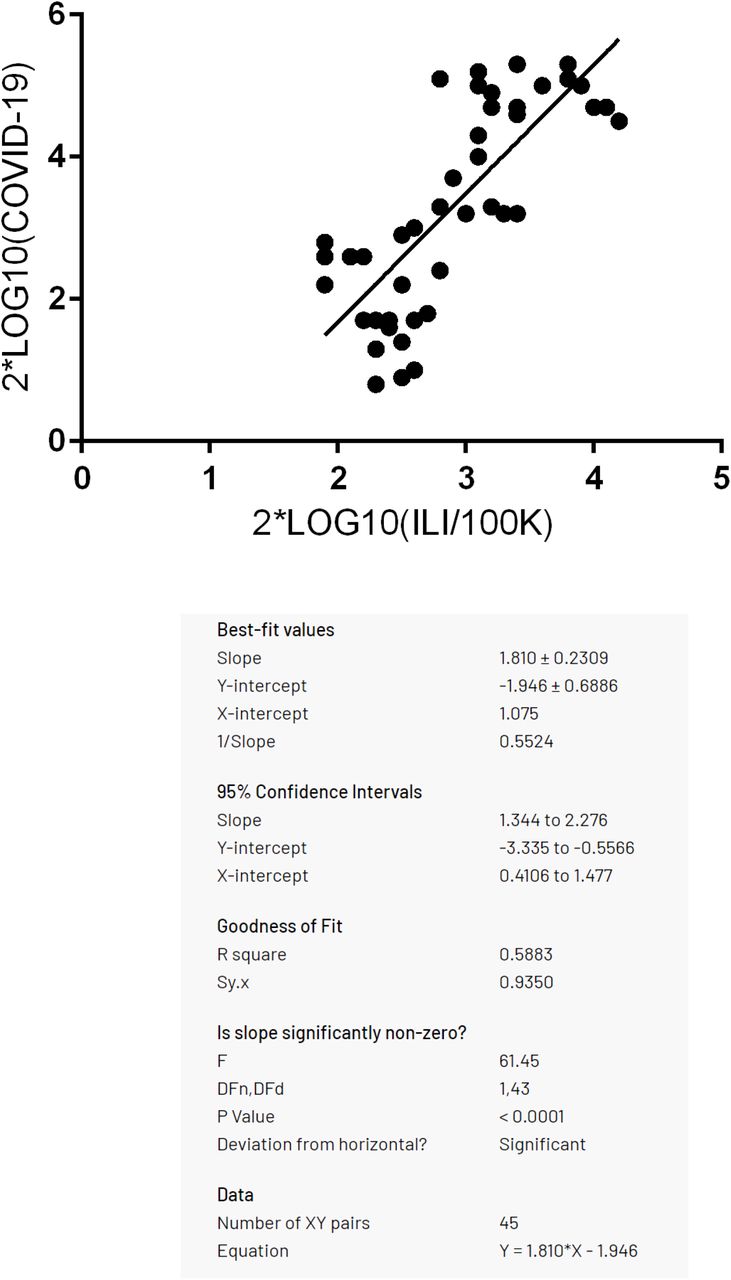
As a second sensitivity analysis, we performed univariate regression analyses between both COVID-19 time series, and the average ILI time series. The outcomes were again highly significant: respectively F(1, 43) = 61.45, p < 0.0001, and F(1, 43) = 81.18, p < 0.0001 and the correlations (r2) are moderate to strong (see Table 3).
Overview of means (M) and standard deviations (SD) per variable in the dataset, including 2*Log10 transformed data.
Highly significant outcomes of univariate regression analyses of the average ILI incidence/100K citizens on both time series for COVID-19 incidence/100K citizens, whereby each time series is 2*LOG10 transformed to compensate for non-linearity, and thus plotted on a 1 to 10 rational scale.
4. Discussion
Given the strong, and highly significant, correlations between the ILI and COVID-19 time series, we conclude that COVID-19 behaves as seasonal as ILI in a country in the temperate climate zone, such as the Netherlands. Moreover, the COVID-19 peaks are all during flu season, and lows are all in the opposing period as expected. Furthermore, the COVID-19 time series satisfies the two characteristics of earlier pandemics (Fox et al, 2017), namely a short first wave at the tail-end of a flu season, and a longer and more intense second wave during the subsequent flu season. This implies that it makes the subsequent endings and starts of each following wave predictable. If the history of pandemics (Fox et al, 2017) is followed, the third COVID-19 would be less severe than the second one, even without a vaccine.
Interestingly, all over Europe the COVID-19 cycles were all more or less in sync with the Dutch COVID-19 cycle (Reuters, 2021), and thus ILI seasonality, independent of the start of the first cycle, the severity of lockdown measures taken, and given that herd immunity is not yet reached. The seasonality pattern of COVID-19 appears to be influenced though not caused by social distancing and lockdown measures as these measures were mainly anti-cyclical and following the trend. They were increasingly applied to flatten the curve after COVID-19 incidence increases, gradually lifted after the sharper than expected COVID-19 downcycles in Spring and Summer, and only re-applied after the second wave seriously kicked in, during Autumn and Winter. It is beyond our research to quantify the considerable impact of lockdown and social distancing measures, although it might explain that COVID-19 incidence on the logarithmic scale (see Fig. 2) starts to rise slightly earlier than what’s usual for ILI (week 33 ± 2 weeks) as social distancing and lockdown measures were increasingly relaxed and ignored in this period.
What environmental factors have caused COVID-19 seasonality? We have analyzed before that the likely inhibiting factor causing ILI seasonality, before or during COVID-19, are seasonal allergens (i.e, pollens) and seasonal allergies (Hoogeveen, 2020, Hoogeveen et al, 2021), given that meteorological factors alone are not sufficient to explain the seasonality of ILI (Tamerius et al., 2011) or COVID-19 (Kerr et al, 2020). The inverse seasonality of seasonal allergens and ILI including COVID-19 is independently confirmed by a recent Chicago study that covered not only for pollens but also mold spores (Shah et al, 2021).
At the other hand, we identified solar radiation (UV) as an ILI/COVID-19 co-inhibitor, and it is well-established that dry, warm and sunny weather stimulate the maturation and dispersion of pollens.
Although the allergenic role of pollen is widely known (Klemens et al, 2007; Rosenwasser, 2011; Howarth, 2000), its role in immuno-activation (Brandelius et al, 2020) is highlighted only recently. Owing to extensive COVID-19 research, pathophysiological explanations have been established upon the observation that allergic diseases are associated with lower rates of COVID-19 hospitalizations (Larsson & Gill, 2021; Keswani et al, 2020). An explanation is provided by Jackson et al. (2020), who proved that allergic sensitization and allergen natural exposure are inversely related to membrane-bound angiotensin-converting enzyme 2 (ACE-2) expression, whereby it is known that severe acute respiratory syndrome coronavirus 2 (SARS-CoV-2) uses the ACE-2 receptor to gain cell entry, leading to COVID-19 (Wan et al., 2020). Additionally, it is hypothesized that seasonal allergens, especially pollens and mold spores, compete with flu-like viruses for access to another receptor, the Toll-like receptor 4 (TLR4) (Shah et al., 2021), in an attempt to explain the inverse seasonality of seasonal allergens and flu-like illnesses, both for people with and without allergic diseases.
Another explanation is based on the higher eosinophil count in children with allergic diseases than COVID-19 patients (Licari et al., 2020), whereby eosinophils are known to clear viral load, and contribute to the recovery from viral infections, supposedly including COVID-19 (Lindsley et al, 2020).
Furthermore, histamine and IgE serum levels are elevated in allergic rhinitis and other atopy patients which downplay other anti-viral responses (plasmacytoid dendritic cells and interferon-α) but might thus prevent the cytokine storm and hyper-inflammation that typically mark severe outcomes of respiratory diseases, including COVID-19 (Carli et al., 2020) and influenza. Similarly, it is reported that pollen might suppress interferon-λ1 and -λ3 and pro-inflammatory chemokine responses in non-allergic subjects (Gilles et al, 2020).
Finally, it is well-established that pollens have anti-viral phytochemicals (Kappor et al, 2017), which is also the case for mold spores (Linnakoski, 2018). Although the nature of the bioaerosol interaction with COVID-19 viruses is not well-investigated yet it can be hypothesized that pollens and spores compete with viral bioaerosol in the environment.
Logarithmic Infection Scale
A logarithmic infection scale seems to be useful for ILI or COVID-19. It plots the nonlinear, exponential curves on a linearized scale. This allows for standard linear regression analysis. Furthermore, the 1 to 10 rational scale is intuitive as it relates to the counting system we are all familiar with, and is quite similar to the well-established Richter scale for earthquakes. The addition of descriptive terms, similar to what we are used to in other nonlinear scales, might be helpful in quickly grasping the severity of an epidemic or pandemic in intuitive, layman terms. And it makes comparison between different epidemics or pandemics easier. Finally, it enlarges the critical early stages of an epidemic, and it reduces the extreme peaks and resulting test bias because of test capacity overloads.
Methodological concerns
Test bias, especially for new viruses like COVID-19, are a major methodological challenge. The approach to use more reliable metrics like the number of hospitalizations to generate an alternative incidence metric appears to be a good correction for test bias. Another sound approach used seems to be excess mortality estimates. In this study, we decided not to use these, as there are other known factors than seasonal viruses that cause it, such as the heat wave during the Summer of 2020. Using excess mortality would just introduce another bias.
5. Conclusion
The COVID-19 pandemic in the Netherlands is till now as seasonal as flu-like illnesses given the highly significant and strong correlations between both time series. But, also given that COVID-19 waves till now rise between the temporal boundaries (week 15 ±5 weeks and week 33 ±2 weeks) of the typical flu-like season in The Netherlands, and go down in the opposing periods. Further, the COVID-19 pandemic satisfies the qualitative criteria of earlier respiratory pandemics since 1889: the first wave is short-lived at the tail-end of flu season, the second wave is longer and more severe, peaks fall within the boundaries of flu-like season, and the lows are during the boundaries of the opposing season.
Data Availability
Data is fully based on publicly available sources.


