
Abstract
Physical activity (PA) is an important risk factor for a wide range of diseases. Previous genome-wide association studies (GWAS), based on self-reported data or a small number of phenotypes derived from accelerometry, have identified a limited number of genetic loci associated with habitual PA and provided evidence for involvement of central nervous system in mediating genetic effects. In this study, we derived 27 PA phenotypes from wrist accelerometry data obtained from 93,745 UK Biobank study participants. Single-variant association analysis based on mixed-effects models and transcriptome-wide association studies (TWAS) together identified 6 novel loci that were not detected by previous studies. For both novel and previously known loci, we discovered associations with novel phenotypes including active-to-sedentary transition probability, light-intensity PA, activity during different times of the day and proxy phenotypes to sleep and circadian patterns. Follow-up studies indicated the role of the blood and immune system in modulating the genetic effects and a secondary role of the digestive and endocrine systems.
Introduction
Regular physical activity (PA) is associated with lower risk of a wide range of diseases, including cancer, diabetes, cardiovascular disease1, Alzheimer’s disease2, as well as mortality3,4. However, studies have indicated that large majority of US adults and adolescents are insufficiently active5, and thus PA interventions have great potential to improve public health. PA was shown to have a substantial genetic component, and understanding its genetic mechanism can inform the design of individualized interventions6,7. For example, people who are genetically pre-disposed to low PA may benefit more from early and more frequent guidance.
A number of previous genome-wide association studies (GWAS) on physical activity have relied on self-reported phenotypes, which are subject to perception and recall error8–11. Recently, wearable devices have been used extensively to collect physical activity data objectively and continuously for multiple days. To date, there have been two GWAS based on acceleromtery-derived activity phenotypes. Both studies used data from the UK Biobank study12,13 but only focused on a few summaries of these high-density PA measurements. One study considered two accelerometry-derived phenotypes (average acceleration and fraction accelerations > 425 milli-gravities) and identified 3 loci associated with PA11. A second study used a machine learning approach to extract PA phenotypes, including overall activity, sleep duration, sedentary time, walking and moderate intensity activity14. This study identified 14 loci associated with PA and found that the central nervous system (CNS) plays an essential role in modulating the genetic effects on PA. However, both studies used a small number of phenotypes, which may not capture the complexity of PA patterns.
Recent studies suggest that in addition to the total volume of activity, other PA summaries may be strongly associated with human health and mortality risk. For example, the transition between active and sedentary states was strongly associated with measures of health and mortality4,15. PA relative amplitude, a proxy for sleep quality and circadian rhythm, was strongly associated with mental health16. Moderate-to-vigorous PA (MVPA) and light intensity PA (LIPA) have also been reported to be associated with health17,18. Thus, there is increasing evidence that objectively measured PA in the free-living environment is a highly complex phenotype that requires a large number of summaries that provide complementary information. Understanding the genetic mechanisms behind these summaries is critical for understanding the genetic regulation of activity behavior and informing targeted interventions.
In this paper, we conducted genome-wide association analysis using 27 accelerometry-derived PA measurements from UK Biobank data12,13. The phenotypes cover a wide range of features including volumes of activity, activity during different times of the day, active to sedentary transition probabilities and various principal components (Supplementary Table 1). We conducted GWAS using a mixed-model-based method, fastGWA19, to identify variants associated with the above phenotypes. We also conducted transcriptome-wide association studies (TWAS)20 across 48 tissues to identify genes and tissues harboring the associations. We further conducted tissue-specific heritability enrichment21,22, gene-set enrichment23 and genetic correlation24 analyses to further reveal the underlying biological mechanisms. We identified 6 novel loci associated with PA and showed that, in addition to the CNS, blood and immune related mechanisms could play an important role in modulating the genetic effects on activity, and digestive and endocrine tissues could play a secondary role.
Results
Genetic Loci Associated with Physical Activity
Single-variant genome-wide association analysis identified a total of 16 independent loci, including five novel ones compared to previous studies (Table 1 and Fig. 1). The locus indexed by single-nucleotide polymorphism (SNP) rs301799 on chromosome 1 was associated with total log acceleration (TLA) between 6pm to 8pm, representing early evening activity. Three novel loci were discovered on chromosome 3: the locus indexed by rs3836464 was associated with active-to-sedentary transition probability (ASTP); the locus indexed by rs9818758 was associated with relative amplitude, which is a proxy sleep behavior and circadian rhythm25; the locus indexed by insertion-deletion (INDEL) 3:131647162_TA_T (no rsid available) was associated with TLA 2am-4am which is a proxy phenotype for activity during sleep. LIPA appeared to be associated with other SNPs near 3:131647162_TA_T but not the lead variant itself, indicating multiple independent signals at the same locus (Fig. 1). Another locus indexed by rs2138543 is associated with TLA 6am-8am which represents early morning activity, and the second principal component of log-acceleration (PC2), for which the interpretation is less clear (Table 1).

The red dashed line is p = 2.63 ×10⁻⁹ accounting for the number of independent traits. The blue dashed line is the standard genome-wide significance threshold p = 5 ×10⁻⁸. Five novel loci that have not been discovered in previous GWAS of physical activity, sleep duration and circadian rhythm are circled out (see Table 1).
Our analysis also identified novel phenotypes for several known loci (Table 1). The strongest signal was seen for the locus indexed by rs113851554 which is associated with multiple sleep and circadian rhythm proxy phenotypes including TLA 12am-2am (p = 6.7 ×10−37), TLA 2am-4am (p = 7.9 ×10−39), average log acceleration during the least active 5 hours of the day (L5, p = 1.3 ×10⁻³³), timing of L5 (p = 5.4 ×10⁻²²) and PA relative amplitude (p = 6.9 ×10⁻¹⁵). This locus was previously identified to be associated with accelerometry-derived sleep duration in UK Biobank14. Among other known loci, 5 were only discovered in the GWAS of self-reported circadian rhythm26 but not in the other studies considered (Table 1, last column). In our analysis, the loci indexed by rs1144566, rs9369062 and rs12927162 were associated with sleep proxy phenotypes including timing of L5, TLA 12am-2am, TLA 2am-4am and TLA 10pm-12am. Two other loci, indexed by rs2909950 and rs12717867, were associated with TLA 6pm-8pm and LIPA, respectively.
Transcriptome-Wide Association Study and Colocalization Analysis
We performed transcriptome-wide association studies (TWAS) 20,27 for each PA trait based on gene expression data across 48 tissues available through GTEx (version 7)28. Our analysis identified 15 loci (Table 2, Fig. 2, Supplementary Table 2) with significant association in at least one trait-tissue pair analysis after correcting for multiple testing (Benjamini-Hochberg corrected p-value < 2.5 ×10⁻⁶, see Methods). We identified a novel locus and an underlying index pseudogene PDXDC2P (16q22.1), the expression of which in esophagus mucosa and EBV transformed lymphocytes appeared to be genetically associated with TLA 6am-8am (Fig. 2). The locus was not previously reported by any prior GWAS and were not close to any of the 5 novel regions detected by our single variants analysis (Table 2).

The figure shows -log10 p-value for all the genes expressed in esophagus mucosa (digestive, upper panel) or EBV-transformed lymphocyte cells (blood/Immune, lower panel) as reported in GTEx v7. Significant genes with FDR corrected p-values< 2.5 ×10⁻⁶ are circled (see Methods for details). Only the PA traits that are significantly associated with at least one variant at p < 2.63 ×10⁻⁹ in single-variant analysis are shown.
The TWAS analysis also identified novel PA phenotypes, potential target genes and underlying tissues for many of the known loci or novel loci detected through single variant analysis (Table 2). Consistent with a previous study14, the TWAS analysis showed that genetic association for PA traits often points towards involvement of CNS (Table 2). Further, our analysis indicates consistent involvement of blood and immune, digestive and endocrine systems in modulating the genetic effects on PA. Among the 15 loci significant in TWAS analysis, the lead genes of 4 loci were significantly associated with PA phenotypes via the blood and immune tissues. For example, the genetically predicted expression of PBX3 and KANSL1 in the blood and immune tissues were each associated with 3 PA phenotypes. The genes associated with PA via blood and immune tissues were also associated via digestive (e.g., esophagus mucosa) and/or endocrine (e.g., thyroid) tissues, but only one of them overlapped with the 9 genes that were associated with PA phenotypes through the CNS (Table 2). Another locus, represented by C3orf62, were associated with PA relative amplitude only via the digestive and endocrine tissues but not the blood/immune tissues or CNS. These findings suggested that the genetic regulation of PA occurs via at least two different pathways: a primary pathway involving the CNS (brain in particular) and a secondary pathway involving the blood/immune system and, potentially, the digestive and endocrine systems.
Several genes that were found to be significantly associated to specific PA traits in our TWAS analysis, were also found to be highly overlapping with genes that were previously reported to be associated with various traits and diseases including but not limited to neuropsychiatric diseases, behavioral traits, anthropometric traits and autoimmune diseases (Supplementary Fig. 1). For example, we found that the genes associated with TLA across different tissues, are enriched for genes that have been associated with neuroticism, bipolar disorder, Parkinson’s disease, cognitive function and several others indicating the putative involvement of the CNS in the genetic mechanism of TLA. Additionally, the genes associated with relative amplitude overlapped highly with those associated with several autoimmune diseases like inflammatory bowel disease, ulcerative colitis in addition to different behavioral and cognitive traits (Supplementary Fig. 1). These results further supported the possible involvement of both CNS as well as the blood and immune system in the genetic mechanism of PA traits.
We performed a colocalization analysis to gain further insights on the tissue specific activity of the significant genetic loci. Among the 16 loci significantly associated with PA, 9 loci colocalized with the eQTL signals for at least one gene and one tissue with a colocalization probability (PP4) > 0.8 (Supplementary Table 3). Colocalization occurred in a similar set of tissues as those that harbored the TWAS associations (Table 2 and Supplementary Table 3), namely the CNS, blood and immune, digestive and endocrine tissues, and also in a number of cardiovascular tissues that were not highlighted by TWAS. Among the 15 lead genes for TWAS significant loci, the eQTL signal of 4 genes (RERE, C3orf62, PBX3 and RP11-396F22.1) colocalized with PA GWAS signal in at least one tissue. Colocalization also occurred in two other secondary genes (RP5-1115A15.1 and CASC10).
Analysis of Heritability and Co-Heritability
Our fastGWA analysis estimated genome-wide heritability of PA phenotypes as an intermediate output. The estimates appeared to be dependent on the sparsity level of the genetic relationship matrix (Supplementary Fig. 2). We chose the results under the lower cutoff (0.02) since it captured more subtle relatedness and should give more accurate heritability estimates. The estimates of heritability varied across different PA phenotypes. A number of traits were estimated to have higher heritability than others, including TLA (0.15), TLA 6pm-8pm (0.15), MVPA (0.14) (Supplementary Fig. 2). Afternoon and pre-sleep evening activity (TLA 4pm to 12am) appeared to be more heritable than morning activity (TLA 2am to 12pm). As could be expected, phenotypes with higher heritability tend to have a higher average X2 statistic for genetic associations, and a QQ plot which deviate further from the null line (Supplementary Fig. 3).
We further used stratified LD-score regression for partitioning heritability by functional annotations of genome21,22. Consistent with TWAS findings, this analysis also indicated possible role for blood and immune system in addition to CNS for genetic regulation of PA (Fig. 3). In particular, heritabilities for both TLA and LIPA were enriched for DNase I hypersensitivity sites (DHS) in primary B cells from peripheral blood and that for TLA 12pm-2pm were enriched for H3K27ac in spleen. We also found potential enrichment in other traits, though they were not significant after FDR adjustment. For example, for TLA 8am-10am, MVPA, and ASTP the heritability enrichment in active chromatin regions of blood/immune tissues were all close to being statistically significant (Supplementary Fig. 4).

The analysis was conducted using tissue/cell type specific stratified LD score regression based on 6 chromatin-based annotations in 111 tissues and cell types described in Finucane et al, Nature Genetics 2018 (PMID: 29632380). Each dot corresponds to an annotation in a tissue or cell type. A complete list of tissue and cell types is provided in Supplementary Table 7 of the above paper. Black line corresponds to FDR < 0.05 (-log(p-value)=3.83) across all combinations of trait, tissue, and histone mark. Red line corresponds to p = 0.05. See Supplementary Fig. 4 for the enrichment p-values for the rest of the traits. CNS: central nervous system.
We further used LD score regression24,29 to explore genetic correlation between PA phenotypes and four broad groups of complex traits and diseases (Supplementary Fig. 5 and Supplementary Table 4). Genetic correlations were identified (FDR < 10%) between PA phenotypes and: (1) neurological, psychiatric and cognitive traits, including Alzheimer’s disease (AD), attention-deficit hyperactivity disorder (ADHD), depressive symptoms, intelligence, and neo-conscientiousness; (2) auto-immune diseases, with the strongest correlation for multiple sclerosis and weaker correlations for Crohn’s disease and primary billary cirrhosis; (3) obesity-related anthropometric traits and (4) cholesterol levels. These results broadly supported our previous results indicating the role of CNS and blood/immune related mechanisms in the genetics of PA traits.
Discussion
In summary, our study provided novel insights to genetic architecture of physical activity through genome-wide association analysis of an extensive set of accelerometry based PA phenotypes, derived in the UK biobank study, and a series of follow-up genomic analyses. We identified a total of six novel loci, most of which were associated with PA phenotypes not considered in previous studies 11,14,26,30. Our analysis also identified novel phenotypes associated with the known loci. Further, we provided multiple independent lines of evidence that genetic mechanisms for association for PA involve the blood and immune system, which can be potential targets for developing future interventions.
Compared to the 15 loci identified by the two previous GWASs on accelerometry-based PA 11,14, the novel loci we discovered have increased the number of PA susceptibility loci by 40%. Most of the novel loci were connected to the expression of genes, pseudogenes or long non-coding RNAs (lncRNA, Table 1 and 2). The novel locus index by rs301799 overlapped with the TWAS locus indexed by RERE (Table 1 and 2). The RERE gene was shown to be important for early development of brain, eyes, inner ear, heart and kidneys, which could have complex effects on an individual’s ability to perform physical activity 31. The novel locus indexed by rs9818758 overlaps with the TWAS locus index by C3orf62. Though it was unclear how C3orf62 is involved in PA, two secondary genes in the locus, ARIH2 and DAG1 (Table 2), appeared to be involved in relevant biological processes. ARIH2 was found to be essential for embryogenesis by regulating the immune system32; DAG1 was found to play a role in the regeneration of skeletal muscles33. Another two novel loci were connected to pseudogene PDXDC2P and lncRNA RP11-396F22.1 of which the function is less clear and may be worth future lab investigation.
The novel phenotypes in this study provided important insights into the genetic architecture of PA, which may have been overlooked by previous GWASs on a small number of phenotypes. The accelerometry-based study by Doherty et al identified the genetic associations with overall activity, sleep duration and sedentary time14; the study by Klimentidis et al studied the average acceleration and the duration of active states11. Our results found that there can be different genetic architecture for PA during different times of the day, and there can be unique variants that only affect certain PA patterns, like ASTP, LIPA and relative amplitude, but not others (Table 2). The heritability and genetic correlation can also vary across different PA phenotypes (Supplementary Fig. 2 and Supplementary Fig. 5).
TWAS and tissue-specific heritability enrichment analysis suggested that in addition to the CNS, the blood and immune system could be also associated with PA. This finding was further supported by colocalization, gene-set enrichment and genetic correlation analyses. A previous study14, which explored enrichment of heritability for PA traits by tissue-specific gene expression patterns, identified potential modulating role of the CNS, adrenal/pancreatic and skeletal muscle tissues. Our study, which used a more extended set of phenotypes and chromatin-state-based annotations, confirmed previous findings and further highlighted the role of the blood and immune system. Previous medical literature has established the effect of PA on immune functions. A study showed that higher PA is associated with elevation of T-regulatory cells and lower risk for autoimmune diseases34. Multiple studies showed that regular moderately intense PA boost immune functions in older adults and protects against age-related inflammatory disorders35–37. Our analysis suggested the link between PA and immune functions in the genetic pathways and future studies are needed to better understand the underlying mechanisms and causal directions.
In addition to the blood and immune system, TWAS and enrichment analysis also suggested that the digestive system and endocrine system could be involved in modulating the genetic effects on PA. A previous study found that PA has complex effects on gastroinstestinal health38: acute strenuous activity may provoke gastrointestinal symptoms while low-intensity activity could have benefits. Interestingly, three TWAS loci that were significant in digestive tissues were associated with PA phenotypes that are proxies for meal-time activity: PDXDC2P with TLA 6am-8am, RERE with TLA 6pm-8PM and KANSL1 with TLA 4pm-6pm (Table 2). It was also known that multiple organs in the endocrine system produce hormones that regulate physiological functions of the body, which can have complex bidirectional relationships with PA39–43. Our TWAS analysis indicated that the genes associated with PA via the blood and immune system tended to also be associated with the digestive and endocrine systems, but do not usually overlap with the genes associated with the CNS. This suggests that the blood and immune, digestive and endocrine systems may be involved in the same broad pathway that affects PA, which is different from that of CNS.
This study has a number of limitations. Though we derived a more extensive set of PA phenotypes than previous studies, information was still lost when collapsing a 7-day continuous times series of wrist accelerometry into 31 PA phenotypes. The ideal approach would be to conduct a GWAS utilizing all the information across the 7 days of accelerometry measurements. Results could outline genetic regulation of a continuous course of PA over time. The current analysis of TLA during 12 non-overlapping two-hour time intervals during the day, indicated that different genetic variants may affect PA during different times of the day (Tables 1 and 2). Another limitation is that some of the phenotypes are not directly interpretable. For example, the PCs of log acceleration are less interpretable than other phenotypes, such as TLA and ASTP.
However, they do reflect important features of physical activity and warrant further investigations. A potential solution is to obtain proxy measurements that are interpretable and highly correlated with PC scores.
In conclusion, we conducted association studies on a wide range of PA phenotypes and identified 6 novel loci associated with PA. We found that in addition to the CNS, the blood and immune system may also play an important role in the genetic mechanisms of PA, and the digestive and endocrine systems could also be involved in the blood and immune pathway.
Materials and Methods
Study Cohort and Physical Activity Phenotypes
The UK Biobank study consists of ∼500,000 individuals in the United Kingdom with comprehensive genotype and phenotype data13. We used a subset of the 103,712 individuals who were invited and agreed to participate in the accelerometry sub-study where participants wore a wrist-worn accelerometer for up to 7 days12. Accelerometry data from participants are available at multiple resolutions. Here, the individual-specific set of accelerometry-based phenotypes was derived from the five-second level acceleration data provided by the UK Biobank team. Individuals were screened for poor quality data using indictors provided by the UK Biobank. In addition, we required individuals to have at least 3 days (12am-12am) of sufficient wear time defined as estimated wear time greater than 95% of the day (>= 1368 minutes). Our inclusion criteria for this analysis closely mirrors that described in a related paper from our group44 with the exception that we did not exclude participants younger than 50 at the time of accelerometer wear or based on missing demographic and lifestyle data and instead excluded individuals based on ancestry and genotype data (see subsection Genotype Data below).
Physical activity phenotypes were all calculated at the day level and then averaged within study participants across days to obtain one measure for each phenotype and study participant. This led to in 31 PA phenotypes for 93,745 study participants that covered a wide spectrum of information: 1) total volume of activity (total acceleration (TA), total log acceleration (TLA)); 2) activity during 12 disjoint two-hour windows of the day (TLA 12am-2am, TLA 2am-4am, …, TLA 10pm-12am); 3) duration of sedentary state (ST), LIPA and MVPA; 4) PA principal components (PC1-6); 5) active-to-sedentary transition probability (ASTP) and sedentary-to-active transition probability (SATP); 6) proxy phenotypes for circadian patterns, including dynamic activity ratio estimate (DARE), activity during the most active 10 hours (M10) and least active 5 hours (L5) of the day, timing of M10 and L5, and PA relative amplitude. They included most of the phenotypes used in the previous PA association studies as well (See Supplementary Table 1 for details)11,14. The exact procedure for deriving study participant-specific phenotypes is described in detail in the supplemental material of the related paper from our group44. The phenotypes were inverse-normal transformed
 where the transformed variables have mean 0 and variance 1.
Removing Highly Correlated Phenotypes
Some of the initial 31 PA phenotypes were highly correlated (Supplementary Fig. 6). To avoid counting similar phenotypes multiple times, if two phenotypes had correlation > 0.8 we removed one of them. First, we removed total acceleration (TA), duration of sedentary state (ST), PC1 and M10 due to their high correlation with total log acceleration (TLA). TLA was retained as the main metric for the total volume of activity. Most previous studies used TA instead of TLA as the main metric for the volume of activity. However, the distribution of TA is highly skewed, which could lead to lower power for association testing and instability of findings due to dependence on extreme observations. In total, 4 phenotypes were removed and 27 PA phenotypes were retained for the association analysis.
Genotype Data
The imputed genotype data for ∼93 million variants, using UK10K, 1000 Genomes (Phase 3) and Haplotype Reference Consortium as reference panel, provided by UK Biobank were used and merged with the PA phenotype data. We excluded study participants according to the following criteria: 1) non-white ancestry; 2) putative sex chromosome aneuploidy; 3) an excessive number of relatives (more than 10 putative third-degree relatives in the kinship table); 4) sample was not in the input for phasing of chr1-chr22. After applying these exclusion criteria the sample was further reduced to 88,411 study particiants for downstream analysis.
We conducted variant quality control to ensure that genetic variants with poor genotyping quality do not affect the results. Specifically, variants that satisfy any of the following criteria were removed: 1) imputation INFO score < 0.8; 2) MAF < 0.01; 3) Hardy-Weinberg Equilibrium (HWE) p-value < 1 ×10⁻⁶; 4) missing in more than 10% study participants. After the filtering, 8,951,705 variants remained for downstream analysis, of which 8,067,228 (90.1%) were single nucleiotide polymorphisms (SNPs) and the rest (9.9%) were insertion-deletions (INDELs).
Association Analysis
We used a fast mixed-effects model method, fastGWA19, for genome-wide association analysis. Like other mixed-effects model methods, fastGWA allows the inclusion of related and unrelated individuals but improves computational efficiency by incorporating a sparse genetic relationship matrix (GRM). The GRM measures the genetic similarity between individuals and each element is the correlation of genotypes between a pair of individuals. We constructed the GRM using LD-pruned variants that had MAF > 5% and were present in HapMap3 (LD-pruning was done in PLINK using the following set up as recommended in Jiang et al 19: window size = 1000Kb, step-size = 100 and r2 = 0.9). We further computed a sparse-GRM at sparsity level 0.05 to capture the genetic relatedness between the closely related individuals only and reduced others to zero. We used the Haseman-Elston regression to estimate the variance of the random effects as an intermediate step of fastGWA. This approach is orders of magnitude faster than the previous state-of-the-art, BOLT-LMM45,46.
Models were adjusted for age, sex and the first 20 genetic principal components as covariates. Because the PA phenotypes are correlated, principal component analysis (PCA) was conducted on the phenotypes to estimate the number of independent phenotypes before setting the GWAS significance threshold. At least 19 phenotype PCs were needed to explain 99% percent of the PA phenotypic variance (Supplementary Fig. 7). Variants with p-value below the threshold 5 ×10⁻⁸/19 = 2.63 ×10⁻⁹ were declared to be statistically significant, which accounted for the number of independent phenotypes. LD clumping was conducted based on the minimum p-value across phenotypes. The requirements for the lead SNPs of different loci were to have r2 < 0.1 and be at least > 500kb apart.
A locus was defined as novel if its lead variant is > 500kb from the lead variant of any known loci discovered by the following GWASs on PA, sleep, and circadian rhythm: (1) Doherty et al study on a smaller set of accelerometry-derived PA phenotypes14; (2) Klimentidis et al study on self-reported and accelerometry-derived PA11; (3) Dashti et al study on self-reported sleep duration30; (4) Jones et al study on circadian rhythm26.
Transcriptome-wide association studies (TWAS) were conducted using the FUSION R program20 with reference models generated from 48 tissues of GTEx v728. TWAS analysis was limited to the 18 traits with at least one genome-wide significant variant (p < 2.63 ×10⁻⁹). Multiple testing due to the large number of tissue-trait combinations (48*18=864) was addressed by a two-stage adjustment approach: 1) for each variant, the Benjamini-Hochberg (BH) adjustment was applied across all tissue-trait pairs; 2) each variant with BH-adjusted p-value 2.5 × 10⁻⁶ was then identified (accounting for 20,000 protein-coding genes). Since there can be multiple genes in close proximity to each other, to identify independent loci detected by TWAS analysis, genes were clustered based on significant associations. A clumping approach was used, which selected the gene with the smallest minimum p-value across tissue-trait pairs and removed the other genes with a transcription start site (TSS) within 1Mb of the lead gene TSS. The process continued by identifying the gene with the next smallest minimum p-value and iterating. The only exception was when the lead gene of the cluster was not a protein-coding gene (e.g., pseudogene, lncRNA) and a protein-coding gene was in the cluster. In this case the protein-coding gene with the smallest minimum p-value was identified as the lead gene. This led to independent gene clusters at genomic loci which were least 1Mb apart, i.e., none of the lead gene TSS is within the cis region of another lead gene.
Enrichment Analysis
Stratified LD score regression21,22 was used to identify the tissues and genomic annotations enriched by the heritability for PA. For tissue specific analysis, chromatin-based annotations were used as derived from the ENCODE and Roadmap data47,48 by Finucane et al21. The annotations were based on narrow peaks of DNase I hypersensitivity site (DHS) and five activating histone marks (H3K27ac, H3K4me3, H3K4me1, H3K9ac and H3K36me3) observed for 111 tissues or cell types, resulting in a total of 489 annotations. Stratified LD score regression computes the heritability attributed to each annotation and computes a coefficient and a p-value that characterize enrichment.
In a separate analysis, the enrichment of TWAS signals was evaluated among the genes that have been reported to be associated to different traits, using FUMA23,49. For a given PA trait, we defined a gene-set as the genes that were significant at an exome-wide level (p < 2.5 ×10⁻⁶) and investigated whether these genes overlapped with the genes that have been mapped to genome-wide significant variants for different traits as reported in GWAS catalog50. The collection of such genes have been detailed in Molecular Signatures Database (MSigDB)51. We used FUMA to compute the proportion of genes related to other diseases and traits that were also identified by our TWAS analysis and computed enrichment p-values using the Fisher’s exact test.
Colocalization Analysis
For each susceptibility locus of PA (Table 1), colocalization analysis was conducted between its most significantly associated phenotype and eQTL effects on gene expression in 48 tissues in GTEx v728. SNPs within +-200kb radius of the lead SNP were used and genes that had at least one significant eQTL (q-value < 0.05) in the region were considered. Analysis was conducted using the R package COLOC 52 and GWAS and eQTL effects were identified as being colocalized if PP4 > 0.8.
Heritability and Genetic Correlation Analysis
Heritability of activity phenotypes was estimated using Haseman-Elston regression as an intermediate output of fastGWA19. Our fastGWA analysis computed sparse GRM at sparsity level 0.05 as recommended by the fastGWA paper (see “Association analysis”). However, this cutoff may miss the subtle relatedness in the sample and affect heritability estimate. As a sensitivity analysis, we re-estimated the heritability using a lower sparsity threshold at 0.02 to capture more subtle relatedness. The genetic correlation between 18 PA traits and 238 complex traits and diseases was estimated using LD score regression24 implemented in LD Hub53. In particular, we focused on four broad groups of traits and diseases (A) cholesterol levels (B) anthropometric traits (C) autoimmune disease and (D) miscellaneous traits including psychiatric, neurological, cognitive and personality traits. For each trait and within each category, we applied a false discovery rate correction to the p-values corresponding to the genetic correlation estimated using LD score regression, to account for multiple testing. Any genetic correlation with FDR-adjusted p-value less that 10% were declared as significant.
Data Availability
Data supporting the findings of this paper are available upon application to the UK Biobank study (https://www.ukbiobank.ac.uk/). The summary statistics will be made publicly available upon publication.
Data Availability
Data supporting the findings of this paper are available upon application to the UK Biobank study (https://www.ukbiobank.ac.uk/). The summary statistics will be made publicly available upon publication.
Competing Interests
Dr. Ciprian Crainiceanu is consulting with Bayer and Johnson and Johnson on methods development for wearable devices in clinical trials. The details of the contracts are disclosed through the Johns Hopkins University eDisclose system and have no direct or apparent relationship with the current paper. The other authors declare no conflict of interest.
Ethics Statement
Approval was granted by the UK Biobank study under application ID 17712 to use the data in the present work. UK Biobank has ethical approval from the North West Multi-Centre Research Ethics Committee (approval number 16/NW/0274). All participants provided informed consent to participate.
Web Resources
UK Biobank: https://www.ukbiobank.ac.uk/
fastGWA software: https://cnsgenomics.com/software/gcta/#fastGWA
FUSION TWAS software: http://gusevlab.org/projects/fusion/
COLOC R package: https://cran.r-project.org/web/packages/coloc/index.html
LD score regression software: https://github.com/bulik/ldsc
LD Hub: http://ldsc.broadinstitute.org/ldhub/
FUMA GWAS: https://fuma.ctglab.nl/
PLINK: https://www.cog-genomics.org/plink/2.0/
Molecular Signatures Database: http://www.broadinstitute.org/msigdb
Supplementary Figures
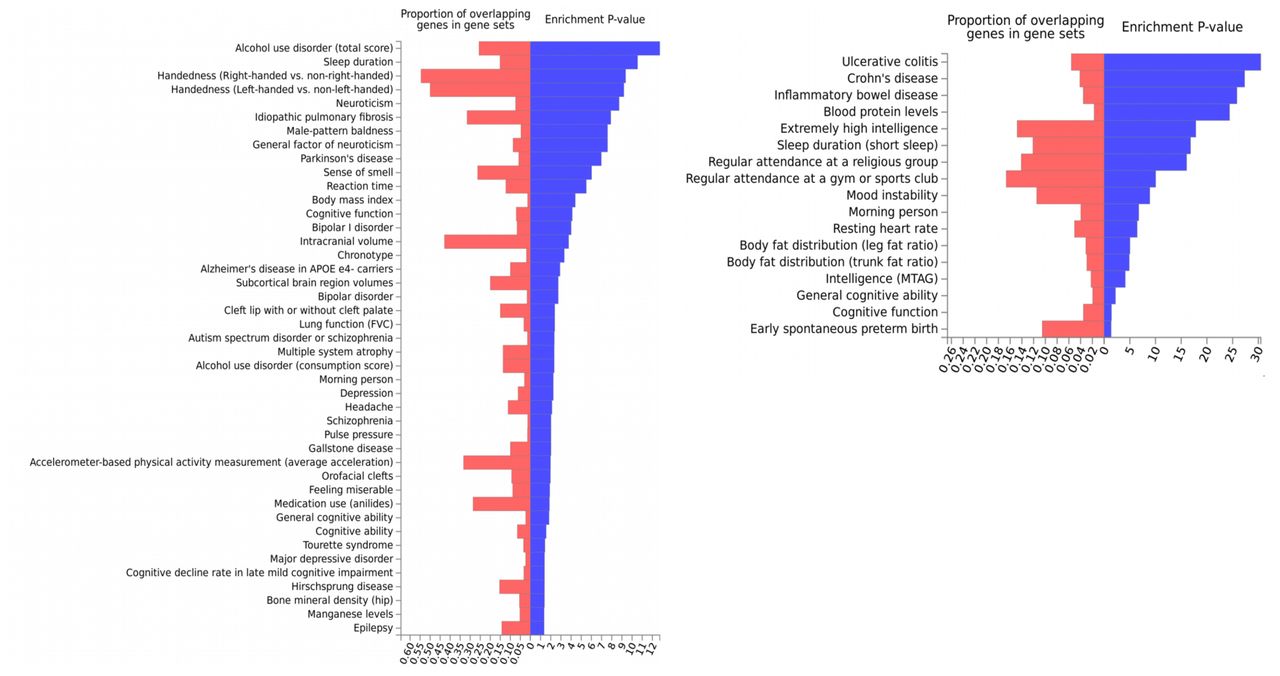
We use TLA and relative amplitude as examples because they capture two most important patterns of PA: total volume of activity and sleep quality. Genes previously reported to be associated to different traits and diseases as curated in the GWAS catalog were defined as gene-sets (see Methods). The genes associated to (A) TLA and (B) relative amplitude (p-value < 2.5 ×10⁻⁶) in transcriptome-wide analysis were checked for enriched overlap with the gene-sets curated from GWAS catalog for each trait (additionally reported in Molecular Signatures database).

a) Cutoff at 0.05: correlations that are < 0.05 in the GRM are reduced to zero, as is in our fastGWA analysis and recommended by the fastGWA paper. b) Cutoff at 0.02: correlations that are < 0.02 in the GRM are reduced to zero.

The average χ2 statistic is annotated at the top left corner of each panel.

The analysis was conducted using tissue/cell type specific stratified LD score regression (Finucane et al, Nat Genet 2018, PMID 29632380) based on 6 chromatin-based annotations in 111 tissues and cell types. A complete list of tissue and cell types is provided in Supplementary Table 7 of the above paper. Black line corresponds to FDR < 0.05 (-log(p-value)=3.83) across all combinations of trait, tissue, and histone mark. Red line corresponds to p = 0.05. The analysis was conducted using tissue/cell type specific stratified LD score regression (Finucane et al, 2018).

The PubMed ID’s for the corresponding for the GWAS summary statistics are in parentheses. The size of the circle and the darkness of the color represents the genetic correlation value. The asterisk sign represents if the corresponding genetic correlation was significant at an FDR correction threshold of 10% (corrected within the respective category). For genetic correlation value and p-values across all 237 traits analyzed, see Table S4.

Correlation coefficients > 0.8 or < −0.8 are marked with *.

At least 19 PCs are needed to explain 99% of the variance (red dashed line).
Acknowledgements
The UK Biobank data was accessed via application ID 17712. Research of Drs. Guanghao Qi, Diptavo Dutta and Nilanjan Chatterjee was supported by an R01 grant from the National Human Genome Research Institute [1 R01 HG010480-01].
References


