
Abstract
Comparing the impact of the COVID-19 pandemic between countries or across time is difficult because the reported numbers of cases and deaths can be strongly affected by testing capacity and reporting policy. Excess mortality, defined as the increase in all-cause mortality relative to the expected mortality, is widely considered as a more objective indicator of the COVID-19 death toll. However, there has been no central, frequently-updated repository of the all-cause mortality data across countries. To fill this gap, we have collected weekly, monthly, or quarterly all-cause mortality data from 89 countries and territories, openly available as the regularly-updated World Mortality Dataset. We used this dataset to compute the excess mortality in each country during the COVID-19 pandemic. We found that in the worst-affected countries the annual mortality increased by over 50%, while in several other countries it decreased by over 5%, presumably due to lockdown measures decreasing the non-COVID mortality. Moreover, we found that while some countries have been reporting the COVID-19 deaths very accurately, many countries have been underreporting their COVID-19 deaths by an order of magnitude or more. Averaging across the entire dataset suggests that the world’s COVID-19 death toll may be at least 1.6 times higher than the reported number of deaths.
1 Introduction
The impact of COVID-19 on a given country is usually assessed via the number of cases and the number of deaths, two statistics that have been reported daily by each country and put together into international dashboards such as the one maintained by the Johns Hopkins University (Dong et al., 2020). However, both metrics can be heavily affected by limited testing availability and by different definitions of ‘COVID-19 death’ used by different countries: some countries count only confirmed COVID-19 deaths, while others include suspected COVID-19 deaths or deaths from other causes in confirmed COVID-19 cases.
Excess mortality, defined as the increase of the all-cause mortality over the mortality expected based on historic trends, has long been used to estimate the true toll of pandemics and other extreme events — from the Great Plague of London in 1665 (as described in Boka and Wainer, 2020), to the influenza epidemic in London in 1875 (Farr, 1885; Langmuir, 1976), and more recently e.g. Hurricane Maria in Puerto-Rico in 2016 (Milken Institute, 2018). The consensus, therefore, is that the most objective indicator of the COVID-19 death toll, even referred to as the ‘gold standard’, is the excess mortality (Beaney et al., 2020; Leon et al., 2020). Excess mortality has already been used to estimate the COVID-19 impact in different countries, both in academic literature (e.g. Kontis et al., 2020; Alicandro et al., 2020; Ghafari et al., 2020; Woolf et al., 2020a,b; Weinberger et al., 2020; Blangiardo et al., 2020; Kobak, 2021) and by major media outlets. It has also been used to compare COVID-19 impact to the impact of major influenza pandemics (Faust et al., 2020; Petersen et al., 2020).
Measuring excess mortality across different countries requires, first and foremost, a comprehensive and regularly-updated dataset on all-cause mortality. However, there has been no single resource where such data would be collected from all over the world. The World Mortality Dataset presented here aims to fill this gap by combining publicly-available information on country-level mortality, culled and harmonized from various sources.
Several teams have already started to collect such data. In April 2020, EuroStat (http://ec.europa.eu/eurostat) began collecting total weekly deaths across European countries, “in order to support the policy and research efforts related to COVID-19.” At the time of writing, this dataset covers 36 European countries and also contains sub-national (NUTS2 and NUTS3 regions) data as well as data disaggregated by age groups and by sex for some countries. In May 2020, the Human Mortality Database (http://mortality.org), a joint effort by the University of California, Berkeley, and Max Planck Institute for Demographic Research (Barbieri et al., 2015), started cooperating with National Statistics Offices (NSOs) and other national institutions in compiling the Short Term Mortality Fluctuations (STMF) dataset (STMF, 2021; Németh et al., 2021). This dataset consists of weekly data, disaggregated by five age groups and by sex, and currently contains 35 countries with 2020 data. Both datasets are regularly updated and have considerable overlap, covering together only 44 countries.
In parallel, the EuroMOMO project (https://www.euromomo.eu), existing since 2008, has been displaying weekly excess mortality in 22 European countries, but without giving access to the underlying data. Another source of data is the UNDATA initiative (http://data.un.org; search for ‘Deaths by month of death’) by the United Nations, collecting monthly mortality data across a large number of countries. However, information there is updated very slowly, with January–June 2020 data currently available for only four countries.
Media outlets such as the Financial Times, The Economist, the New York Times, and the Wall Street Journal have been compiling and openly sharing their own datasets in order to report on the all-cause mortality in 2020. However, these datasets are infrequently updated and their future is unclear. For example, the New York Times announced in early 2021 that they would stop tracking excess deaths due to staffing changes.
Here, we present the World Mortality Dataset that aims to provide regularly-updated all-cause mortality numbers from all over the world. The dataset is openly available at https://github.com/akarlinsky/world_mortality and is updated almost daily. Our dataset builds upon the EuroStat and the STMF datasets, adding 45 additional countries — many more than any previous media or academic effort. At the time of writing, our dataset comprises 89 countries and territories. After the initial release of our manuscript, the dataset has been incorporated into the excess mortality trackers by Our World in Data (Giattino et al., 2020), The Economist and the Financial Times. While not all countries provide equally detailed and reliable data, we believe that information from all 89 countries is reliable enough to allow computation of excess mortality (see Discussion).
Our analysis (updated almost daily at https://github.com/dkobak/excess-mortality) shows statistically significant positive excess mortality in 66 out of 89 countries. Moreover, it suggests that the true COVID-19 death toll in several countries is over an order of magnitude larger than the official COVID-19 death count.
2 Methods
2.1 World Mortality Dataset
For all countries that are not covered by EuroStat or STMF, we aimed to collect the all-cause mortality data from their National Statistics Offices (NSOs), Population Registries, Ministries of Health, Ministries of Public Health, etc., collectively referred to here as ‘NSOs’.
Our strategy was to search for mortality numbers for every country on their NSO’s website. The data may be present in the form of a spreadsheet, a table generator, a periodical bulletin, a press release, a figure that required digitizing, etc. If we were unable to locate such data, we contacted the NSO via email, a contact form on their website, or on social media, asking them if they have weekly, monthly, or quarterly data on all-cause mortality for 2020.
Responses from NSOs have varied substantially. Some have provided us with the requested information, some replied that no such data were available, some did not respond at all. For many countries, the email addresses did not work and returned an error message. Here are some representative examples of the declining responses: “Due to the federal organization of our country, we don’t have 2020 mortality data available yet” (Argentina); “We are sorry to inform you that we do not have the data you requested” (China); “These are not available” (India); “Unfortunately we don’t have this data. Currently, we only have the number of people dying from traffic accidents (by month)” (Vietnam); “Unfortunately, we do not have a mechanism in place at the moment to capture routine mortality data in-country nation-wide […] As you may also be aware, death or mortality registration or reporting is yet a huge challenge in developing countries […]” (Liberia).
We included the data into our dataset from 2015 onwards if it satisfied the following inclusion criteria: (1) data were in weekly, monthly or quarterly format (we preferred weekly data whenever available); (2) data existed at least until June 2020; (3) there were data for at least one entire year before 2020 (or a forecast for 2020, see below). At the time of writing, our dataset comprises 89 countries and territories (Figure 1).
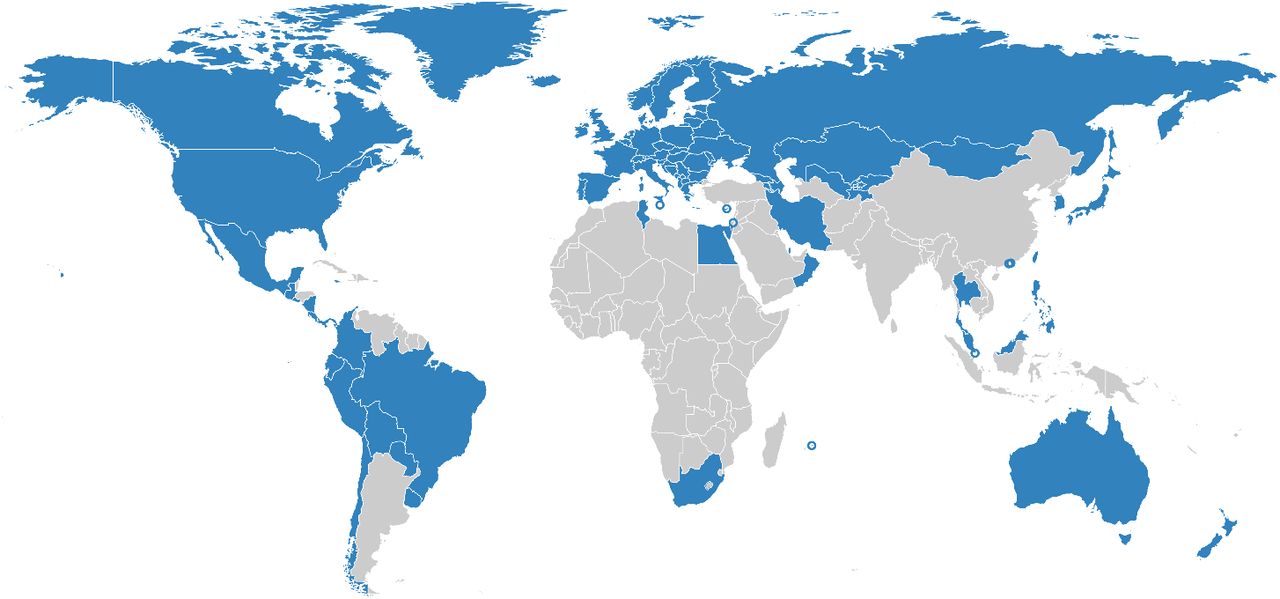
Countries in World Mortality Dataset are shown in blue. Cyprus, Hong Kong, Israel, Macao, Malta, Mauritius and Singapore are shown as circles due to their small geographical size.
For the weekly data, we preferred ISO weeks whenever possible (for Peru, Sweden, Ecuador, and Guatemala we converted daily data into ISO weeks). For Liechtenstein and Taiwan we preferred monthly format over weekly data from STMF/EuroStat, because weekly data were very noisy or less up-to-date. The data for Iran are available in quarterly format, where quarters start on December 21, March 21, June 21, and September 21 (Solar Hijri seasons). We treated the season starting on December 21 as the first data point for the following year.
We only collected country-level data, without age or gender stratification. In some cases, we had to combine several data sources, for example taking the 2015–2018 monthly data from UNDATA and 2019–2020 monthly data from a country’s NSO. A detailed description of the data sources for each country can be found on the dataset’s website at https://github.com/akarlinsky/world_mortality.
In this manuscript, we treat Taiwan, Hong Kong and Macao as separate countries. They release monthly all-cause mortality data, whereas China does not. We also treat Greenland and Transnistria as separate territories as Denmark and Moldova do not report these deaths in their figures.
2.2 Data limitations and caveats
The data in our dataset come with several important caveats.
First, the 2020–2021 data are often preliminary and subject to backward revisions. The more recent the data point, the more incomplete it usually is. Some countries only publish complete data (with a substantial delay) while others release very early and incomplete data as well. We excluded the most recent data points for some countries whenever there was an indication that the data were strongly incomplete. For the United States, we used the ‘weighted’ mortality counts from the Centers for Disease Control and Prevention (CDC) that account for undercount in recent weeks, instead of the STMF data.
Second, the completeness and reliability of all-cause mortality data varies by country. According to the United Nations Demographic Yearbook (UNSD, 2019), 71 of the countries in our dataset have a death registration coverage rate of 90% and above. In the remaining 18 countries, coverage is either estimated to be below 90% (e.g. Peru, Ecuador, Bolivia) or no estimate exists at all (Kosovo, Taiwan, Transnistria). However, some of the available coverage estimates are outdated. For example, the estimate for Bolivia is from 2000. The estimate for Peru is from 2015, i.e. before the SINADEF reform in 2016 (Vargas-Herrera et al., 2018) which has likely substantially improved the coverage. For Taiwan, Human Mortality Database estimates that the data are over 99% complete.
Third, we aimed to collect information from all countries from 2015 onward, yet currently we only have later data for five countries: Chile (2016), Germany (2016), Transnistria (2016), Peru (2017), Ireland (2018). Two further countries (South Africa and Uruguay) did not release any pre-2020 data, but instead published a forecast for 2020 based on the prior data. We included these published forecasts into the dataset as year 0.
Fourth, for most countries, the data are provided as-is, but for three countries (Brazil, Ireland, Sweden) we performed some processing to assure consistency across years, resulting in non-integer values. In Brazil there are two mortality monitoring system: ‘Registro Civil’ (RC) and ‘Sistema de Informaçāo sobre Mortalidade’ (SIM). RC is more up-to-date, whereas SIM is more complete. We used the SIM data up until May 2020 and RC data afterwards, multiplied by the ratio between total January–May 2020 deaths in SIM and in RC (1.10). For Ireland, we obtained the 2020–2021 data by scraping the http://rip.ie, following HIQA (2020). Comparing our values with HIQA values for the same weeks, our estimates were higher by about 5%, so in order to account for this we multiplied our estimates by 0.95. Sweden has a substantial number of deaths reported with an ‘unknown’ week. However, 95% of these have a known month of death. In order to account for this, we redistributed deaths with known month but unknown week uniformly across weeks, and similarly redistributed the remaining deaths with known year but unknown month.
Fifth, for three countries (Bolivia, El Salvador, Nicaragua) some of the values were taken from media reports which in turn obtained them from the respective NSOs. The exact source for each data point is given at https://github.com/akarlinsky/world_mortality.
Despite all the caveats and limitations listed above, all our data are self-consistent: the baseline mortality that we predict for 2020 agrees very well with the pre-COVID 2020 mortality in all cases. Note that our projection for 2020 uses a linear trend (see Section 2.3) and so can implicitly account for improvements in death registration. We therefore believe that for countries with possibly incomplete coverage our excess mortality estimates provide a lower bound.
2.3 Excess mortality
In order to estimate the excess mortality, we first estimated the expected, or baseline, mortality for 2020 using the historical data from 2015–2019 (or as many years from this interval as were available; see above). We fitted the following regression model separately for each country:
 Here Dt,Y is the number of deaths observed on week (or month, or quarter) t in year Y, β is a linear slope across years, αt are separate intercepts (fixed effects) for each week (month/quarter), and ϵ ∼ 𝒩 (0, σ2) is Gaussian noise. This model can capture both seasonal variation in mortality and a yearly trend over recent years due to changing population structure or socio-economic factors.
As an example, using monthly death data from Russia (R2 = 0.72, F = 10.2), we obtained  (t = 4.4), meaning that each year the number of monthly deaths decreases on average by over 2300. In contrast, using weekly data from the United States (R2 = 0.89, F = 33.4), we obtained
  = 834 (t = 14.9), meaning that each year the number of weekly deaths increases on average by over 800. In these two cases, as well as many other ones, the yearly trend was highly statistically significant, and using the average 2015–19 data as baseline would not be appropriate.
We took the model prediction for 2020 as the baseline for excess mortality calculations:
 For the countries with weekly data, the model was fit using weeks 1–52, as the week 53 only happens in rare years (including 2020). The baseline for week 53 was then taken as equal to the value obtained for week 52. We took the same baseline for 2021 as for 2020, to avoid further extrapolation.
The excess mortality in each week (or month, or quarter) was defined as the difference between the actually observed death number and the baseline prediction. Note that the excess mortality can be negative, whenever the observed number of deaths is below the baseline. We summed the excess mortality estimates across all weeks starting from the week t1 when the country reported its first COVID-19 death (for monthly data, we started summation from March 2020; for quarterly data, from the beginning of 2020). This yields the final estimate of the excess mortality:
 We computed the variance Var[Δ] of our estimator Δ as follows. Let X be the predictor matrix in the regression, y be the response matrix,
  be the vector of estimated regression coefficients, and
  be the unbiased estimate of the noise variance, where n is the sample size and p is the number of predictors. Then
  is the covariance matrix of
  and
and  is the covariance matrix of the predicted baseline values
  where X2020 is the predictor matrix for the entire 2020. We introduce vector w with elements wt of length equal to the number of rows in X2020, set all elements before t1 to zero, all elements starting from t1 to 1, and increase by 1 all elements corresponding to the existing 2021 data. Then the variance of Δ is given by
 where the first term corresponds to the uncertainty of
  and the second term corresponds to the additive Gaussian noise. We took the square root of Var[Δ] as the standard error of Δ. Whenever the fraction
  was below 1.96, we considered the excess mortality for that country to be not significantly different from zero. Note that for countries without raw historical data available (South Africa and Uruguay) we could not estimate the uncertainty. Note also that historic data for Ireland lacked week 1, so there we used weeks 2–52 for model fitting and then set the baseline for week 1 the same as for week 2 (for uncertainty calculation, w0 values were moved to w1).
There exist more elaborate statistical approaches for estimating the baseline (and thus the excess) mortality, for example modeling the seasonal variation using periodic splines, or controlling for the time-varying population size and age structure, or using a Poisson model (Farrington et al., 1996; Noufaily et al., 2013), etc. We believe that the large excess mortality seen around the world during the COVID-19 pandemic is robust to the exact model specification. Indeed, using an R package implementing the Improved Farrington model (Salmon et al., 2016) led to weekly excess mortality estimates with a correlation of 0.99 to our estimates, across all countries with weekly data available from 2015. We believe that our method achieves the compromise between flexibility and simplicity: it is the simplest approach that captures both the seasonal variation and the yearly trend, and is far more transparent than more elaborate methods. Note that our uncertainty estimation assumes iid noise in Eq. 1. In reality, the noise may be temporally or spatially autocorrelated, which would affect the variance of  . We subtracted 4,000 from the excess mortality estimates for Armenia and Azerbaijan to account for the 2020 Nagorno-Karabakh war. By official counts, it cost over 3,000 lives in Armenia and ∼3,000 in Azerbaijan (Welt and Bowen, 2021), but we took 4000 deaths in each country to obtain a conservative estimate of COVID-related excess mortality. A similar correction was done for Belgium, Netherlands, France, Luxembourg, and Germany, where our data show a peak of excess deaths in August 2020, not associated with COVID-19 (see below) and likely corresponding to a heat wave (Fouillet et al., 2006, 2008; Flynn et al., 2005). We excluded weeks 32–34 from the excess mortality calculation in these five countries. This decreased the excess mortality estimates for these countries by 1,500, 660, 1,600, 35, and 3,700, respectively. Note that some other countries may have also experienced non-COVID-related events leading to excess mortality. For example, Russian data suggest ∼ 10,000 excess deaths from a heat wave in July 2020 in Ural and East Siberia (Kobak, 2021). We do not correct for this here because it is difficult to separate July 2020 excess deaths into those due to COVID and those due to the heat wave, based on the country-level data alone.
Apart from the raw number of excess deaths, we report the number of excess deaths per 100,000 population (see below), and the number of excess deaths relative to the baseline annual deaths. For two countries (Uruguay and El Salvador), the baseline data did not cover the entire year. There we estimated the baseline annual number of deaths as the baseline number for the existing period (e.g. January–August) times the ratio of the full year length to the length of the existing period (i.e. 12/8).
2.4 Other data sources
We took the officially reported COVID-19 death counts from the Johns Hopkins University dataset (https://github.com/CSSEGISandData/COVID-19) (Dong et al., 2020) as distributed by Our World in Data. To find the number of officially reported COVID-19 deaths at the time corresponding to our excess mortality estimate, we assumed that all weekly data conform to the ISO 8601 standard, and took the officially reported number on the last day of the last week available in our dataset. Some countries use non-ISO weeks (e.g. starting from January 1st), but the difference is at most several days. ISO weeks are also assumed in the ‘Data until’ column in Table 1. We manually added officially reported numbers for the following countries and territories: Hong Kong (109; taken from Johns Hopkins University dataset directly), Macao (0), Greenland (0), Transnistria (689; taken from the Telegram channel https://t.me/novostipmrcom).
Abbreviations: “w” – weekly data, “m” – monthly data, “q” – quarterly data, “n.s.” – excess mortality was not significantly different from zero (t < 2). All numbers were rounded to two significant digits. See text for the exact definitions of all reported metrics. “Official” means the official daily reported number of COVID-19 deaths.
Note that for some countries there are different sources of official data, e.g. Russia officially reports monthly numbers of confirmed and suspected COVID deaths that are substantially larger than the daily reported numbers (Kobak, 2021). However, it is the daily reported numbers that get into the World Health Organisation and Johns Hopkins University (JHU) dashboards, so for consistency, here we always use daily values as collected by JHU. To estimate excess deaths per 100,000 population, we took the population size data from the World Bank dataset (https://data.worldbank.org/indicator/SP.POP.TOTL). The value for Russia in that dataset does not include Crimea due to its disputed status, but all Russian data of all-cause and COVID-19 mortality does include Crimea. For that reason, we used the population value of 146,748,590, provided by the Russian Federal State Statistics Service, and similarly changed the value for Ukraine to 41,762,138, provided by the Ukranian State Statistics Service. The numbers for Taiwan and Transnistria were absent in the World Bank dataset, so we used the values obtained from Wikipedia (23,568,378 and 467,400, respectively).
Note that some of the population size estimates in the World Bank dataset may be outdated or unreliable. Therefore, for some of the countries our excess death rates may be only approximate (Spoorenberg, 2020).
3 Results
3.1 Excess mortality
We collected the all-cause mortality data from 89 countries and territories into the openly-available World Mortality Dataset. This includes 47 countries with weekly data, 40 countries with monthly data, and 2 countries with quarterly data (Figure 1).
For each country we computed the total excess mortality from the beginning of the COVID-19 pandemic (Figure 2, Table 1). The excess mortality was positive and significantly different from zero in 66 countries; negative and significantly different from zero in 4 countries; not significantly different from zero (t < 2) in 17 countries. For 2 remaining countries, there was not enough historic data available in order to assess the significance (see Methods), but in one of these cases the increase in mortality was very large and clearly associated with COVID-19.

Each subplot shows baseline mortality (black), mortality in 2015–2019 (gray), in 2020 (red) and in 2021 (purple). Excess mortality is shown in red/purple shading. The numbers in each subplot are: total excess mortality (red), excess mortality per 100,000 population (black), excess mortality as a percentage of annual baseline mortality (gray), and undercount ratio of COVID-19 deaths (blue). See text for the exact definitions. “n.s.” – excess mortality not significantly different from zero (t < 2). All numbers were rounded to two significant digits. The y-axis in each subplot starts at 0 and goes until 200% where 100% corresponds to the average baseline mortality. The x-axis covers the entire year. Asterisks mark excess mortality estimates that were downwards corrected (see Methods). Countries are sorted by the excess mortality as a percentage of annual baseline mortality (gray number).
In terms of the absolute numbers, the largest excess mortality was observed in the United States (580,000 by February 21, 2021; all reported numbers here and below have been rounded to two significant digits), Russia (440,000 by Feb 28, 2021), Mexico (400,000 by Feb 14, 2021), and Brazil (390,000 by March 31, 2021 (Figure 3). Note that these estimates correspond to different time points as the reporting lags differ between countries (Table 1). Some countries showed negative excess mortality, likely due to lockdown measures and social distancing decreasing the prevalence of influenza (Kung et al., 2020). For example, Australia had − 4,500 excess deaths and New Zealand had − 1,900 deaths. In both cases, the decrease in mortality happened during the southern hemisphere winter season (Figure 2).

Each subplot shows the top 10 countries for each of our four excess mortality measures: total number of excess deaths; excess deaths per 100,000 population; excess deaths as a percentage of baseline annual mortality; undercount ratio (ratio of excess deaths to reported COVID-19 deaths by the same date). Error bars denote 95% confidence intervals corresponding to the uncertainty of the excess death estimate. Countries with population below 50,000 are not shown. Different countries have different reporting lags, so the estimates shown here correspond to different time points (Table 1). Excess mortality estimates in Armenia and Azerbaijan were downwards corrected by 4,000 to account for the war casualties (see Methods).
As the raw number of excess deaths can be strongly affected by the country’s population size, we normalized the excess mortality estimates by the population size (Table 1). The highest excess mortality per 100,000 inhabitants was observed in Peru (450), followed by some Latin American and East European countries: Mexico (320), Bulgaria (310), Russia (300), Lithuania (290), Ecuador (280), etc. (Figure 3). Note that many countries with severe outbreaks that received wide international media attention, such as Italy, Spain, and United Kingdom, had lower values (Table 1).
The infection-fatality rate (IFR) of COVID-19 is strongly age-dependent (Levin et al., 2020). As the countries differ in their age structure, the expected overall IFR differs between countries. To account for the age structure, we also normalized the excess mortality estimates by the annual baseline mortality, i.e. the expected number of deaths per year without a pandemic event (Table 1). This relative increase, also known as a P-score (Aron and Muellbauer, 2020), was by far the highest in Latin America: Peru (114%), Ecuador (63%), Bolivia (55%), and Mexico (52%) (Figure 3). These Latin American countries have much younger populations compared to the European and North American countries, which is why the excess mortality per 100,000 inhabitants there was similar to some European countries, but the relative increase in mortality was much higher, suggesting much higher COVID-19 prevalence.
3.2 Undercount of COVID deaths
For each country we computed the ratio of the excess mortality to the officially reported COVID-19 death count by the same date. This ratio differed very strongly between countries (Table 1). Some countries had ratio below 1, e.g. 0.6 in France and 0.7 in Belgium. This is likely because these countries include suspected, and not only confirmed, COVID-19 deaths into their official counts, as well as deaths from other causes in confirmed COVID-19 cases. Another reason for ratios below 1 is that the non-COVID mortality may have decreased e.g. due to the influenza suppression (see above), leading to the excess mortality underestimating the true number of COVID deaths.
Nevertheless, most countries showed ratio above 1, suggesting an undercount of COVID-19 deaths (Beaney et al., 2020). Importantly, in many different countries the correlation between weekly reported COVID-19 deaths and weekly excess deaths was very high (Figure 4). This included countries with undercount ratios below 1 (e.g. France, r = 0.79; Belgium, r = 0.89), as well as countries with undercount ratio above 1 (e.g. Spain, undercount ratio 1.2, r = 0.86; United States, undercount ratio 1.2, r = 0.74; Mexico, undercount ratio 2.3, r = 0.80; Peru, undercount ratio 2.7, r = 0.89). The correlations were often higher during the first wave alone (measured until the end of June 2020): e.g. r = 0.96 in Belgium, r = 0.87 in France, r = 0.97 in Spain. High correlations suggest that excess mortality can be fully explained by COVID-19 mortality, even when it is consistently underreported in some countries.

Nine selected countries are shown together with the Pearson correlation coefficient (r) between the two time series. Note the peak in excess mortality (but not in the reported COVID-19 deaths) associated with the August 2020 heat wave in Belgium, France, and Netherlands. Peru has two spikes in weekly COVID deaths due to backward revisions in weeks 30 and 33 of over 5000 deaths which were removed from the plot and correlation estimation.
Interestingly, in most countries the undercount ratio was not constant across time, e.g. in the United Kingdom it was above 1 during the first wave but below 1 during the second wave (Figure 4), coincidentally leading to the overall undercount of 1.0 at the time of writing. Similarly, in Spain the undercount ratio was very high during the first wave, but around 1 during the second wave, leading to the overall undercount of 1.2 at the time of writing. This decrease of the undercount ratio may be partially due to improved COVID death reporting, and partially due to the excess mortality underestimating the true COVID mortality in winter seasons due to influenza suppression (see above).
The undercount ratio typically stayed within 1–3 range (Table 1), but some countries showed much larger values. We found the highest undercount ratios in Tajikistan (100), Nicaragua (50), Uzbekistan (30), Belarus (14) and Egypt (13) (Figure 3). Such large undercount ratios strongly suggest purposeful misdiagnosing or underreporting of COVID-19 deaths, as argued by Kobak (2021) for the case of Russia (undercount ratio 5.2).
Summing up the excess mortality estimates across all countries in our dataset gives 3.3 million excess deaths. In contrast, summing up the official COVID-19 death counts gives only 2.1 million deaths, corresponding to the global undercount ratio of 1.56. It is likely that among the countries for which we could not obtain the data the undercount is much higher (Watson et al., 2020b,a; Mwananyanda et al., 2021), so we believe that 1.56 is a conservative lower bound on the global undercount ratio of COVID-19 deaths. At the time of writing, the world’s official COVID-19 death count is 2.9 million. Our results suggest that the true toll may be above 4.5 million.
4 Discussion
We presented the World Mortality Dataset — the largest international dataset of all-cause mortality, currently encompassing 89 countries. The dataset is openly available and regularly updated. Our analysis of excess mortality across the entire dataset showed that it exceeded the number of reported COVID-19 deaths by over 1.5.
The coverage and reliability of the data varies across countries, and some of the countries in our dataset may possibly report incomplete mortality numbers (e.g. covering only part of the country), see caveats in Section 2.2. This would make the excess mortality estimate during the COVID-19 outbreak incomplete. Importantly, the early pre-outbreak 2020 data for all countries in our dataset matched the baseline obtained from the historic 2015–2019 data, indicating that the data are self-consistent and the excess mortality estimates are not inflated. Another important caveat is that recent data points in many countries are known to be incomplete, and experience upwards revisions. Both factors mean that some of the excess mortality estimates reported here may be underestimations.
Our analysis supports the view that excess mortality during an epidemic outbreak can be taken as a proxy for COVID-19 mortality (Beaney et al., 2020). Indeed, countries that implemented stringent lockdown and social distancing measures in the absence of COVID-19 community spread, such as Australia and New Zealand, showed a consistent decrease in all-cause mortality, likely due to reduced influenza transmission (Kung et al., 2020). At the same time, there is evidence that lockdowns reduce violent and accidental deaths (Calderon-Anyosa and Kaufman, 2020). Together, this suggests that lockdown measures on their own decrease — and not increase — the death rate.
As a consequence, one can expect excess mortality to provide a lower bound on the true number of COVID-related deaths. In other words, whenever COVID deaths are counted perfectly, they will exceed the excess mortality, leading to undercount ratio below 1. This is indeed what we observed in several countries with strong COVID-19 outbreaks, e.g. Belgium, France, and Germany (undercount ratios 0.7, 0.6, 0.5, respectively).
It is possible that when a country experiences a particularly strong COVID outbreak, deaths from non-COVID causes may increase due the medical system being overloaded. Our data show that this did not happen in Belgium (undercount ratio during the first wave was around 1.0), despite a ∼ 100% weekly increase in all-cause mortality. However, our data do not allow to say whether this factor played a role during stronger outbreaks in Latin America, with ∼ 200% weekly increases in all-cause mortality. Even if it did, then such collateral excess deaths can nevertheless be seen as indirect consequence of COVID-19 outbreaks.
An important caveat is that excess mortality can have non-COVID contributions if a country in 2020–21 experienced some drastic events unrelated to the pandemic. Three examples in our data are the August 2020 heat wave in Belgium and surrounding countries (that led to excess mortality spikes in five countries, with ∼ 7,500 deaths in total) and the 2020 Nagorno-Karabakh war between Armenia and Azerbaijan, which cost, by official counts, ∼ 3000 lives on each side. We made a correction to our excess mortality estimates to account for these factors (see Methods), but could have possibly missed some other similar events in other countries. However, even if so, we believe these factors could only play a minor role compared to COVID-19, thanks to the absence of other major wars or natural disasters in 2020–21.
The World Mortality Dataset is open for use by researchers and policy makers from all fields. Avenues for future research include the relation between various measures of excess mortality and economic development, population structure, lockdown and social distancing measures, border controls and travel restrictions (Hale et al., 2020), properties of the health-care systems, vaccinations, institutional quality (e.g. the Democracy Index), climate, geography, population density, and many more. Conversely, future research can use excess mortality estimates to study negative social or economic impact of high COVID-19 death toll.
So far we were able to collect data from 89 nations out of ∼ 200, with particularly sparse coverage in Africa, Asia, and Middle East (Figure 1), where the undercount of COVID deaths may be particularly severe (Watson et al., 2020b,a; Mwananyanda et al., 2021). The COVID-19 pandemic highlighted the great importance of reliable and up-to-date all-cause mortality data. Just as countries around the world collect and regularly report estimates of economic output such as the gross domestic product (GDP), and just as they have been reporting COVID-19 mortality, a comprehensive multi-national repository of all-cause mortality is long overdue (Leon et al., 2020).
Data and code availability
The World Mortality Dataset is available at https://github.com/akarlinsky/world_mortality. The analysis code is available at https://github.com/dkobak/excess-mortality. Our baseline estimates for all countries and all values shown in Table 1 are available there as CSV files.
Author contributions
AK collected the data. AK and DK analyzed the data. AK and DK wrote the paper.
Acknowledgments
The authors would like to thank colleagues at Kohelet Policy Forum, Frédéric Fleury-Payeur, Michael Beenstock, and Maxim S. Pshenichnikov for their helpful comments and G. J. Andrés Uzín P., Luis Salas, Marcelo Oliveira, Otavio Ranzani, Mario Romero Zavala, Laurianne Despeghel, reporters from Eurasianet, Dmitri Tokarev, Michael Hilliard, Andrés N. Robalino, and Gilad Gaibel for their help in obtaining some of the data.
DK was supported by the Deutsche Forschungsgemeinschaft (BE5601/4-1 and the Cluster of Excellence “Machine Learning — New Perspectives for Science”, EXC 2064, project number 390727645), the Federal Ministry of Education and Research (FKZ 01GQ1601 and 01IS18039A) and the National Institute of Mental Health of the National Institutes of Health under Award Number U19MH114830. The content is solely the responsibility of the authors and does not necessarily represent the official views of the National Institutes of Health.
Footnotes
ariel.karlinsky{at}mail.huji.ac.il, dmitry.kobak{at}uni-tuebingen.de
Added 10 more countries and territories, updated time frame of data, and revised text according to comments from colleagues.
References


