
Abstract
Comparing the impact of the COVID-19 pandemic between countries or across time is difficult because the reported numbers of cases and deaths can be strongly affected by testing capacity and reporting policy. Excess mortality, defined as the increase in all-cause mortality relative to the recent average, is widely considered as a more objective indicator of the COVID-19 death toll. However, there has been no central, frequently-updated repository of the all-cause mortality data across countries. To fill this gap, we have collected weekly, monthly, or quarterly all-cause mortality data from 77 countries, openly available as the regularly-updated World Mortality Dataset. We used this dataset to compute the excess mortality in each country during the COVID-19 pandemic. We found that in the worst-affected countries the annual mortality increased by over 50%, while in several other countries it decreased by over 5%, presumably due to lockdown measures decreasing the non-COVID mortality. Moreover, we found that while some countries have been reporting the COVID-19 deaths very accurately, many countries have been underreporting their COVID-19 deaths by an order of magnitude or more. Averaging across the entire dataset suggests that the world’s COVID-19 death toll may be at least 1.6 times higher than the reported number of confirmed deaths.
Introduction
The impact of COVID-19 on a given country is usually assessed via the number of cases and the number of COVID-19 deaths, two statistics that have been reported daily by each country and put together into international dashboards such as the one maintained by the Johns Hopkins University (Dong et al., 2020). However, both metrics can be heavily affected by limited testing availability and by different definitions of ‘COVID-19 death’ used by different countries: some countries count only confirmed COVID-19 deaths, some include suspected COVID-19 deaths or deaths from other causes in confirmed COVID-19 cases. The emerging consensus is that the most objective indicator of the COVID-19 death toll, even refered to as a ‘gold standard’, is the excess mortality (Beaney et al., 2020; Leon et al., 2020), defined as the increase of the all-cause mortality over the historic average. Excess mortality has been used to estimate the COVID-19 impact in different countries, both in academic literature (e.g. Kontis et al., 2020; Alicandro et al., 2020; Ghafari et al., 2020; Woolf et al., 2020a,b; Weinberger et al., 2020; Blangiardo et al., 2020; Kobak, 2021) and by major media outlets.
Measuring excess mortality across different countries requires, first and foremost, a comprehensive and regularly-updated dataset on all-cause mortality. However, there is currently no single resource where such data would be collected from all over the world. The World Mortality Dataset presented here aims to fill this gap by combining publicly-available information on country-level mortality, culled and harmonized from various sources.
Several teams have already started to collect such data. In April 2020, EuroStat (http://ec.europa.eu/eurostat) began collecting total weekly deaths across European countries, “in order to support the policy and research efforts related to COVID-19.” At the time of writing, this dataset covers 36 European countries. In May 2020, the Human Mortality Database (http://mortality.org), a joint effort by the University of California, Berkeley, and Max Planck Institute for Demographic Research, started cooperating with National Statistics Offices (NSOs) and other national institutions in compiling the Short Term Mortality Fluctuations (STMF) dataset (STMF, 2021). This dataset consists of weekly data, disaggregated by five age groups and by sex, and contains 35 countries with data pertaining to 2020. Both datasets are regularly updated and have considerable overlap, covering together only 44 countries.
In parallel, the United Nations, through its UNDATA initiative (http://data.un.org; search for ‘Deaths by month of death’), collects monthly mortality data across a large number of countries. However, information there is not regularly updated, with January–June 2020 data currently available for only two countries.
Media outlets such as the Financial Times, The Economist, the New York Times and the Wall Street Journal have been compiling and openly sharing their own datasets in order to report on the all-cause mortality in 2020. However, these datasets are infrequently updated and their future is unclear. For example, the New York Times announced in early 2021 that they would stop tracking excess deaths due to staffing changes.
Here, we present the World Mortality Dataset that aims to provide regularly-updated all-cause mortality numbers from all over the world. The dataset is openly available at https://github.com/akarlinsky/world_mortality and is updated almost daily. Our dataset builds upon the EuroStat and the STMF datasets, adding 32 additional countries — many more than any previous media or academic effort. At the time of writing, our dataset comprises 77 countries. Our analysis shows statistically-significant positive excess mortality in 51 out of 77 countries. Moreover, it suggests that the true COVID-19 death toll in several countries is over an order of magnitude larger than the official COVID-19 death count.
Methods
World Mortality Dataset
For all countries that are not covered by EuroStat or STMF, we aimed to collect the all-cause mortality data from their National Statistics Offices (NSOs), Population Registries, Ministries of Health, Ministries of Public Health, etc., collectively referred to here as ‘NSOs’.
Our strategy was to search for mortality numbers for every country on their NSO’s website. The data may be present in the form of a spreadsheet, a table generator, a periodical bulletin, a press release, etc. If we were unable to locate such data, we contacted the NSO via email, via a contact form on their website, or on social media, asking them if they have weekly, monthly, or quarterly data on all-cause mortality for 2020. Overall, 44 countries had data in STMF or EuroStat, and 26 had their data available on their NSOs’ websites. Queries were then sent to 90 countries, 7 of which replied with the requested information and are included in the World Mortality Dataset. For the rest, some replied that data is not available, and from some, we are still awaiting response. We intend to update the World Mortality Dataset if and when we obtain the data.
Responses from NSOs varied substantially. Some have provided us with the requested information, some replied that no such data were available, some did not respond at all. For many countries, the email addresses did not work and returned an error message. Here are some representative examples of the declining responses: “Due to the federal organization of our country, we don’t have 2020 mortality data available yet” (Argentina); “We are sorry to inform you that we do not have the data you requested” (China); “These are not available” (India); “Unfortunately we don’t have this data. Currently, we only have the number of people dying from traffic accidents (by month)” (Vietnam); “Unfortunately, we do not have a mechanism in place at the moment to capture routine mortality data in-country nation-wide […] As you may also be aware, death or mortality registration or reporting is yet a huge challenge in developing countries […]” (Liberia).
We included the data into our dataset if it satisfied the following inclusion criteria: (1) data were in weekly, monthly or quarterly format (we preferred weekly data whenever available); (2) data existed at least until June 2020; (3) there were data for at least one entire year before 2020 (or a forecast for 2020, see below). At the time of writing, our dataset comprises 77 countries (Figure 1).

Countries in World Mortality Dataset are shown in blue. Hong Kong, Israel, Mauritius and Singapore are shown as points due to their small geographical size.
We only collected country-level data, without age or gender stratification. In some cases, we combined several data sources, for example taking the 2015–2018 monthly data from UNDATA and 2019–2020 monthly data form a country’s NSO. A detailed description of the data sources for each country can be found on the dataset’s website at https://github.com/akarlinsky/world_mortality.
Note that the 2020–2021 data are often preliminary and are subject to backward revisions. The more recent the data point, the more incomplete it usually is. Some countries only publish complete data (with a substantial delay) while others release very early and incomplete data as well. We excluded the most recent data points for some countries whenever there was an indication that the data were strongly incomplete. For the United States, we used the ‘weighted’ mortality counts from the Centers for Disease Control and Prevention (CDC) that account for undercount in recent weeks.
Several countries do not release any data prior to 2020, but instead publish a forecast for 2020 based on prior data (Mexico, South Africa, Uruguay). In these cases, we included these published forecasts into the dataset. In our analysis below, we treated such forecasts as if they were data from 2019 (South Africa and Uruguay) or 2018 (Mexico).
The data for Iran are available in quarterly format, where quarters start on December 21, March 21, June 21, and September 21 (Solar Hijri seasons). We treated the season starting on December 21 as the first data point for the following year.
Excess mortality
In order to estimate the excess mortality, we first estimated the expected, or baseline, mortality for 2020 using the historical data from 2015–2019 (or as many years from this interval as were available). We fitted the following regression model separately for each country:
 Here Dt,Year is the number of deaths observed on week (or month, or quarter) t in year Year, β is a linear slope across years, αt are separate intercepts (fixed effects) for each week (month/quarter), and ϵ∼N(0, σ2) is Gaussian noise. This model can capture both seasonal variation in mortality and a yearly trend over recent years due to changing population structure or socio-economic factors.
As an example, using monthly death data from Russia (R2 = 0.72, F = 10.2), we obtained (t = 4.4), meaning that each year the number of monthly deaths decreases by over 2000. In contrast, using weekly data from the United States (R2 = 0.89, F = 33.4), we obtained
  meaning that each year the number of weekly deaths increases by over 800. In these two, as well as many other cases, the yearly trend was highly statistically significant.
We took the model prediction for 2020 as the baseline for excess mortality calculations:
 For the countries with weekly data, the model was fit using weeks 1–52, as the week 53 only happens in rare years (including 2020).1 The baseline for week 53 was then taken as equal to the value obtained for week 52. We took the same baseline for 2021 as for 2020, to avoid further extrapolation.
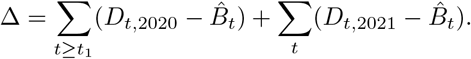
The excess mortality in each week (or month, or quarter) was defined as the difference between the actually observed death number and the baseline prediction. Note that the excess mortality can be negative, whenever the observed number of deaths is below the baseline. We summed the excess mortality estimates across all weeks starting from the week t1 when the country reported its first COVID-19 death (for monthly data, we started summation from February 2020 for Hong Kong and from April 2020 for other countries2; for quarterly data, from the beginning of 2020). This yields the final estimate of the excess mortality:
 We computed the variance Var[Δ] of our estimator Δas follows. Let X be the predictor matrix, y be the response matrix,
  be the vector of estimated regression coefficients, and
  be the unbiased estimate of the noise variance, where n is the sample size and p is the number of predictors. Then Cov
 is the covariance matrix of
  and
and  is the covariance matrix of predicted baseline values
  where X2020 is the predictor matrix for the entire 2020. We introduce vector w with elements wt of length equal to the number of rows in X2020, set all elements before t1 to zero, all elements starting from t1 to 1, and increase by 1 all elements corresponding to the existing 2021 data. Then the variance of Δis given by
 where the first term corresponds to the uncertainty of
  and the second term corresponds to the additive Gaussian noise. We took the square root of Var[Δ] as the standard error of Δ. Whenever the fraction
  was below 1.96, we considered the excess mortality for that country to be not significantly different from zero. Note that for countries where we had only one year of mortality data (or a forecast) prior to 2020 (e.g. Kazakhstan, Mexico, South Africa, Uruguay, etc.) we could not estimate the uncertainty.
Other approaches are possible for estimating the baseline (and thus the excess) mortality, for example modeling the seasonal variation using periodic splines, or controlling for the time-varying population size and age structure, or using a Poisson model, or replacing the model by a simple arithmetic mean, etc. Ours is the simplest approach that captures both the seasonal variation and the yearly mortality trend. We believe that the large excess mortality seen around the world during the COVID-19 pandemic is robust to the exact model specification.
We subtracted 4,000 from the excess mortality estimates for Armenia and Azerbaijan to account for the 2020 Nagorno-Karabakh war. By official counts, it cost over 3,000 lives in Armenia and ∼3,000 in Azerbaijan (Wikipedia, 2021), but we took 4000 deaths in each country to obtain a conservative estimate of COVID-related excess mortality. A similar correction was done for Belgium, where our data show a peak of excess deaths in August 2020, likely corresponding to the heat wave. This peak comprised around 1,500 deaths, so we subtracted 1,500 from the excess mortality estimate in Belgium.
Other data sources
We took the officially-reported COVID-19 death counts from the Johns Hopkins University dataset (https://github.com/CSSEGISandData/COVID-19) (Dong et al., 2020). To find the number of officially-reported COVID-19 deaths at the time corresponding to our excess mortality estimate, we assumed that all weekly data conform to the ISO 8601 standard, and took the officially-reported number on the last day of the last week available in our dataset. Some countries use non-ISO weeks (e.g. starting from January 1st), but the difference is at most several days. ISO weeks are also assumed in the ‘Data until’ column in Table 1.
Abbreviations: “w” – weekly data, “m” – monthly data, “q” – quarterly data, “n.s.” – excess mortality was not significantly different from zero (t < 2). All numbers have been rounded to two significant digits. See text for the exact definitions of all reported metrics. “Official” means the official daily reported number of COVID-19 deaths.
We took the population data from the World Bank dataset (https://data.worldbank.org/indicator/SP.POP.TOTL). The value for Russia in that dataset does not include Crimea, but all Russian data of all-cause and COVID-19 mortality does include Crimea. For that reason, we used the population value of 146,751,300, provided by the Russian Federal State Statistics Service. The number for Taiwan was absent in the World Bank dataset, so we used the 23,568,378 value from Wikipedia.
In this manuscript, we treat Taiwan and Hong Kong as separate countries. They release monthly all-cause mortality data, whereas China does not.
Results
We collected the all-cause mortality data from 77 countries into the openly-available World Mortality Dataset. This includes 50 countries with weekly data, 25 countries with monthly data, and 2 countries with quarterly data.
For each country we computed the total excess mortality from the beginning of the COVID-19 pandemic (Figure 2, Table 1). The excess mortality was positive and significantly different from zero in 51 countries; negative and significantly different from zero in 6 countries; not significantly different from zero (t < 2) in 15 countries. For 5 remaining countries, there was not enough historic data available in order to assess the significance (see Methods), but in 4 out of 5 cases the increase in mortality was very large and clearly associated with COVID-19.

Each subplot shows baseline mortality (black), mortality in 2015–2019 (gray), in 2020 (red) and in 2021 (purple). Excess mortality is shown in red/purple shading. The numbers in each subplot are: total excess mortality (red), excess mortality per 100,000 population (black), excess mortality as a percentage of annual baseline mortality (gray), and undercount of COVID-19 deaths (blue). See text for the exact definitions. “n.s.” – excess mortality not significantly different from zero (t < 2). All numbers were rounded to two significant digits. The y-axis in each subplot starts at 0. The x-axis covers the entire year. Asterisks mark excess mortality estimates that were downwards corrected (see Methods).
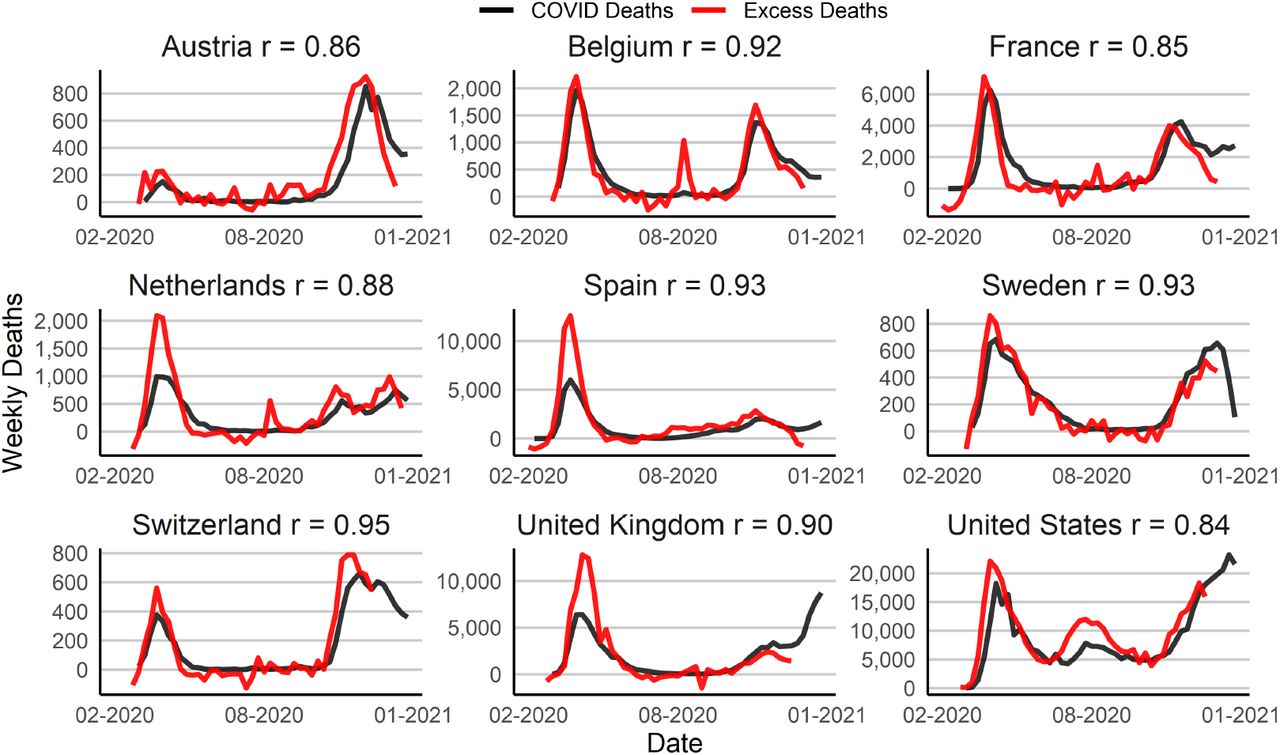
in several selected countries. Each subplot’s title also includes the country level Pearson correlation coefficient between the two series
In terms of the absolute numbers, the largest excess mortality was observed in the United States (420,000 by January 3, 2021; all reported numbers here and below have been rounded to two significant digits), in Mexico (270,000 by December 13, 2020) and in Russia (270,000 by November 30, 2020). Note that these estimates correspond to different time points as the reporting lags differ between countries (Table 1). Some counties showed negative excess mortality, likely due to lockdown measures and social distancing decreasing the prevalence of influenza (Kung et al., 2020). For example, Australia had −4,700 excess deaths and New Zealand had −2,100 deaths. In both cases, the decrease in mortality happened during the southern hemisphere winter season (Figure 2).
As the absolute number of excess deaths can be strongly affected by the country’s population size, we normalized the excess mortality estimates by the population size (Table 1). The highest excess mortality per 100,000 inhabitants was observed in Peru (290), Bolivia (260), Bulgaria (250), Ecuador (230), Lithuania (230), and Mexico (210). Note that many countries with severe outbreaks that received wide international media attention, such as Italy, Spain, and United Kingdom, had much lower values (Table 1).
The infection-fatality rate (IFR) of COVID-19 is strongly age-dependent (Levin et al., 2020). As the countries differ in their age structure, the expected overall IFR differs between countries. To account for the age structure, we also normalized the excess mortality estimate by the annual baseline mortality, i.e. the expected number of deaths per year without a pandemic event (Table 1). This relative increase (also known as a p-score) was the highest in Peru (73%), Bolivia (56%), Ecuador (52%), and Mexico (39%). These Latin American countries have much younger populations compared to the European and North American countries, which is why the excess mortality per 100,000 inhabitants there was similar to some European countries, but the relative increase in mortality was much higher, suggesting much higher COVID-19 prevalence. These Latin American countries were followed by Kazakhstan (22%), Kyrgyzstan (19%), and South Africa (19%).
Finally, for each country we computed the ratio of the excess mortality to the officially-reported COVID-19 death count by the same date. This ratio differed very strongly between countries (Table 1). Some countries had ratio below 1, e.g. 0.8 in France and 0.9 in Belgium. This is likely because these countries include suspected, and not only confirmed, COVID-19 deaths into their counts, as well as deaths from other causes in confirmed COVID-19 cases. But most countries showed ratio above 1, suggesting an undercount of COVID-19 deaths (Beaney et al., 2020). Importantly, in many different countries the correlation between weekly reported COVID-19 deaths and weekly excess deaths was very high (Figure ??). This included countries with undercount ratio at 1 or below (e.g. France, r = 0.85; Belgium, r = 0.92), as well as countries with undercount above 1 (e.g. Spain, undercount 1.5, r = 0.93; United States, undercount 1.2, r = 0.84). High correlations suggest that excess mortality can be fully explained by COVID-19 mortality, even when it is consistently underreported in some countries.
The undercount ratio typically stayed within 1–3 range (Table 1), but some countries showed much larger values. We found the highest undercounts in Uzbekistan (30), Kazakhstan (12), Belarus (15), Egypt (13), and Russia (6.7). Such large undercount ratios strongly suggest purposeful misdiagnosing or underreporting of COVID-19 deaths (Kobak, 2021).
Summing up the excess mortality estimates across all countries in our dataset gives 2.1 million excess deaths. In contrast, summing up the official COVID-19 death counts gives only 1.3 million deaths, corresponding to the global undercount of 1.6 million deaths. It is likely that among the countries for which we could not obtain the data the undercount could be even higher, so we believe that 1.6 is a lower bound on the global undercount of COVID-19 deaths. At the time of writing, the world’s official COVID-19 death count is 2.1 million. Our results suggest that the true toll may be above 3.3 million.
Discussion
In this paper, we presented the World Mortality Dataset — the largest international dataset of all-cause mortality, currently encompassing 77 countries. The dataset is openly available and will be regularly updated. Our analysis of excess mortality across the entire dataset showed that it exceeded the number of reported COVID-19 deaths by over 1.5.
Our data and analysis support the view that excess mortality during an epidemic outbreak can be taken as a proxy for COVID-19 mortality (Beaney et al., 2020). Indeed, countries that implemented stringent lockdown and social distancing measures in the absence of COVID-19 community spread, such as Australia and New Zealand, showed a consistent decrease in all-cause mortality, likely due to reduced influenza transmission (Kung et al., 2020), suggesting that lockdown measures on their own decrease — and not increase — the death rate. This is in agreement with the evidence that lockdowns reduce violent and accidental deaths (Calderon-Anyosa and Kaufman, 2020). Together, this suggests that lockdowns do not contribute to excess mortality. On the other hand, some countries with a severe COVID-19 outbreak reported more COVID-related deaths than the value of excess mortality (e.g. France and Belgium, with undercount ratio below 1), strongly suggesting that most excess deaths even during the local epidemic outbreak are due to COVID-19. In fact, these arguments show that excess mortality may even underestimate the COVID-19 death toll.
The main limitation of our work is that up until now, we were only able to collect data from 77 nations out of∼200, with particularly sparse coverage in Africa (Figure 1). Furthermore, for some of these countries the latest data points are from June 2020. The COVID-19 pandemic has shown that extrapolating mortality data into the future can be risky: for example, excess mortality in Czechia stayed around zero up until September 2020, but has risen very quickly since then (Figure 2).
Another caveat is that excess mortality can have non-covid contributions if a country experienced drastic events in 2020 or 2021 unrelated to the pandemic. Three examples in our data are the August 2020 heat wave in Belgium (excess mortality of ∼1500) and the 2020 Nagorno-Karabakh war between Armenia and Azerbaijan, which cost, by official counts,∼3000 lives on each side. We made a correction to our excess mortality estimates to account for that (see Methods), but could have possibly missed some other similar events in other countries.
Some countries may possibly report incomplete mortality numbers (e.g. covering only part of the country) which would make the excess mortality estimate during the COVID-19 outbreak incomplete. Importantly, the early pre-outbreak 2020 data for all countries in our dataset matched well to the baseline obtained from the historic 2015–2019 data, indicating that the data are self-consistent and the excess mortality estimates are not inflated.
The World Mortality Dataset is open for use by researchers and policy makers from all fields. Avenues for future research include the relation between various measures of excess mortality and economic development, population structure, lockdown and social distancing measures, border controls and travel restrictions (Hale et al., 2020) properties of the health-care systems, institutional quality (e.g. the Democracy Index), climate, geography, population density, and many more. Conversely, future research can use excess mortality estimates to study negative social or economic impact of high COVID-19 death toll.
COVID-19 has spread over the world in 2020, but the end of the year did not mark its end. Early all-cause mortality data from 2021, analyzed here, shows continuing high rate of excess mortality in countries as diverse as Latvia, Peru, and South Africa. The World Mortality Dataset will continue to track all-cause mortality throughout 2021. We believe that the COVID-19 pandemic showed the great importance of reliable and up-to-date all-cause mortality data. Just as countries around the world collect and regularly report estimates of economic output such as the gross domestic product (GDP), and just as they have been reporting COVID-19 mortality, a comprehensive multi-national repository of all-cause mortality is long-overdue (Leon et al., 2020).
Data Availability
The dataset is available at https://github.com/akarlinsky/world_mortality The analysis code is available at https://github.com/dkobak/excess-mortality
Data and code availability
The dataset is available at https://github.com/akarlinsky/world_mortality. The analysis code is available at https://github.com/dkobak/excess-mortality.
Author contributions
AK collected the data. AK and DK analyzed the data. AK and DK wrote the paper.
Acknowledgments
DK was supported by the Deutsche Forschungsgemeinschaft (BE5601/4-1 and the Cluster of Excellence “Machine Learning — New Perspectives for Science”, EXC 2064, project number 390727645), the Federal Ministry of Education and Research (FKZ 01GQ1601 and 01IS18039A) and the National Institute of Mental Health of the National Institutes of Health under Award Number U19MH114830. The content is solely the responsibility of the authors and does not necessarily represent the official views of the National Institutes of Health.
Footnotes


