
Abstract
Non-pharmaceutical interventions (NPIs) to mitigate the spread of SARS-CoV-2 were often implemented under considerable uncertainty and a lack of scientific evidence. Assessing the effectiveness of the individual interventions is critical to inform future preparedness response plans. Here we quantify the impact of 4,579 NPIs implemented in 76 territories on the effective reproduction number, Rt, of COVID-19. We use a hierarchically coded data set of NPIs and propose a novel modelling approach that combines four computational techniques, which together allow for a worldwide consensus rank of the NPIs based on their effectiveness in mitigating the spread of COVID-19. We show how the effectiveness of individual NPIs strongly varies across countries and world regions, and in relation to human and economic development as well as different dimensions of governance. We quantify the effectiveness of each NPI with respect to the epidemic age of its adoption, i.e., how early into the epidemics. The emerging picture is one in which no one-fits-all solution exists, and no single NPI alone can decrease Rt below one and that a combination of NPIs is necessary to curb the spread of the virus. We show that there are NPIs considerably less intrusive and costly than lockdowns that are also highly effective, such as certain risk communication strategies and voluntary measures that strengthen the healthcare system. By allowing to simulate “what-if” scenarios at the country level, our approach opens the way for planning the most likely effectiveness of future NPIs.
1 Introduction
In the absence of vaccines and antiviral medication, non-pharmaceutical interventions (NPIs) implemented in response to epidemic respiratory viruses are the only option to delay and moderate the spread of the virus in a population 1.
Confronted with the worldwide COVID-19 epidemic, most governments implemented bundles of highly restrictive, sometimes intrusive NPIs. Decisions had to be taken under rapidly changing epidemiological situations, despite a dramatic lack of scientific evidence on the individual and combined effectiveness of these measures 2, 3, degree of compliance of the population, and societal impact.
This strategy can be compared with hitting the infection curve with a blunt sledgehammer, hoping that some of the interventions might suppress transmission to a degree that drives the effective reproduction number, Rt (the average number of new infections caused by one infected individual), below one. The lack of data-driven evidence in support for the implemented NPIs may be best exemplified by the conflicting recommendations on the use of face masks. Both, the World Health Organization (WHO) and the German Robert Koch Institute (RKI) reversed their initial recommendations against masks after new evidence appeared, suggesting that optimum use of face masks is associated with a large reduction in risk of COVID-19 infection 4.
Government interventions may cause significant societal and economic damages and may affect individuals’ behaviour, mental health and social security 5. Therefore, knowledge on the most effective NPIs would allow stakeholders to judiciously and timely implement a package of key interventions to combat a potential resurgence of COVID-19 or any other future respiratory outbreak. As many countries rolled out several NPIs simultaneously, the challenge of disentangling the impact of each individual intervention arises.
To date, studies of the country-specific progression of the COVID-19 pandemic 6 have mostly explored the independent effects of a single category of interventions. These categories include travel restrictions 2, 7, social distancing 8–14, or personal protective measures 11. Some studies focused on a single country or even a town 14–18. Some research has combined data from multiple countries but has pooled NPIs into rather broad categories 10, 19, which eventually limits the assessment of specific, potentially critical NPIs, that may be less costly and more effective than others.
Using a comprehensive, hierarchically coded, data set of 4,579 NPIs implemented in 76 territories 20, here we analyse the impact of government interventions on Rt, using harmonised results from a new multi-method approach consisting of (i) a case-control analysis (CC), (ii) a step function approach to LASSO time-series regression (LASSO), (iii) random forests (RF) and (iv) recurrent neural networks (RNN). We also investigate country-based control strategies as well as the impact of some selected country-specific metrics. We finally focus on the highly controversial nation-wide (or state-wide) lockdowns and investigate the relevance of this measure with respect to the timeliness of its implementation.
All approaches (i-iv) yield comparable rankings of the effectiveness of different categories of NPIs across their hierarchical levels. This remarkable agreement allows us to identify a consensus set of specific NPIs that lead to a significant reduction of Rt. Further, we evaluate the heterogeneity of the effectiveness of individual NPIs in different territories. We find that time of implementation, already implemented measures, different dimensions of governance, as well as human and social development affect the effectiveness of NPIs to varying degrees.
2 Results
Global approach
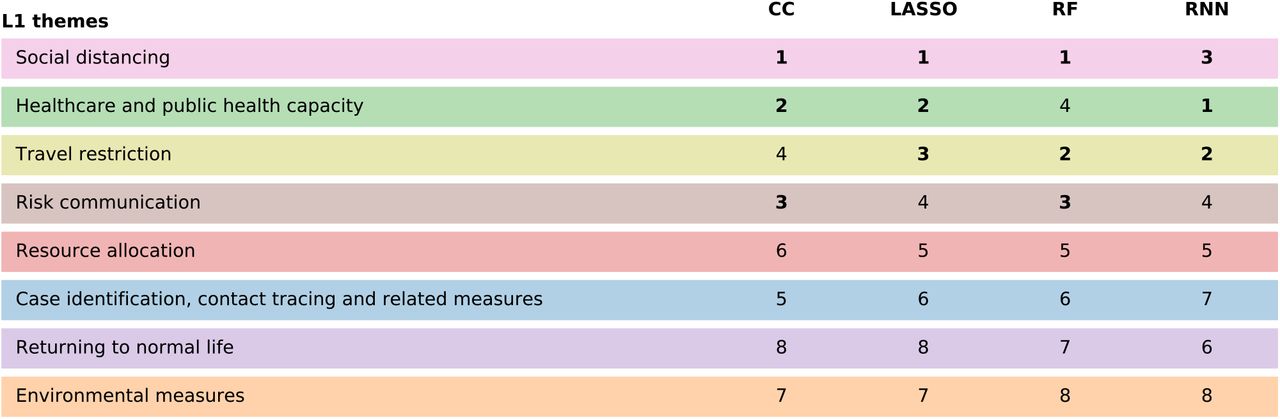
Our results are based on a consolidated version of the CCCSL (CSH COVID19 Control Strategies List) 20. This data set provides a hierarchical taxonomy of NPIs on four levels: eight broad themes (level 1, L1) are divided into 53 categories of individual NPIs (level 2, L2) that include hundreds of subcategories (level 3, L3) and additional group codes (level 4, L4). In Figure 1 we compare the results for the NPIs’ effectiveness rankings for the four methods of our approach (i-iv) on L1 (themes); see Methods for how these ranks were obtained. A clear picture emerges: the themes of social distancing, healthcare & public health capacity, travel restrictions, and risk communication score as the top four intervention types in all methods. Social distancing is the highest ranked theme of NPIs in all but one method.

Comparison of effectiveness rankings on the coarsest hierarchical level for the case-control analysis (CC), LASSO regression (LASSO), random forest regression (RF), and recurrent neural network analysis (RNN). All methods indicate that NPIs belonging to the themes of social distancing, healthcare & public health capacity, risk communication, and travel restrictions lead to the most significant reductions of Rt (these themes are ranked within the top four themes in all approaches).
We next compare results obtained on L2 of the NPI data set, i.e., using the 53 individual NPI categories. A substantial number of interventions has a significant effect on Rt for the majority of the methods, see Figure 2 and Table 1. Seven NPI categories show significant impacts on Rt in all four methods (given the number of significant results in each method, we would expect an overlap of 1.65 under completely unrelated results) while three out of four methods identify the same 14 NPI categories as significant. The pairwise Pearson correlations between the methods range between 0.3 and 0.7, with p-values between p = 0.029 and p < 10−8. Similar results hold for Spearman’s correlation. In Table S2 we list the subcategories (L3) belonging to the seven consensus categories.

Decrease in the effective reproduction number, ΔRt, for the various NPIs at L2, as quantified by case-control analysis (CC), LASSO, and the recurrent neural network (RNN) regression. The left panel shows the combined 95% confidence interval of ΔRt for the most effective interventions across all included territories. The heatmap in the right panel shows the corresponding Z-scores of the measure effectiveness as determined by the four different methods. NPIs are ranked according to the number of methods agreeing on their impacts, from top (significant in all methods) to bottom (ineffective in all analyses). L1 themes are colour-coded as in Figure 1.
Comparison of effectiveness rankings on L2. Out of the 53 different NPI categories, all four methods show significant results for seven NPIs (consensus 4); three methods agree on seven further NPIs (consensus 3). We report the average normalized score, the observed reduction in Rt for the various methods and the NPI importance for the random forest. The numbers in brackets give the amount by which the last digit of the corresponding number outside the brackets fluctuates within the 95% confidence interval.
A normalised score for each NPI category is obtained by rescaling the result of each method to range between zero (least effective) and one (most effective) and then averaging this score. The maximal (minimal) NPI score is therefore 100% (0%), meaning that the measure is the most (least) effective measure in each method. Amongst the seven consensual NPI categories, the largest impacts on Rt are displayed by the closure of educational institutions (with a score of 85% and estimates for ΔRt ranging from −0.064 to −0.34), small gathering cancellations (72%, ΔRt between −0.082 and -0.23) and border restrictions (57%, ΔRt between −0.024 and -0.24). We find seven other NPI categories consensually in three of our methods. These include risk communication activities to inform and educate the public (65%, ΔRt between −0.066 and -0.31) and mass gathering cancellations (51%, ΔRt between −0.032 and -0.27).
In Figure 3 we visualise the findings on the NPIs’ effectiveness in a co-implementation network 20. Nodes correspond to categories (L2) with a size being proportional to their normalised score. Directed links from i to j indicate a tendency that countries implement NPI j after they implemented i. The network therefore illustrates the typical NPI implementation sequence of the 53 countries and the steps within this sequence that contribute most to a reduction of Rt. For instance, there is a pattern where countries first cancel mass gatherings before moving on to cancellations of specific types of small gatherings, where the latter associates on average with more substantial reductions in Rt. Education and active communication is a powerfully effective early measure (implemented around 15 days before 30 cases were reported). Most social distancing and travel restriction measures (i.e., closure of educational institutions, work safety protocols, cordon sanitaire, individual movement restrictions, complete lockdown) are typically implemented within the first two weeks after reaching 30 cases with varying impacts; see also Figure 2.

Time-ordered NPI co-implementation network across countries. Nodes are categories (L2) with colour indicating the theme (L1) and size being proportional to the average effectiveness of the intervention. Arrows from nodes i to j represent that countries which have already implemented intervention i tend to implement intervention j later in time. Nodes are positioned vertically according to their average time of implementation (measured relative to the day where the country reached 30 confirmed cases) and horizontally according to their L1 theme.
By analysing the third and fourth levels of the coding hierarchy, the CC approach makes it possible to assess the effectiveness of NPIs related to the use of face masks. Increasing the availability of face masks for healthcare professionals shows a significant impact on the Rt (ΔRt = −0.07(1)). There is also a considerable effect of communicating with the public and promoting the use of face masks (ΔRt = −0.19(2)). However, their mandatory use in public settings shows a weaker effect (ΔRt = −0.13(3)). These three mask-related NPIs have typically been implemented at different times of the epidemic. Promoting the use of face masks started on average three days after 30 cases were counted in a country, measures to increase their availability in healthcare settings were implemented 11 days afterwards, and the mandatory use of face masks in public environments came 22 days later.
Country-level approach
A sensitivity check of our results with respect to the removal of individual continents from the analysis also indicates substantial variations between different regions of the world in terms of NPI effectiveness, see SI. To further quantify how much the effectiveness of an NPI depends on the particular territory (country or US state) where it has been introduced, we measure the heterogeneity of the NPI rankings in different territories through an entropic approach in the RNN method; see Methods. Fig. 4 shows the normalised entropy of each NPI category versus its rank. A value of entropy close to zero implies that the corresponding NPI has a similar rank relative to all other NPIs in all territories. In other words, the effectiveness of the NPI does not depend on the specific country or state. On the contrary, a high value of the normalised entropy signals that the same NPI performs very differently in different regions.

Normalised entropy vs rank for all the NPIs at L2. Each NPI name is coloured according to its theme of belonging (L1) as indicated in the legend. The blue curve represents the same information obtained out of a reshuffled data set of NPIs.
The values of the normalised entropies for many NPIs are far from being one and below the corresponding values obtained through a temporal reshuffling of the NPIs in each country. The effectiveness of many NPIs therefore is, first, significant and, second, heavily dependent on the local context, which is a combination of socio-economic features and NPIs already adopted. We further explore this interplay of NPIs with socio-economic factors by analysing the effects of demographic and socio-economic covariates, as well as indicators for governance, human and economic development in the CC method, see Supplementary Information (SI). We find a robust tendency that NPIs are less effective in countries with high levels of human development (as quantified by the Human Development Index), governance-related accountability and political stability (as quantified by World Governance Indicators provided by the World Bank).
We then focus on the whether the efficacy of specific NPI depends on its epidemic age, i.e., how early it was adopted in each specific country. Without loss of generality, here we focus on the NPI of a National lockdown (or State lockdown in the US) and we refer to the SI for the complete treatment of all the other NPIs. As it is known, the complete lockdown triggered a lot of debates about its efficacy and its real necessity, also considering its level of invasiveness. In the RNN approach, we assess the relative effectiveness of the lockdown measure in different countries. Here relative effectiveness means the relative position in the ranking of a specific country, i.e., the ranking position normalised with the number of NPIs adopted in that country. To this end we repeat the same knockout procedure adopted above to extract the NPI rankings in the framework of the RNN method (see SI) for each country separately and compute, for each country, the normalised ranking position of National lockdown (or State lockdown in the US). Fig. 5 reports the normalised rank in each country/state as a function of the epidemic age of National lockdown (left) or State lockdown (right) in that country/state.

Normalised ranking position of National lockdown (left) or State lockdown (right) versus the epidemic age (number of days since 30 confirmed cases) of the NPI in each country/state in which it has been adopted. To avoid biases connected to the epidemic age, we compute the ranking from the relative variation of Rt, i.e., ΔRt/Rt.
There is a strong correlation between the effectiveness of the national/state lockdown and the epidemic age of its implementation. We can conclude that the epidemic age is highly relevant when national or state lockdown are concerned. A short synthesis for that is “the earlier, the better". We refer to the Supplementary Information for the report of this analysis applied to all NPIs.
3 Discussion
To give a better synthesis, in the following, we discuss our main findings organised according to the themes at the top level of NPIs hierarchy.
Social distancing
Bans of small gatherings (gatherings of 50 persons or less) and the closure of educational institutions have a more substantial effect on Rt (but are also more intrusive to our daily lives) than the prohibition of mass gatherings, measures targeting special populations (e.g., elderly, vulnerable populations, hospitalized patients, prisoners or more exposed non-healthcare professionals) or adaptive measures for certain establishments (e.g., places of worship, administrative institutions, entertainment venues, nursing homes). In two recent studies based on smaller numbers of countries, school closures had been attributed only a little effect on the spread of COVID-19 9, 10. Social distancing measures are less effective in countries with a high population density and a high degree of citizen participation in the government, as well as freedom of expression or free media (WGI Voice & Accountability). The country-level analysis confirms that these NPIs have a particularly high entropy, meaning that their effectiveness varies indeed substantially across countries. An exception to that are the measures for public transport and work safety protocols, where the latter mostly refers to mandatory guidelines for, e.g., physical barriers or fever checks at workplaces. These two social distancing measures have a low effectiveness rank (little significance across the methods) and low entropy, meaning that they had no impact on Rt consistently across most countries.
Healthcare and public health capacity
An increase in the availability of personal protective equipment (PPE) to the healthcare workforce, together with measures aiming to reduce the number of non-COVID-19 or non-critical COVID-19 patients in medical centres and hospitals (by promoting self-isolation of mildly symptomatic patients, setting up health hotlines, etc.) are also essential building blocks of successful containment strategies. All of these measures combine high effectiveness of early implementation and low entropy, meaning that they are similarly effective in most countries. Consequently, they also show less or no consistent correlations with most of the country-level development or governance indicators. There is one notable exception to this general trend, namely the increased availability of PPE, which positively and strongly correlates with the control of corruption. Indeed, there are increased news reports currently on scandals related to government procurement of PPE 21–23.
Travel restrictions
Different types of travel restrictions also show significant effects, in particular border restrictions (e.g., border closure, border controls), individual movement restrictions (e.g., curfews, the prohibition of non-essential activities) and cordons sanitaires (containment zones). The high effectiveness of border restrictions is driven by European countries (its impact on Rt turns insignificant in two of our methods after removing all European countries); most likely for geographic reasons. This finding is in line with a high entropy score of border, airport, port and ship as well as individual movement restrictions.
Effectiveness of ultimate measures such as stay-at-home orders or lockdowns is still controversial. Recent studies suggest that a national lockdown reduces Rt by an average of 5% 9 to 80% 10, whereas other interventions seem to reduce the virus spread by 5% 10 to 30% 9. In some countries or territories, the effect of a lockdown decided in the late stage of the epidemic may not be more effective than previously implemented bans on gatherings 9, 10, 24. Our analysis highlights the importance of early national lockdowns by showing how the relative effectiveness of that measure correlates with the epidemic age of its adoption. However, the reduced effectiveness of lockdowns at higher epidemic age, as observed in Fig. 5, does not necessarily imply that taking this NPI late is useless.
Risk communication
In terms of risk communication, we find that pro-active communication with stakeholders from the private sector (e.g., business owners or chief executive officers) to promote voluntary safety protocols in enterprises, businesses, event organization, government administrations, etc., shows a significant effect in each of the four analyses, mainly when implemented early. Three out of four approaches also indicate a substantial impact of public health communication strategies (i.e., non-binding NPIs) encouraging citizen engagement and empowering them with information. The voluntary promotion of the use of face masks is also an efficient risk communication strategy. To better understand this, we performed an in-depth assessment of the impact of NPIs related to face masks. Masks are captured in total in three different interventions: the first one aims to increase their availability to health workers (increase the availability of PPE), which not only shows a protective effect for the personnel but also contributes to curbing the spread of the disease by diminishing the role of hospitals as sources of infection, ΔRt = −0.07(1). The two other mask-related NPIs concern the use of face masks in the general population. Some governments have actively promoted the wearing of masks through information campaigns on respiratory etiquette. This measure was typically implemented early in the epidemic (on average, three days after reaching 30 cases). Other countries have enacted the use of masks as mandatory, generally at later stages of the epidemic (22 days after 30 cases), often accompanied by information campaigns (and sometimes enforced by police sanctions). The early promotion of the use of face masks shows a significant effect (ΔRt = −0.19(2)), whereas late mandatory use appears to have an attenuated impact (ΔRt = −0.13(3)). This picture suggests that face masks are useful 4, 25 in particular when they are immediately available (as stocks for example) for health workers and the public, making it possible to promote their general use. Many European countries first had to procure masks before establishing their usage mandatory to enforce compliance 26. This circumstance might have reduced their effectiveness.
Resource allocation
Measures for resource allocation show limited impacts on Rt in our analysis (e.g., police and army interventions being insignificant in all studies) with relatively high entropy, meaning that country-level effects are important. Surprisingly, the implementation of crisis management plans turns out to be highly effective, except for the Americas. After removing countries from North and South America from the analyses, all four of our methods agree on significant effects of crisis management plans with an Rt of down to 0.3, suggesting a lack of effective crisis plans in American territories. For instance, US states had to focus on providing health insurance and economic stimulus as well as facilitating administrative procedures, while European countries could develop their plans on top of a stronger socio-economic basis 27, 28. Crisis management plans are also more effective in countries with a non-participatory government, meaning that countries with increasingly authoritarian practices might be at an advantage at implementing such policies, as can be seen in the swift response of Singapore 29.
Case identification, contact tracing and related measures
NPIs related to case identification and contact tracing show some of the lowest effectiveness ranks and in some cases even increase Rt, consistently across most countries (NPIs with the five lowest entropy scores all belong to this theme). This result is to be expected, as, e.g., increased testing and faster contact tracing will on the short-run increase the numbers of found cases in return for reduced numbers in the long run. We do not assess such long-term effects (over timespans of more than a month) in the current work. Furthermore, note that our analysis considers mostly data from March and April 2020 where many countries experienced surges of case numbers that most likely hindered effective contact tracing and other case identification measures. This also applies to the relative ineffectiveness of quarantining people who either are infected or were exposed to infected persons, while the promotion of self-isolation of people with symptoms belonged to one of the most effective NPI. This result confirms a tendency in our results where voluntary measures are more effective than similar mandatory ones.
Strengths & Limitations
The assessment of the effectiveness of NPIs is statistically challenging, as measures were typically implemented simultaneously and because their impact might well depend on the particular implementation sequence. Our four methodological approaches are susceptible to resulting biases in different ways. While some methods might be prone to overestimating effects from an NPI due to insufficient adjustments for confounding effects from other measures, other methods might underestimate the contribution of an NPI by assigning its impact to a highly correlated NPI. As a consequence, estimates of Rt might vary substantially across different methods, whereas the agreement on the significance of individual NPIs is much more pronounced. The strength of our study, therefore, lies in the harmonization of these four independent methodological approaches, combined with the usage of an extensive data set on NPIs. This study design substantially reduces the risk of idiosyncratic results due to model biases. Moreover, whereas previous studies often subsumed a wide range of social distancing and travel restriction measures under a single entity, our analysis contributes to a more fine-grained understanding of each NPI.
It is also essential to highlight the limitations of our approach. The CCCSL data set features non-homogeneous data quality and completeness across the different territories and data collection could be biased by the data collector (native versus non-native) as well as the information communicated by governments. Moreover, the coding system presents some drawbacks, notably because some interventions could belong to more than one category but are only recorded once. Compliance with NPIs is crucial for their effectiveness, yet we assumed a comparable degree of compliance by each population. Additionally, we neither took into account the stringency of NPI implementation nor potential variations of NPI effectiveness over time, except for the dependency on the epidemic age of its adoption.
To compute Rt, we used time-series of the number of confirmed COVID-19 cases 30. This approach may over-represent patients with severe symptoms and may be biased by variations in testing and reporting policies among countries. We assumed a constant serial interval (average time-span between primary and secondary infection). However, this number shows considerable variations in the literature 31 and depends on measures such as social distancing and self-isolation. Our analysis provides a large-scale quantification of the effectiveness of different NPIs in mitigating the transmission of COVID-19. The consensus displayed by the four different methods guarantees the robustness of the results.
4 Conclusions
Here we presented the outcome of an extensive analysis on the impact of 4,579 individual NPIs (N = 53) on the effective reproduction number Rt of COVID-19 in 76 territories worldwide. The adoption of the CCCSL data set 20 of NPIs, makes of our study the largest on NPI effectiveness to date10,19.32.33
Our study dissects the entangled packages of NPIs 20 and gives new insights into their effectiveness. Our findings suggest that there is no silver bullet to efficiently reduce the burden of a potential second COVID-19 wave or any similar future viral respiratory epidemics through NPIs. Instead, we identify several decisive interventions that significantly contribute to reducing Rt below one, though none of these interventions alone would be enough to stop the epidemic. At the global level, our results reveal a worldwide consensus rank of the NPIs based on their effectiveness in mitigating the spread of COVID-19. For instance, i) social distancing, ii) travel restrictions, and iii) healthcare and public health capacity (e.g., reduce the burden on the healthcare system by encouraging self-initiated isolation of people symptoms) have a particularly strong effect on the reduction of Rt. This finding is in line with results from other studies which used different statistical approaches, epidemiological metrics, geographic coverage, and classifications of NPIs 2, 7–13. More importantly, the possibility to focus the analysis on individual countries, reveals that the efficacy of individual NPIs strongly varies across countries and world regions, and in relation to human and economic development as well as different dimensions of governance. This finding is significant because it implies that the impact of specific NPIs in a particular area is the complex outcome of the non-trivial combination of socio-economic features and the NPIs already adopted. The dependency on the local context is not surprising, and it points to a high heterogeneity across countries and a non-independence among the different NPIs. Another source of complexity is represented by the dependency on the effectiveness of each NPIs on the epidemic age of its adoption. In simple words, the same NPI in the same country can have a drastically different impact if taken early or later on.
The emerging picture is one in which no one-fits-all solution exists, and no single NPI alone can decrease Rt below one. Instead, in the absence of a vaccine, a resurgence of COVID-19 cases can only be stopped by a suitable combination of NPIs, each tailored to the specific country and its epidemic age. These measures must be enacted together — and with the best timing — to be maximally effective on the spread of COVID-19 and enable a faster re-opening.
One of the consequences of this picture is that NPIs considerably less intrusive and less costly than lockdowns could be highly effective, such as specific risk communication strategies and voluntary measures that strengthen the healthcare system. In fact, we found several instances where non-binding governmental guidelines strongly outperformed their mandatory counterparts (e.g., masks, self-isolation, work safety). These results call for a strong effort to simulate “what-if” scenarios at the country level for planning the most likely effectiveness of future NPIs, and, thanks to the possibility to go down to the level of single countries and specific local contexts, our approach is the first contribution to this end.
5 Methods
Data
NPI data
We use the publicly available Complexity Science Hub Vienna COVID-19 Control Strategies list (CCCSL) data set on NPIs 20. Therein, NPIs are categorised using a four-level hierarchical coding scheme: L1 defines the theme of the NPI: “Case identification, contact tracing and related measures”, “Environmental measures”, “Healthcare and public health capacity”, “Resource allocation”, “Returning to normal life”, “Risk communication”, “Social distancing” and “Travel restriction”. Each L1 (theme) is composed of several categories (L2 of the coding scheme), that contain subcategories (L3) which are further subdivided to group codes (L4). The data set covers 52 countries; data for the USA is available at the state level (24 states). This makes a total of 76 territories. The time window for which data is available varies by territory. In this analysis, we use a static version of the CCCSL, retrieved on 15 May 2020, presenting 4,579 NPIs. A glossary of the codes is provided on github. For each country, we use the data until the day to which the measures have been reliably updated. NPIs that have been implemented in less than five territories are not considered, leading to a final number of 3,850 NPIs of 53 different L2 categories to be used in the analyses.
COVID-19 case data
To estimate the effective reproduction number Rt, and growth rates of the number of COVID-19 cases, we use time series of the number of confirmed COVID-19 cases in the 76 considered territories 30. To control for weekly fluctuations, we smooth the time series by computing the rolling average using a Gaussian window with a standard deviation of two days, truncated at a maximum window size of 15 days.
Regression techniques
We apply four different statistical approaches to quantify the impact of a NPI M on the reduction of Rt (see details in the Supplementary Information).
Case-control analysis
The case-control analysis (CC) considers each single category (L2) or subcategory (L3) M separately and compares the difference Rt in the Rt between all countries that implemented M (cases) with those that did not implement it (controls) during the observation window. The comparison is made via a linear regression model adjusting for (i) epidemic age (days after the country has reached 30 confirmed cases), (ii) the value of Rt before M takes effect, (iii) total population, (iv) population density, (v) the total number of NPIs implemented and (vi) number of NPIs implemented in the same category as M. With this design, we investigate the time delay of τ days between implementing M and observing Rt, as well as additional country-based covariates that quantify other dimensions of governance and human and economic development. Estimates for Rt are averaged over delays between 1 and 28 days.
Step function Lasso regression
In this approach, we assume that without any intervention, the reproduction factor is constant and deviations from this constant are caused by a time-delayed onset of each NPI on L2 (categories) of the hierarchical data set. We use a Lasso regularization approach combined with a meta parameter search to select a reduced set of NPIs that best describe the observed Rt. Estimates for the changes of Rt attributable to NPI M are obtained from country-wise cross-validation.
Random forest regression
We perform a random forest (RF) regression, where the NPIs implemented in a country are used as predictors for Rt, time-shifted τ days into the future. Here, τ accounts for the time delay between implementation and onset of the effect of a given NPI. Similar to the Lasso regression, the assumption underlying the random forest approach is that without changes in interventions, the effective reproduction number in a country remains constant. But contrary to the two methods described above, the random forest represents a nonlinear model, meaning that the effects of individual NPIs on Rt do not need to add up linearly. The importance of a NPI is defined as the decline in the predictive performance of the random forest on unseen data if the data concerning that NPI is replaced by noise, also called permutation importance.
Recurrent Neural Networks Modeling
Recurrent neural networks (RNN) built using Long Short-Term Memory (LSTM) cells 34 have proven to be suitable models for dynamic processes such as epidemic propagation due to their ability to recall past events. Here we use a RNN with identical input as described for the random forest regression, along with the values of Rt. The best performing network (least mean square error in country-wise cross-validation) is identified as having two hidden layers of 100 neurons, one output described by a linear output layer, and 54 inputs (corresponding to each category and Rt). To quantify the impact of a measure M on Rt, we use the trained RNN as a predictive model and compare simulations without any measure (reference) to simulations where one measure is presented at a time to assess Rt. To reduce overfitting effects, we report results from an ensemble of RNNs trained to similar precision levels.
Estimation of the effective reproduction number
We use the R package EpiEstim 35 with a sliding time window of 7 days to estimate the time series of the effective reproduction number Rt for every country. We choose an uncertain serial interval following a probability distribution with a mean of 4.46 days and a standard deviation of 2.63 days 36.
Ranking of NPIs
For each of the four methods (CC, Lasso regression and RNN), we rank the NPI categories in descending order according to their impact, i.e., the estimated degree to which they lower Rt or their feature importance (RF). To obtain a ranking of the eight different themes (L1) of NPIs, we sum the impacts of the 5 highest ranked categories of each theme and then rank the themes according to this cumulative impact.
Co-implementation network
We construct the NPI co-implementation network as previously described 20. If there is a statistical tendency that a country implementing NPI i also implements NPI j later in time, we draw a directed link from i to j. Nodes are placed on the y-axis according to the average epidemic age at which the corresponding NPI is implemented; they are grouped on the x axis by their L1 theme. Node colours correspond to themes. The effectiveness scores for all NPIs are rescaled between zero and one for each method; node size is proportional to the rescaled scores, averaged over all methods.
Entropic country-level approach
Each territory can be characterised by its socio-economic conditions and the unique temporal sequence of NPIs adopted. To quantify the NPI effect, we measure the heterogeneity of the overall rank of a NPI amongst the countries that have taken that NPI. To compare countries which have implemented different numbers of NPIs, we consider the normalised rankings, where the ranking position is divided by the number of elements in the ranking list (i.e., the number of NPIs taken in a specific country). We then bin the interval [0, 1] of the normalised rankings into 10 subintervals and compute for each NPI the entropy of the distribution of occurrences of the NPI in the different normalised rankings per country:
 where pi is the probability that the considered NPI appeared in the i-th bin in the normalised rankings of all countries. To assess the confidence of these entropic values, results are compared with expectations from a temporal reshuffling of the data. For each country, we keep the same NPIs adopted but reshuffle the timestamps of their adoption.
Author contributions
NH, LG, AL, VL, PK conceived and performed the analyses. VL, ST, PK supervised the study. ED contributed additional tools. NH, LG, AL, ADL, BP and PK wrote the first draft of the paper. ADL supervised the data collection on NPIs. All authors (NH, LG, AL, ED, ADL, VL, BP, ST, PK) discussed the results and contributed to the revision of the final manuscript.
Competing interests
The authors declare no competing interests.
Acknowledgements
We thank Alexandra Roux for her contribution to the coding of the interventions recorded in the data set used in this study. We thank David Garcia, Vito D.P. Servedio, David Hofmann for their contribution in the early stage of this work. NH would like to thank Luis Haug for helpful discussions. This work was funded by the Austrian Science Promotion Agency, FFG project under 857136, the WWTF under COV 20-001, COV 20-017 and MA16-045, the Medizinisch-Wissenschaftlichen Fonds des Bürgermeisters der Bundeshauptstadt Wien under CoVid004, and the project VET-Austria, a cooperation between the Austrian Federal Ministry of Social Affairs, Health, Care and Consumer Protection, the Austrian Agency for Health and Food Safety and the University of Veterinary Medicine Vienna.
References


