
Abstract
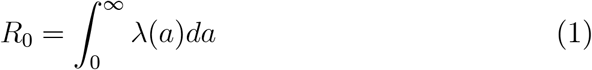
Ascertaining the state of coronavirus outbreaks is crucial for public health decision-making. Absent repeated representative viral test samples in the population, public health officials and researchers alike have relied on lagging indicators of infection to make inferences about the direction of the outbreak and attendant policy decisions. Recently researchers have shown that SARS-CoV-2 RNA can be detected in municipal sewage sludge with measured RNA concentrations rising and falling suggestively in the shape of an epidemic curve while providing an earlier signal of infection than hospital admissions data. The present paper presents a SARS-CoV-2 epidemic model to serve as a basis for estimating the incidence of infection, and shows mathematically how modeled transmission dynamics translate into infection indicators by incorporating probability distributions for indicator-specific time lags from infection. Hospital admissions and SARS-CoV-2 RNA in municipal sewage sludge are simultaneously modeled via maximum likelihood scaling to the underlying transmission model. The results demonstrate that both data series plausibly follow from the transmission model specified, provide a direct estimate of the reproductive number R0 = 2.38, and suggest that the detection of viral RNA in sewage sludge leads hospital admissions by 4.6 days on average.
1 Introduction
Ascertaining the state of coronavirus outbreaks is crucial for public health decision-making. Absent repeated representative viral test samples in the population (Kaplan and Forman 2020), public health officials and researchers alike have relied on lagging indicators of infection to make inferences about the direction of the outbreak and attendant policy decisions. How useful these indicators are depends upon their typical lags behind the incidence of infection. Some indicator lags, such as time from infection to hospitalization, have been studied empirically (Lewnard et al 2020, CDC 2020, MIDAS 2020). Other indicators have been proposed with the hope that they would greatly reduce the lag time from infection. One such promising indicator is measured SARS-CoV-2 RNA concentration in municipal wastewater (Hart and Halden 2020, Peccia et al 2020). How much earlier might such a signal inform officials of changes in the state of the outbreak?
This paper tackles this question by using an epidemic transmission model to create model-scale versions of whatever indicator is of interest, and then scales these model quantities to match observed indicator values in the real world. This approach clarifies the time lags that should be expected from SARS-CoV-2 incidence to whichever indicator is of interest, and by doing so makes it possible to compare the relative timing of one indicator to another, providing the model fit to the data is sufficiently close.
Our study takes advantage of recently conducted research tracking the local SARS-CoV-2 outbreak in the New Haven, Connecticut, USA metropolitan area. As reported by Peccia et al (2020), daily SARS-CoV-2 RNA concentrations were obtained by sampling sewage sludge from the local wastewater treatment plant and conducting PCR tests to determine virus RNA concentration. Daily COVID-19 admissions to the Yale New Haven Hospital restricted to residents of the same four towns served by this wastewater treatment plant were also recorded over the same time period. An epidemic model developed by Kaplan (2020b) was taken as the basis for calibrating these two lagging indicators while simultaneously estimating the initial condition and reproductive number R0 of this outbreak. This paper details the methodology employed and results obtained from doing so.
The next section presents a quick description of the transmission model reported in Kaplan (2020b). In Section 3, a simple method is described for linking model-scale lagging epidemic indicators to SARS-CoV-2 incidence based on the model and appropriately defined lag probability density functions, which enables a model-scale comparison of different indicators to see how they should appear over the course of an outbreak (Figure 1). Section 4 presents a simple statistical approach to analyzing real-world indicator data by scaling modeled indicators up to observed values based on maximum likelihood estimation while also estimating the initial condition and reproductive number of the epidemic wave from the underlying transmission model. We simultaneously scale hospital admissions and the RNA virus concentration observed in the sewage sludge to the epidemic model (Table 1, Figure 2 and 3). The results show that accounting for the inherent noise in the data, both the virus RNA concentration in the sewage sludge and hospital admissions match the model expectations reasonably well. The analysis verifies that there is about a 4.6 day separation between the sludge RNA concentration and hospital admissions curve, consistent with earlier analysis based on statistical time-series analysis (Peccia et al 2020). Section 5 provides a summary of the key points of the paper.


2 Transmission Model
Data detailing person-to-person SARS-CoV-2 transmission in Wuhan were reported by Li et al (2020). These data enabled an early model-based assessment of prospects for containing coronavirus via isolation and quarantine (Kaplan 2020a), while that analysis was extended to a dynamic transmission model for SARS-CoV-2 transmission in Connecticut (Kaplan 2020b). This latter model incorporates infection-age-dependent transmission, and thus falls into the class of renewal equation epidemic models (Heesterbeek and Dietz 1996, Champredon and Dushoff 2015). The key model element is the age-of-infection dependent transmission rate λ(a), which can be thought of as the instantaneous transmission intensity of an individual who has been infected for a time units. At the beginning of an outbreak when an infectious person is embedded in an otherwise susceptible population, the expected number of infections transmitted per infectious person equals the reproductive number R0,which is givenby
 as is well known. Li et al (2020) reported estimates of both the exponential growth rate r and backwards generation time probability density function b(a), enabling λ(a) to be written as

(Kaplan 2020a, 2020b; Britton and Tomba 2019; Champredon and Dushoff 2015; Wallinga and Lipsitch 2007), which together imply a point estimate of R0 = 2.26 (Kaplan 2020a), consistent with values widely reported elsewhere (Ferguson et al 2020, Kissler et al 2020, MIDAS 2020, Park et al 2020).
An alternative representation of λ(a) is
 where f (a) is the forward generation time density that dictates the timing of transmission (Britton and Tomba 2019; Champredon and Dushoff 2015; Wallinga and Lipsitch 2007). We adopt this representation in the present analysis, as it enables estimation of the underlying reproductive number R0 directly from the data at our disposal.
The transmission model developed in Kaplan (2020b) that will be used to anchor our infection indicators analysis follows. Let
ψ(t) ≡ transmission potential (or force of infection) at chronological time t;
s(t) ≡ fraction of the population that is susceptible to infection at chronological time t;
π(a,t) ≡ fraction of the population that has been infected for duration a at time time t;
π(0,t) ≡ incidence of infection at time t.
Given initial conditions π(a, 0) and s(0) the model equations are:
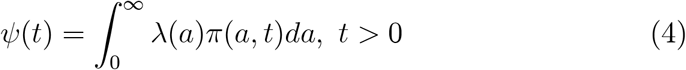

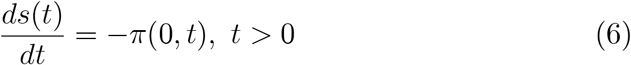
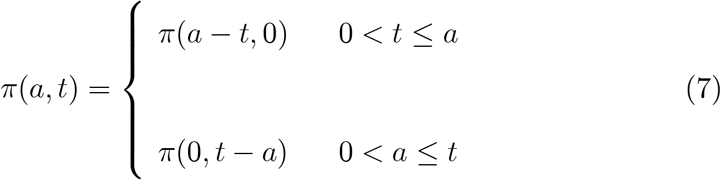
Equation (4) defines the transmission potential at time t, which is infection-age-dependent transmission λ(a) weighted by the infection-age-dependent prevalence of infection in the population π(a,t);equation (5) equates SARS-CoV-2 incidence to the product of the fraction of the population that is susceptible and the transmission potential; equation (6) depletes susceptibles with the incidence of infection; and equation (7) aligns the fraction of the population infected for duration a at time t with the incidence of infection at time t – a, adjusting for the initial conditions at time zero. There is no additional accounting for the duration of infectiousness because the time course of infection is already built into λ(a).
The transmission function employed for the present analysis is given by equation (3) using the forward generation time density f(a) implied by Li et al (2020), which is a gamma density with mean (standard deviation) equal to 8.86 (4.02) days1. The reproductive number R0 and initial condition π(a, 0) are estimated from the data as described below.
3 Transmission Indicators and Time Lags
In the absence of repeated representative viral testing in a population, officials and researchers alike have turned to lagging indicators of infection such as diagnosed COVID-19 cases, hospitalizations, and deaths to monitor the state of the outbreak. How useful such indicators are depends upon their lag time from infection. Let y(t) be the value of a model-scale infection indicator that represents a distributionally lagged signal of the incidence of infection. Specifically, denote LY as the time lag from infection, and define fLY (a) as the probability density function governing the lag LY. The model-scale infection indicator y(t) is then defined as
 where EX [·] denotes mathematical expectation with respect to random variable X. Simply stated, the model-scale indicator at time t is the expected value of SARS-CoV-2 incidence LY time units into the past. A first-order Taylor approximation yields the approximation
 which suggests that the model-scale indicator value can be approximated by incidence evaluated E(LY) time units earlier.
3.1 Example: Hospital Admissions
Hospital admissions have been used as an indicator for the coronavirus outbreak under the presumption that the fraction of new infections that require hospitalization remains constant over time. Define Lh as the time from infection to hospitalization for those infected persons that do require hospital treatment. A review of several published studies by Lewnard et al (2020) estimated that the time from infection until hospitalization averages 13.5 days with 95% probability coverage ranging from 4.8 to 27.9 days. We approximate this finding by employing a gamma distribution with α = 4.954 and β = 2.725 to represent the probability density of LH, fLY (a). This distribution also has a mean of 13.5 days with 95% probability coverage ranging from 4.4 to 27.7 days. Similar times from infection to hospitalization are implied by the Centers for Disease Control COVID-19 pandemic planning scenarios (CDC 2020) and also MIDAS (2020).
Conditional upon the transmission model described in equations (4-7), the model-scale hospitalization indicator h(t) is, following equation (8), given by
Figure 1 plots both the model-scale SARS-CoV-2 incidence π(0,t) and hospitalization indicator h(t) assuming λ(a) as defined in equation (3) with R0 = 2.38 as will be estimated subsequently; the gamma distribution for fLH (a) described above; s(0) = 1 – 0.0161 reflecting the initial prevalence of infection as estimated below (with time 0 taken as February 19, 2020); and π(a, 0) = 0.0161/30 for 0 < a ≤ 30 as explained below. The model-scale hospitalization indicator lags incidence by about two weeks, as one would expect given that E(LH) = 13.5 days by design.
3.2 Example: SARS-CoV-2 RNA in Municipal Sewage Sludge
Peccia et al (2020) reported daily SARS-CoV-2 RNA concentrations based on sampling sludge from a municipal wastewater treatment plant serving the towns of New Haven, East Haven, Hamden, and Woodbridge in the state of Connecticut, USA between March 19 and May 1 of 2020. Virus RNA concentrations in sludge should reflect the amount of virus shed in feces by infected persons in the population served by the treatment plant, resulting in a fecal estimate of community virus RNA concentration. Though virus RNA concentrations in feces degrade exponentially with the time from excretion to sample collection (Hart and Halden, 2020), virus RNA concentrations obtained from sludge sampled daily should be discounted by approximately the same degradation factor, rendering the resulting signal a plausible surrogate tracking community virus RNA concentration over time.
Referring back to the epidemic model, the appropriate measure of virus RNA concentration is the transmission potential ψ(t), as the amount of virus shed in feces should reflect the average infectiousness of the population. However, to use the indicator framework developed above, the age-of-infection transmission rate λ(a) must be normalized to the scale of a probability density function. This is easily achieved by defining
 which is immediately recognized as the forward generation time probability density f(a) introduced earlier. This density enables the definition of the model-scale virus RNA indicator v(t) as

For λ(a) as defined in equation (3) using the forward generation time density f (a) corresponding to Li et al (2020), the expected lag E(LV) is given by 8.9 days, or 4.6 days shorter than the lag from infection to hospitalization. This mean generation time is 3 to 4 days longer than the values implied by CDC (2020) and MIDAS (2020), though it falls within the uncertainty interval estimated by Park et al (2020). Figure 1 reports the model-scale virus RNA indicator v(t) under the same epidemic modeling assumptions described for the hospitalization indicator h(t). Given the transmission model, the timing of both the virus RNA concentration and hospitalization indicators is clear, and provides a clue as to what might be expected when examining the timing of observed hospital admissions and SARS-CoV-2 data in sewage sludge. We turn to such an empirical analysis in the next section.
4 Scaling Indicators to Transmission: Hospital Admissions and SARS-CoV-2 RNA in Sewage Sludge
Consider a model-scale infection indicator y(t) as earlier described, and let Y(t) be the random variable denoting the real-world scale observable value of this indicator at time t. For examples, corresponding to the model-scale hospitalization indicator h(t), the real-world number of hospital admissions observed on day t is the random variable H(t). Similarly, random variable V(t) denotes the actual concentration of RNA observed in sewage sludge on day t, corresponding with the model-scale virus RNA concentration indicator v(t).
The observable indicator Y(t) is modeled as a random variable with mean proportional to y(t), that is,
 for some indicator-specific constant kY. We thus scale observable indicators to their model-scale values in expectation. We also allow the indicator variance
  to depend upon y(t). Given the transmission model, we treat y(t) as conditionally independent of Y(t′) for all t ≠ t′, for correlation in observed values across time would almost entirely be due to the underlying epidemic. The specific probability law presumed for Y(t) given y(t) can differ by infection indicator, as will become clear by example. Given observed indicator values at different points in time and an underlying epidemic model, one can estimate the scaling constants kY (and variance parameters if needed) via maximum likelihood or other methods.
The Peccia et al (2020) study of sewage sludge obtained daily COVID-19 admissions data to the Yale New Haven Hospital restricted to residents of the same four Connecticut towns served by the local wastewater treatment plant. The data record the first such admission as occurring on March 14, 2020, 24 days following our February 19 starting date (t = 0), and daily admissions data were recorded through May 1, 2020 (t = 72) to match the sampling period observed in the sewage sludge study.
Daily hospital admissions data ht are modeled as realizations of a Poisson random variable H(t) with mean proportional to the model-scale indicator h(t) developed earlier, that is,

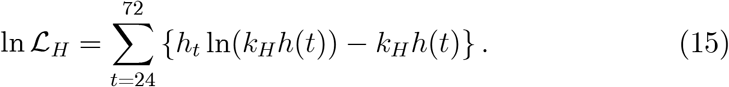
The Poisson log likelihood corresponding to the hospital admissions data covering March 14 (t = 24) to May 1 (t = 72), ln  , is thus given by
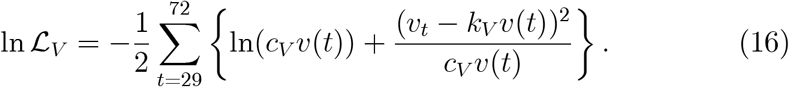
Also as reported in Peccia et al (2020), sludge samples from the local wastewater treatment plant were tested for SARS-CoV-2 RNA concentrations with two different primers applied to two sample replications daily. These values were adjusted to control for day to day variations in treatment plant flow, sludge solids content, and RNA extraction efficiency (Peccia et al 2020). The data we employ here are vt, the day t average of these four adjusted values with measurement units 105 SARS-CoV-2 RNA copies / ml sludge. Data were collected from March 19 through May 1 (t = 29,…,72) for a total of 44 daily observations. We model vt as realizations of a Normal random variable V(t) with mean E[V(t)] = kVv(t) and variance 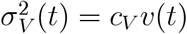 to allow for over- or under-dispersion relative to the mean2. The Normal log likelihood corresponding to the sludge data, In
  , thus equals
We estimate five parameters from the hospital admissions and sludge data via maximum likelihood, conditional upon the epidemic model (which implies the forward generation lag density fLV (a) = f(a), and hospital lag density fLH (a) that was taken from the literature). Three of the parameters estimated are the hospitalization scaling constant kH, the sludge RNA scaling constant kV, and the sludge RNA variance scaling constant cV. The fourth parameter estimated is R0 which scales the strength of the outbreak and enables direct comparison to SARS-CoV-2 epidemics elsewhere. The final parameter estimated is π(0), which sets the initial condition of the model via the relation

This modeling choice reflects the random arrival of imported infections to the area of study in the thirty days preceding the onset of community transmission, in effect determining the placement of the main epidemic wave without changing its shape. A larger value of π(0) would pull the epidemic earlier in time, while a smaller value would push the epidemic later. In this way, the hospital admissions and sludge virus RNA concentration data jointly determine the size and the placement of the epidemic wave while impacting the transmission dynamics via the model described in equations (4-7).
Table 1 reports the maximum likelihood estimates and standard errors computed by inverting the Hessian matrix of the log likelihood function (Cox and Hinkley 1974) following maximization of 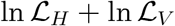 , while the fit of the observed data to the scaled model indicators is illustrated in Figures 2 and 3, which plot 95% prediction intervals about the expected indicator values in addition to the data. The hospital admissions data are plotted in Figure 2. Though noisy, the admissions data correspond to the modeled pace of the epidemic, with most values falling within the 95% prediction intervals.
Figure 3 reports the observed and modeled SARS-CoV-2 RNA concentrations (in 105 RNA copies / ml sludge) from the sewage study along with conservative 95% prediction intervals. While peak RNA virus concentrations are higher than what would be expected based on the model, the data again match the estimated pace of the epidemic, suggesting that community virus RNA concentration in sewage sludge can indeed be represented by the transmission potential in an epidemic model. The data rise and fall as expected, albeit with much random noise to be sure.
Note that the estimated reproductive number is 2.38 with a 95% confidence interval ranging from 2.19 to 2.58. This places the local SARS-CoV-2 outbreak in New Haven squarely in the middle of reproductive numbers estimated elsewhere (for examples see CDC (2020) and MIDAS (2020)). What is noteworthy is that this reproductive number was estimated from a model linking transmission to hospital admissions and SARS-CoV-2 RNA concentrations measured in sewage sludge. The data, not the model, determined the magnitude of R0, supporting the plausibility of the hospitalization and generation time lag distributions employed to match the observed data to an underlying transmission model.
Together with the epidemic model, these data answer one of the questions raised by the Peccia et al (2020) study: why did the SARS-CoV-2 RNA signal from the sewage sludge lead hospital admissions by only 4 days, when many were expecting a much earlier signal? The model shows that the natural time lag for virus RNA concentration is governed by the mean forward generation time, estimated at 8.9 days in this model. Given an average 13.5 day lag from infection to hospitalization documented elsewhere, tracking the outbreak by relying on the sewage sludge RNA signal leads similar tracking by hospital admissions by 4.6 days on average.
5 Summary
This paper has focused on modeling lagging epidemic indicators and how they relate to each other. The approach has been to utilize an epidemic model as a basis for scaling indicators like hospital admissions or SARS-CoV-2 RNA observed in sewage sludge. After characterizing how indicators lag incidence, we showed how one could use an epidemic model to simultaneously estimate the placement of an epidemic wave (via estimating the initial condition), the strength of an outbreak (via estimating R0), and situate lagging indicators appropriately, allowing one to view the data in a more epidemiologically meaningful way. Using data from a recently published study of SARS-CoV- 2 RNA concentrations observed in municipal sewage sludge, we showed why the RNA data were only able to shorten the time from infection to signal by 4.6 days relative to hospital admissions. Finally, the RNA and hospitalization data jointly implied an epidemic with R0 of approximately 2.38, well within the range implied by numerous studies.
Data Availability
Data reported in https://www.medrxiv.org/content/10.1101/2020.05.19.20105999v2
Acknowledgements
The authors thank Doug Brackney, Arnau Casanovas-Massana, Nate Grubaugh, Albert Ko, Saad Omer and Dan Weinberger for comments on an earlier draft of this manuscript.
Footnotes
↵1 We also considered the generating time density based on the posterior parameter estimates from Park et al’s (2020) analysis of generating times, but it did not fit the data quite as well as the generating time based on Li et al (2020).
↵2 We also considered a model with constant variance but the model did not fit the data as well.


