
Abstract
Globally 149 million children under five are estimated to be stunted (length more than 2 standard deviations below international growth standards). Stunting, a form of linear growth failure, increases risk of illness, impaired cognitive development, and mortality. Global stunting estimates rely on cross-sectional surveys, which cannot provide direct information about the timing of onset or persistence of growth failure— a key consideration for defining critical windows to deliver preventive interventions. We performed the largest pooled analysis of longitudinal studies in low- and middle-income countries to date (n=31 cohorts, 62,993 children, ages 0-24 months), allowing us to identify the typical age of linear growth failure onset and to investigate recurrent faltering in early life. The highest incidence of stunting onset occurred from birth to age 3 months. From 0 to 15 months, less than 5% of children per month reversed their stunting status, and among those who did, stunting relapse was common. Early timing and low reversal rates emphasize the importance of preventive intervention delivery within the prenatal and early postnatal phases coupled with continued delivery of postnatal interventions through the first 1000 days of life.
Introduction
There have been marked reductions in child mortality in the past decade,1 in part due to the emphasis on child survival in the Millennium Development Goals. Yet children born in low- and middle income countries (LMICs) still face enormous challenges to their ability to thrive, including poverty, poor nutrition, poor water and sanitation, poor access to health care and limited stimulation in the home environment.2 A commonly used, readily measurable indicator of children’s overall health and development is their linear growth as measured by a child’s length (height or stature).3 Extensive evidence supports its use as a surrogate for more difficult-to-measure physiological and cognitive deficits that accrue during early life.4,5 Children in optimal environments have the same growth potential, regardless of their geographic location6, and thus the World Health Organization (WHO) has developed international standards for child growth.7 A child is “stunted” if his or her length is more than 2 standard deviations below the median of the growth standard for age and sex. In 2018, 149 million children under 5 years (22% globally) were stunted, with the largest burden in South Asia and Africa.8,9 Early life stunting is associated with increased risk of mortality,10 diarrhea, pneumonia, and measles in childhood11,12 and impaired cognition and productivity in adulthood.3,13,14 Global income would increase by an estimated $176.8 billion per year if linear growth failure could be eliminated.15 The WHO 2025 Global Nutrition Targets16 and Sustainable Development Goal 2 propose to reduce stunting prevalence from 2012 levels by 40% by 2025,17 reflecting renewed attention to child growth as a key determinant of overall health and human capital.18
The age of stunting onset has direct implications for the timing and nature of preventive public health interventions. In low-resource settings, most linear growth failure occurs in the first 2 years of life, and 70% of absolute length deficits by age 5 years occur before age 2 years.3 Beyond this age, catch up growth is rare in the absence of radical improvements to a child’s nutrition, health, and environment.19–23 Intrauterine growth restriction and preterm birth are strongly associated with the risk of stunting at 24 months of age,24 and the first 1000 days of life is considered the critical window in which to intervene to prevent stunting.6,25
Granular information about age of linear growth failure onset and its persistence in early life will best inform when and how to intervene with preventive measures. Yet, most studies of the global epidemiology and burden of stunting have pooled nationally representative, cross-sectional surveys – predominantly national Demographic Health Surveys (DHS) – to estimate age-specific stunting prevalence.23,26–28 Cross-sectional studies cannot identify the timing of linear growth failure onset because they measure prevalence, which cannot distinguish between persistent and new cases of growth failure. Few studies have reported stunting incidence,29,30 and even fewer have estimated age-specific incidence within the first two years of life to inform the timing of intervention delivery.31–33 We conducted an in-depth study of linear growth failure incidence in a pooled analysis of 31 longitudinal cohorts with multiple, frequent measurements in LMICs. The analysis provides new insights into the timing of onset and duration of linear growth failure, with important implications for interventions. We found that linear growth failure occurs very early in the prenatal and postnatal phase – before the age when most postnatal linear growth interventions begin (age 6 months). Our findings confirm the importance of the first 1,000 days as a critical window to intervene to prevent linear growth failure, but motivate a renewed focus on interventions delivered in the prenatal and early postnatal periods.
Pooled longitudinal analyses
Here, we report a pooled analysis of 31 longitudinal cohorts from 15 LMICs in South Asia, Sub-Saharan Africa, and Latin America followed between 1969 and 2014. Our objective was to estimate age-specific incidence and prevalence of stunting as well as linear growth velocity from 0 to 24 months. A companion article in this issue reports results for child wasting (weight-for-length Z-score < 2 standard deviations below the reference median).34 These data were amassed as part of the Knowledge Integration (ki) initiative of the Bill & Melinda Gates Foundation, which aggregated observations on millions of participants from a global collection of studies on child birth, growth and development.35 We selected longitudinal cohorts from the database that met five inclusion criteria: 1) conducted in LMICs; enrolled children between birth and age 24 months and measured their length and weight repeatedly over time; 3) did not restrict enrollment to acutely ill children; 4) enrolled at least 200 children; and 5) collected anthropometry measurements at least every 3 months (Extended Data Fig 1). These inclusion criteria ensured we could rigorously evaluate the timing and onset of stunting among children who were broadly representative of general populations in LMICs. For included randomized trials, if trials found effects on growth within the intervention arms, the analysis was limited to the control arm. Thirty-one cohorts met inclusion criteria, including 62,993 children and 464,345 total measurements (Fig 1). Most cohorts were enrolled within the past 10 years (Extended Data Table 1). Cohorts were distributed throughout South Asia, Eastern, Southern, and Western Africa, and Latin America, and a single cohort from Eastern Europe (Belarus) met inclusion criteria. Among included cohorts, 18 measured children at least monthly, and 13 measured children every 3 months (quarterly). Cohort sample sizes varied from 215 to 14,074 children. Despite broad global reach, geographic distribution was not representative of entire regions or continents (Extended Data Fig 2).

Analyses focused on longitudinal cohorts to enable the estimation of prospective incidence rates and growth velocity. In April 2018, there were 86 longitudinal studies on GHAP. From this set, we applied five inclusion criteria to select cohorts for analysis. Our rationale for each criterion follows. (1) Studies were conducted in lower income or middle-income countries. Our target of inference for analyses was children in LMICs, which remains a key target population for preventive interventions. (2) Studies measured length and weight between birth and age 24 months. We were principally interested in growth faltering during the first 1,000 days (including gestation), thought to be the key window for linear growth faltering.7 (3) Studies did not restrict enrollment to acutely ill children. Our focus on descriptive analyses led us to target, to the extent possible, the general population. We thus excluded some studies that exclusively enrolled acutely ill children, such as children who presented to hospital with acute diarrhea or who were severely malnourished. (4) Studies enrolled at least 200 children. Age-stratified incident episodes of stunting and wasting were sufficiently rare that we wanted to ensure each cohort would have enough information to estimate rates before contributing to pooled estimates. (5) Studies collected anthropometry measurements at least every 3 months. We limited studies to those with higher temporal resolution to ensure that we adequately captured incident episodes and recovery.

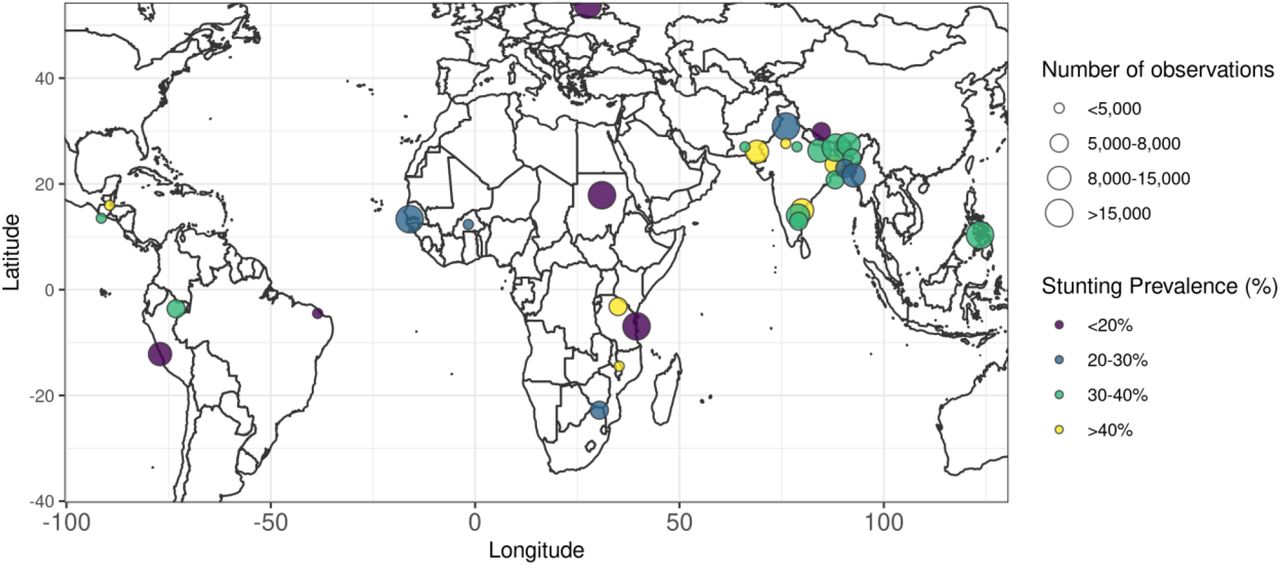
Locations are approximate, represented as nation-level centroids and jittered slightly for display. The size of each centroid indicates the number of observations contributing to each estimate. The color of each centroid indicates the level of stunting prevalence.
Countries and survey years included in the analysis of Demographic and Health Survey data
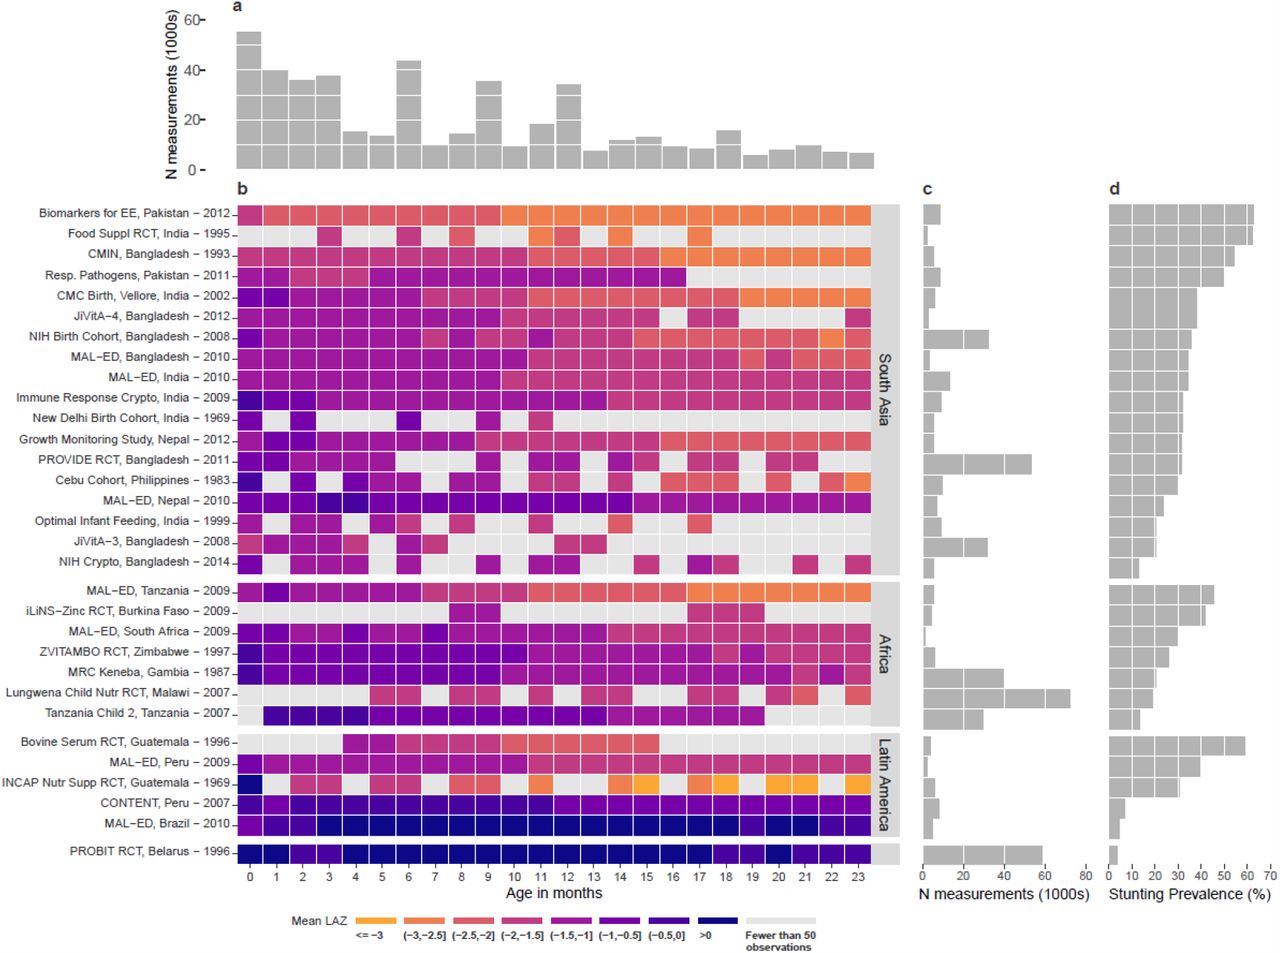
(a) Number of observations (1000s) by age in months. (b) Mean length-for-age Z-scores by age in months for each cohort. Cohorts are sorted by geographic region and mean length-for-age Z-score. (c) Number of observations contributed by each cohort. (d) Overall stunting prevalence in each cohort, defined as proportion of measurements with length-for-age z-score < –2.
We calculated length-for-age Z-scores (LAZ) using WHO 2006 growth standards.7 We dropped 969 out of 465,314 measurements (0.2%) because LAZ was unrealistic (> 6 or < –6 Z), and we defined stunting as LAZ < –2 and severe stunting as LAZ < –3.7 Unless otherwise indicated, estimates that pool across cohorts used random effects models fit with restricted maximum likelihood estimation.36,37 Within each cohort the monthly mean LAZ ranged from –3.18 to +1.31, and the monthly proportion stunted ranged from 0.3% to 86.1% (Fig 1). We compared LAZ from included cohorts with those of contemporary population-based, cross-sectional DHS data for children 0-24 months of age in the same countries and regions to assess their representativeness. Cohorts had similar Z-score distributions as their target populations (Fig 2a). Mean LAZ by age was approximately 0.25-0.75 standard deviations lower in included ki cohorts than in DHS surveys in the same countries in South Asia and Africa, and mean LAZ by age was slightly higher in Latin American cohorts (Fig 2b). Analyses therefore include a large set of cohorts from populations with high burdens of growth failure but are not representative of entire world regions. The width of the LAZ distribution was unimodal and similar to that of the WHO child growth standard’s LAZ distribution, consistent with the assertion that linear growth failure is a “whole population” condition.27

(a) Kernel density distributions of length-for-age z-scores (LAZ) in Demographic and Health Surveys (DHS) in countries that overlap with ki cohorts stratified by geographic region. DHS estimates use the most recent survey from all countries in each region. Open circles indicate median LAZ in ki cohorts; closed circles indicate median LAZ in DHS cohorts. (b) Mean LAZ by age for DHS studies and ki longitudinal cohorts with at least quarterly measurement estimated with cubic splines. Shaded bands are approximate 95% simultaneous confidence intervals.
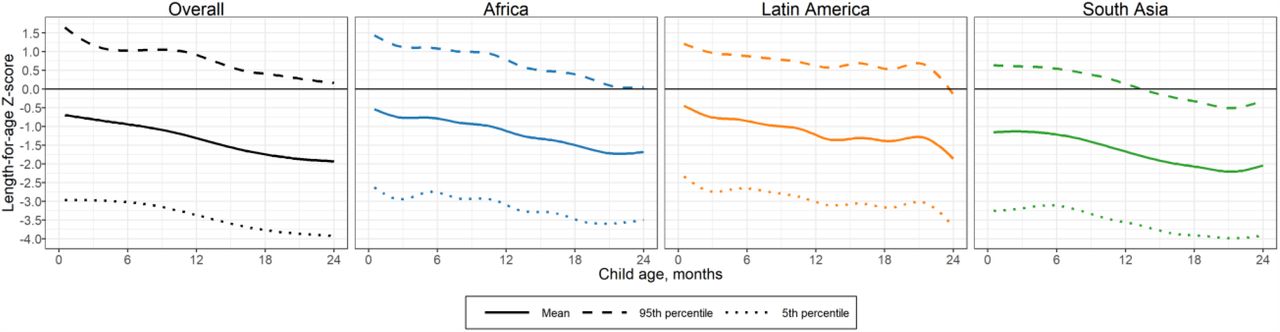
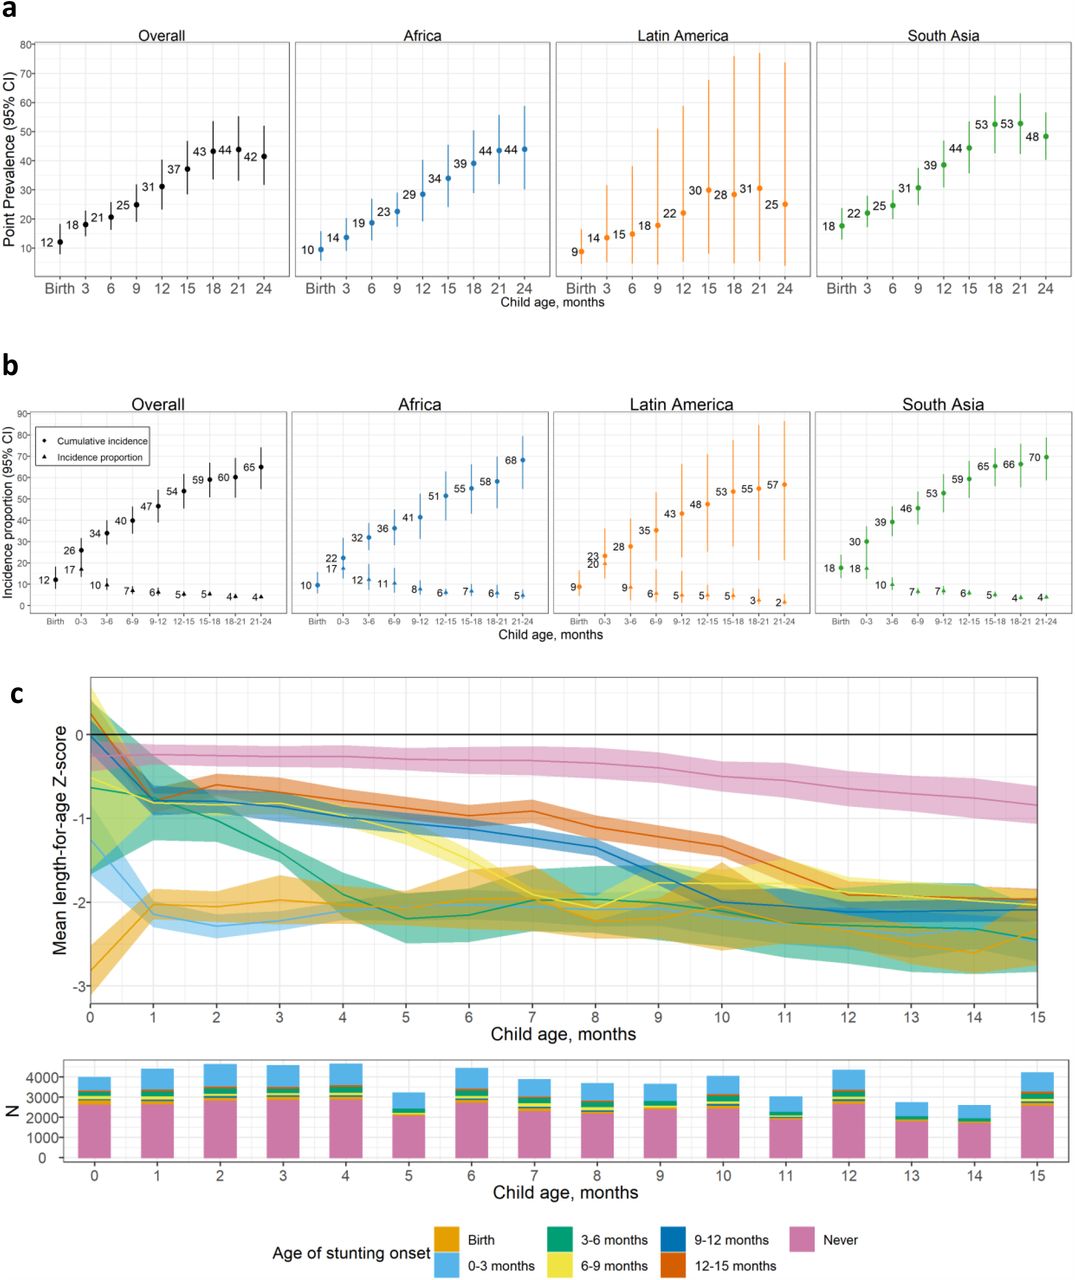
Age-specific patterns of mean LAZ and stunting prevalence were consistent with prior analyses of cross-sectional survey data.26,27 Most children were born with linear growth deficits: mean LAZ at birth was -0.75 (Fig 2a). LAZ declined steadily from birth, and by 24 months mean LAZ was –1.82. South Asia had lower LAZ than other regions: mean LAZ at birth was –1.04 and the mean at 24 months was –2.01. Yet, the decline in mean LAZ was the largest in Africa, where the mean LAZ at birth was –0.56 and the mean at 24 months was –1.87. Linear growth failure was evident across percentiles of the LAZ distribution; in South Asia, the 95th percentile of children’s LAZ scores dropped below 0 by age 14 months (Extended Data Fig 3). At birth, the overall prevalence of stunting (LAZ <–2) was 12%; prevalence increased steadily to 43% at 18 months and remained stable thereafter (Fig 3a). In African cohorts, stunting prevalence increased steadily each month from 10% at birth to 44% at 24 months. In South Asia, 18% of children were born stunted, and stunting prevalence increased steadily to 53% at 18 months and then decreased to 48% at 24 months. At most ages, stunting prevalence and incidence were lower in Latin America; wider confidence intervals for this region reflect greater variation between cohorts because stunting was more common in Guatemala than in other countries (https://child-growth.github.io/stunting/cohort.html).

by age in ki longitudinal cohorts estimated with cubic splines in cohorts with at least monthly measurement (N=14 cohorts that measured children at least monthly, N=7,456 children).

(a) Age-specific stunting prevalence and (b) Age-specific stunting incidence (cumulative and new cases) overall (N=21-30 studies; N=13,349-52,389 children) and stratified by region (Africa: N=4-7 studies, N=4,396-15,666 children; Latin America: N=3-5 studies, N=705-1,460 children; South Asia 12-18 studies, N=6,592-28,785 children). “0-3” includes age 2 days up to 3 months. Panels (a) and (b) include cohorts with at least quarterly measurements; vertical bars indicate 95% confidence intervals. (c) Mean length-for-age Z-score (LAZ) stratified by age of incident stunting from birth to age 15 months (N=14 cohorts that measured children at least monthly between birth and age 15 months, N=7,198 children). “Never” includes children who did not become stunted by age 15 months. Shaded ribbons indicate 95% confidence intervals. Pooled results were derived from random effects models with restricted maximum likelihood estimation.
Onset of stunting in early life
To measure the timing of stunting onset, we classified a child as a new incident case in three-month age periods if their LAZ dropped below –2 for the first time in that age period. Across cohorts, 12% of children were stunted at birth, and 17% experienced incident stunting onset between birth and 3 months (Fig 3b); children stunted between birth and 3 months accounted for 40% of all children who experienced stunting by age 24 months (65% of children). Trends were similar for severe stunting (https://child-growth.github.io/stunting/severe-stunting.html).
In an exploratory analysis, we stratified age-specific mean LAZ by age of stunting onset among children in monthly measured cohorts and observed three distinct subgroups whose mean LAZ followed statistically different trajectories (Fig 3c). 26% of all children were born with linear growth deficits (mean LAZ < –1), and their mean LAZ stabilized around –2 from age 1 month onward, with differences at birth in this group converging through likely regression to the mean. 11% of children were born with small linear growth deficits on average (mean 0 < LAZ < –1 at birth) and reached a mean of –2 at subsequent ages. The remaining 62% of children maintained mean LAZ > –2 at all ages, but mean LAZ declined steadily from birth to 15 months. Overall trends in mean LAZ were consistent with our age-specific incidence and prevalence estimates (Fig 3a-b). Children born with linear growth deficits may benefit more from prenatal interventions, while those whose mean LAZ declined later may benefit from both prenatal and postnatal interventions. A companion article reports characteristics that increase risk of earlier versus later growth failure.35
Stunting reversal and relapse
Stunting prevalence and incidence estimates classify linear growth measures into binary categories, which could mask the dynamics of linear growth failure onset and reversal across the continuous range of LAZ.5,38,39 We hypothesized that lower than average linear growth (LAZ <0) would persist among children who experienced stunting reversal (i.e., LAZ increased from below –2 to above –2). In addition, we hypothesized that children who experienced stunting reversal would experience stunting relapse at later ages. To test these hypotheses, we classified a child’s change in stunting status from birth to 15 months among monthly-measured cohorts (measurement frequency beyond 15 months was less consistent) (Fig 4a). Initial onset of stunting occurred before age 6 months for a majority of children. The proportion of children who experienced stunting reversal was less than 5% per month from ages 2 to 7 months and was lower at subsequent ages.

(a) Percentage of children stunted and not stunted by age (N=18 cohorts with at least monthly measurements, N=10,669 children). (b) Distribution of LAZ at subsequent measurements after stunting reversal. (c) Mean difference in LAZ following stunting reversal at each subsequent age of measurement compared to the age of reversal using random effects models fit with restricted maximum likelihood estimation. (b) and (c) include data from 18 cohorts in 10 countries with at least monthly measurement (N = 10,677 children). All panels contain data up to age 15 months because in most cohorts; measurements were less frequent above 15 months.
Among children who experienced stunting reversal, we summarized the LAZ distribution at older ages. We then estimated the mean difference in LAZ measured at older ages compared to when stunting was reversed. At the time of stunting reversal, the mode of the distribution of LAZ scores was close to the –2 cutoff (Fig 4b). As children aged, LAZ distributions gradually shifted downwards, illustrating that linear growth deficits continued to accumulate. The mean LAZ decreased by up to 0.71 SDs from 3 to 12 months after stunting reversal, and the older a child was at the time of reversal, the larger the decline in subsequent LAZ (Fig 4c). Overall, improvements in LAZ among children whose stunting status reversed were neither sustained nor large enough to erase linear growth deficits, indicating that stunting reversal did not resemble a biological recovery process for many children.
Growth velocity by age and sex
Age-specific growth velocity provides a complementary view of child growth failure only possible in longitudinal cohorts. We defined linear growth velocity as the change in length between two time points divided by the number of months between the time points (cm/month). We also estimated within-child rates of change in LAZ per month. The change in LAZ per month measures the extent to which a child’s length relative to WHO standards for his or her age and sex changed over time. From 0-3 months, length velocity was in between the 15th and 25th percentile of the WHO standard for girls and was close to the 15th percentile for boys; velocity for both sexes then improved relative to WHO standards as children aged (Fig 5a). Larger deficits at the youngest ages were consistent with highest incidence of stunting from birth to age 3 months (Fig 3b). LAZ velocity was similar for male and female children (Fig 5b). Patterns were similar across geographic regions (Extended Data Fig 4a, 4b).
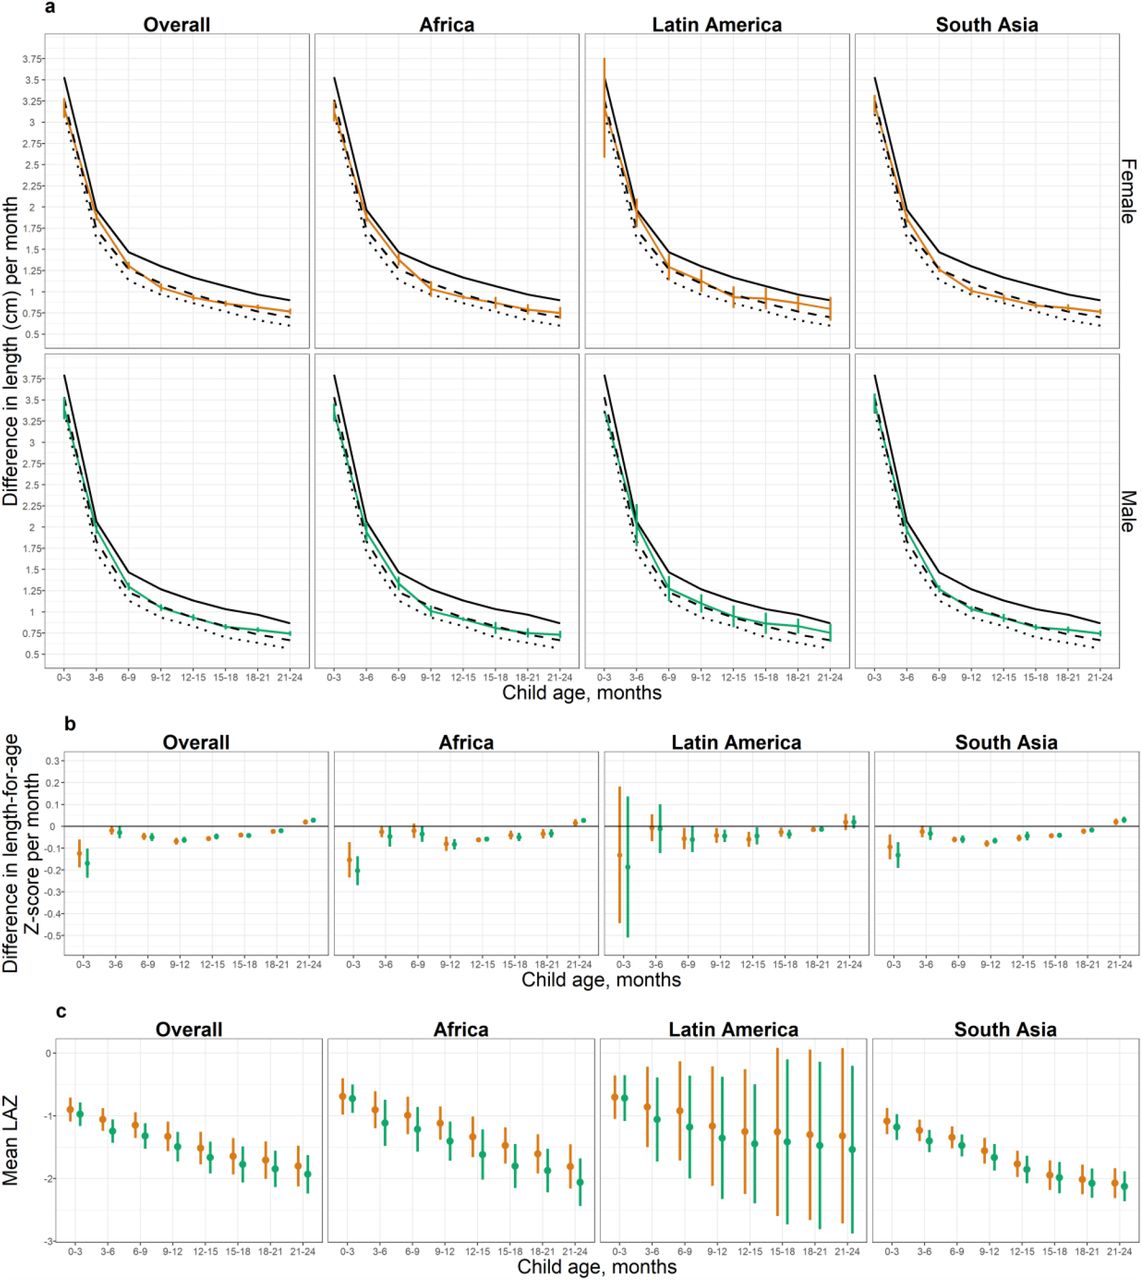
a) Within-child difference in length in centimeters per month stratified by age, sex, and region. Dotted black line indicates 15th percentile of the WHO Growth Velocity Standards; dashed black line indicates the 25th percentile; solid black line indicates the 50th percentile. Colored lines indicate and vertical bars indicate 95% confidence intervals for ki cohorts. (b) Within-child difference in length-for-age Z-score per month by age, sex, and region. (c) Mean length-for-age Z-score by age, sex, and region. Results shown in all panels were derived from 29 ki cohorts in 13 countries that measured children at least quarterly (n = 50,022 children).

(a) Within-child difference in length in centimeters per month stratified by age among male (green line) and female (orange line) children; 15th percentile of the WHO Growth Velocity Standards (dotted black lines); 25th percentile (dashed black line); and the 50th percentile (solid black line). Differences were statistically significant between sexes at ages 0-3, 3-6, 15-18, and 18-21 months. (b) Within-child difference in length-for-age Z-score per month by age and sex. Differences were statistically significant between sexes at ages 0-3,, 9-12, 12-15, 18-21, and 21-24 months. (c) Mean length-for-age Z-score by age and sex; all differences were statistically significant. All panels include 29 ki cohorts in 13 countries that measured children at least quarterly (n = 50,022 children) pooled using random effects models fit with restricted maximum likelihood estimation. Vertical bars indicate 95% confidence intervals.
The accumulation of growth velocity deficits was reflected in lower mean LAZ for boys than girls across all ages (Fig 5c). Overall patterns were similar across geographic regions (Extended Data Fig 4c). Worse growth among boys is consistent with higher infant mortality rates among boys found around the world, suggesting that males may be more vulnerable than females in early life,40–46 or that evolutionary selection favors females in resource-poor environments.47
Discussion
Estimates of the global burden of stunting and timing of linear growth failure have relied largely on cross-sectional surveys that have indicated the need for interventions targeted to children younger than 24 months.6,25 This large-scale, longitudinal analysis of 31 prospective cohorts from LMICs allowed us to provide new insights into the timing, persistence, and recurrence of linear growth failure within the first 2 years of life. Prevalence estimates matched general patterns reported in cross-sectional studies, gradually increasing with age. 23,26–28 Yet, incidence estimates from longitudinal analyses revealed a starkly different age-specific pattern and showed that stunting incidence was highest from birth to 3 months and declined thereafter (Fig 3a-b). The vast majority of children who experienced stunting reversal (i.e., crossed above the <–2 LAZ cut-off) continued to experience linear growth deficits, and over 20% were stunted again at later measurements (Fig 4).
Pre-pregnancy and prenatal risk factors for postnatal linear growth failure include young maternal age, 48 maternal infection,49 and maternal undernutrition, including low pre-pregnancy body mass index, short stature, and inadequate gestational weight gain.50 Rigorous evaluations of interventions to address these predictors have been limited to date. Interventions to improve maternal nutrition51 and reduce adolescent pregnancies in LMICs by delaying the age of marriage and first pregnancy52 may reduce the risk of linear growth failure. In addition, interventions to reduce prenatal infections associated with growth failure, such as intermittent preventive treatment for malaria, may also increase fetal linear growth in regions where such infections co-occur with linear growth failure.53
In the early postnatal phase (age 0-6 months), when growth velocity and stunting incidence were highest, the World Health Organization recommends exclusive breastfeeding to prevent infant infection and to support child growth.54 Exclusive breastfeeding significantly reduces the risk of mortality and morbidity, but exclusive breastfeeding promotion has not been found to reduce the risk of infant stunting.11,55–58 The extent to which exclusive breastfeeding impacts linear growth may depend on maternal breast milk composition and microbiota, both of which may be impacted by maternal undernutrition.59–61 In the complementary feeding phase (age 6-24 months), interventions to reduce growth failure include energy, protein, and micronutrient supplementation of children; deworming; water and sanitation improvements; vaccination; and maternal education. However, meta-analyses evaluating the effectiveness of interventions during the complementary feeding phase on stunting prevalence and mean LAZ have reported modest impacts of lipid-based nutrient supplements,62 modest or no impact of micronutrient supplementation,63 and no impact of water and sanitation improvements, deworming, or maternal education.63 The dearth of postnatal interventions that can effectively improve child linear growth motivates renewed efforts to identify alternative, possibly multisectoral interventions, and in parallel improve intervention targeting and implementation.64,65
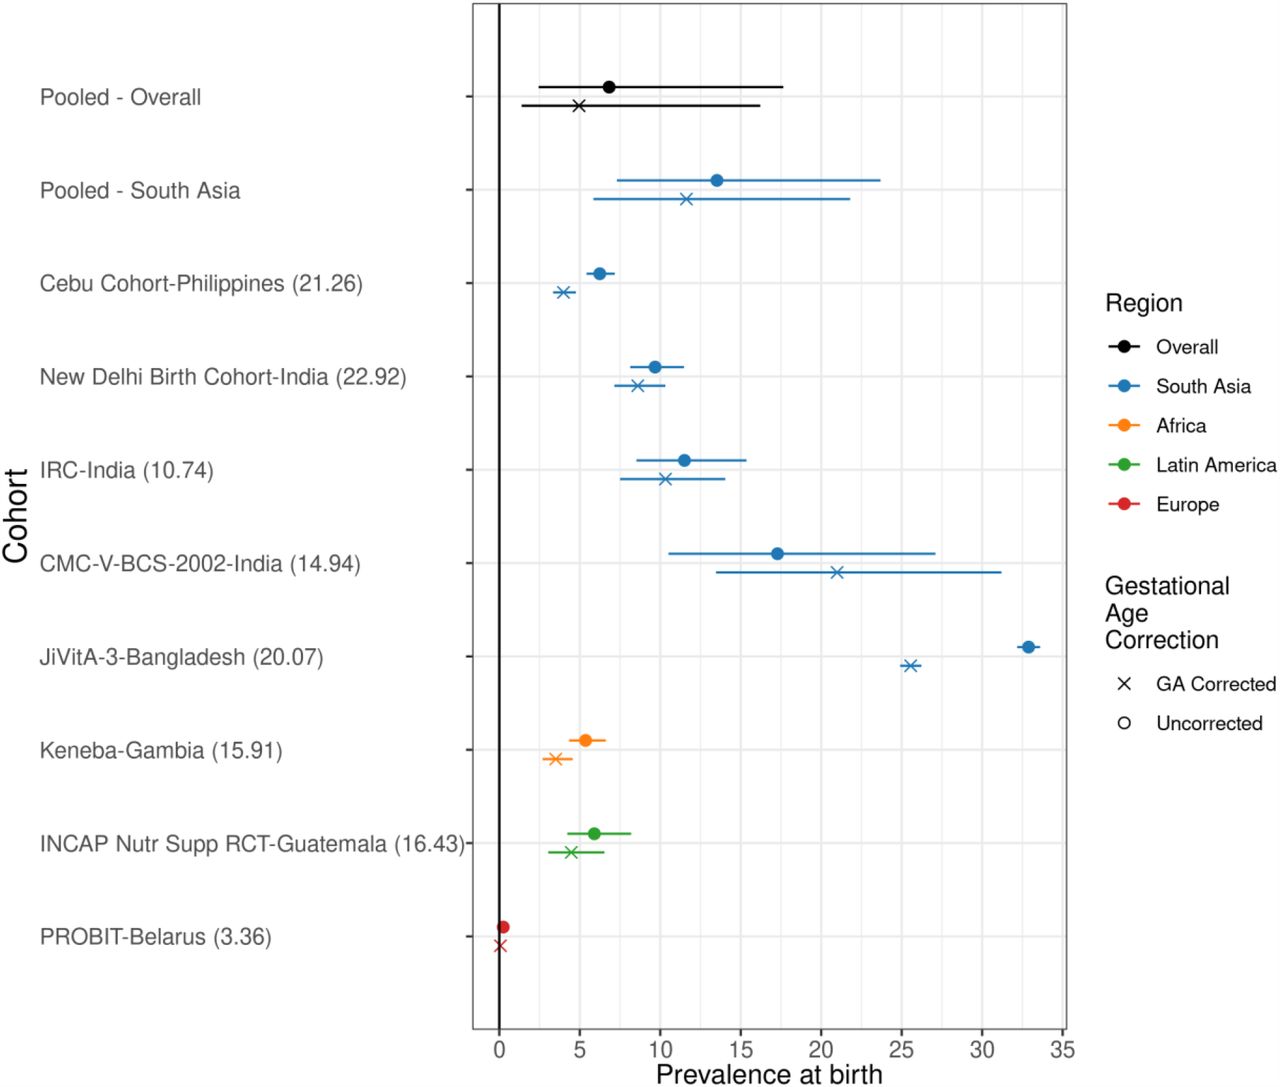
There were several limitations to the analyses. First, length estimates may be subject to measurement error; stunting reversal and relapse analyses that rely on thresholds are more sensitive to such errors. However, detailed assessments of measurement quality indicated that measurement quality was high across cohorts (https://child-growth.github.io/stunting/QA.html). Second, estimates of LAZ at birth using the WHO Child Growth Standards overestimate stunting among children who are born preterm.66 Accurate estimates of gestational age were not available in included cohorts; seven cohorts measured gestational age by recall of last menstrual period or newborn examination, and one cohort measured gestational age by ultrasound. In a sensitivity analysis adjusting for gestational age pooling across cohorts that measured it, stunting prevalence at birth was 1% lower (Extended Data Fig 5). Third, included cohorts were not inclusive of all countries in the regions presented here, and linear growth failure was more common in included African and South Asian cohorts than in corresponding contemporary representative surveys. However, the consistency between linear growth patterns in this and nationally representative surveys (Fig 2) suggests that overall our results have good external validity. Finally, the included cohorts measured child length every 1-3 months, and the exact ages of measurement varied, so the number of children and cohorts contributing to estimates differs between analysis strata. However, when we repeated analyses in cohorts with monthly measurements from birth to 24 months (n=18 cohorts in 10 countries, 10,830 children), results were similar (https://child-growth.github.io/stunting/monthly.html).

This figure includes the results from correcting at-birth Z-scores in the ki cohorts that measured gestational age (GA) for 37,218 measurements in 8 cohorts. The number in the parentheses following each cohort name indicates the prevalence of pre-term birth in each cohort. The corrections are using the Intergrowth standards and are implemented using the R growthstandards package (https://ki-tools.github.io/growthstandards/). Overall, the stunting prevalence at birth decreased slightly after correcting for gestational age, but the cohort-specific results are inconsistent. Observations with GA outside of the Intergrowth standards range (<168 or > 300 days) were dropped for both the corrected and uncorrected data. Prevalence increased after GA correction in some cohorts due to high rates of late-term births based on reported GA. Gestational age was estimated based on mother’s recall of the last menstrual period in the Jivita-3, Cebu, New Delhi, INCAP, IRC, and CMC-V-BCS-2002 cohorts, was based on the Dubowitz method (newborn exam) in the Keneba cohort, and was based on ultrasound measurements in the PROBIT trial.
Conclusion
The WHO Global Nutrition Targets and Sustainable Development Goals set ambitious targets to improve child linear growth by 2025. Our findings of early linear growth failure onset and infrequent reversal for a majority of children who faltered support interventions delivered from conception to the early postnatal phase along with continued delivery of postnatal interventions to prevent linear growth failure among children in LMICs.
Data Availability
The data that support the findings of this study are available from the Bill and Melinda Gates Foundation Knowledge Integration project upon reasonable request.
Materials and Methods
Study designs and inclusion criteria
We included all longitudinal observational studies and randomized trials available through the ki project on April 2018 that met 5 inclusion criteria: 1) conducted in low- or middle-income countries; 2) enrolled children between birth and age 24 months and measured their length and weight repeatedly over time; 3) did not restrict enrollment to acutely ill children; 4) enrolled at least 200 children; 5) collected anthropometry measurements at least every 3 months (Extended Data Figure 1). Thirty-one longitudinal cohorts in 15 countries followed between 1969 and 2014 met inclusion criteria. There was no evidence of secular trends in LAZ (https://child-growth.github.io/stunting/secular-trends.html). We calculated cohort measurement frequency as the median days between measurements. If randomized trials found effects on growth within the intervention arms, the analyses were limited to the control arm. We included all measurements under 24 months of age, assuming months were 30.4167 days. We excluded extreme measurements of LAZ > 6 or < –6 following WHO growth standard recommendations.1 In many studies, investigators measured length shortly after birth because deliveries were at home, but the majority of measurements were within the first 7 days of life (https://child-growth.github.io/stunting/age-meas.html); for this reason, we grouped measurements in the first 7 days as birth measurements. Gestational age was measured in only eight cohorts (7 cohorts measured it by recall of last menstrual period or newborn examination; 1 measured it by ultrasound); thus, we did not attempt to exclude preterm infants from the analyses.
Quality assurance
The ki data team assessed the quality of individual cohort datasets by checking the range of each variable for outliers and values that are not consistent with expectation. Z-scores were calculated using the median of replicate measurements and the 2006 WHO Child Growth Standards.1 In a small number of cases a child had two anthropometry records at the same age, in which case we used the mean of the records. Analysts reviewed bivariate scatter plots to check for expected correlations (e.g., length by height, length/height/weight by age, length/height/weight by corresponding Z-score). Once the individual cohort data was mapped to a single harmonized dataset, analysts conducted an internal peer review of published articles for completeness and accuracy. Analysts contacted contributing investigators to seek clarification about potentially erroneous values in the data and revised the data as needed.
Outcome definitions
We used the following summary measures in the analysis:
Prevalent stunting was defined as the proportion of measurements within a specific stratum (e.g., age) below the 2006 WHO standard –2 LAZ, and analogously below –3 LAZ for severe stunting. For each age, we included children with LAZ measurements within one month before and after that age in the point prevalence estimate to account for variation in the exact age of child measurement. For example, point prevalence at 6 months included children aged 5-7 months.
Incident stunting episodes were defined as a change in LAZ from above –2 Z in the prior measurement to below –2 Z in the current measurement. Similarly, we defined severe stunting episodes using the –3 Z cutoff. Children were considered at risk of stunting at birth, so children born stunted were considered to have an incident episode of stunting at birth. Children were also assumed to be at risk of stunting at the first measurement in non-birth cohorts and trials. Children whose first measurement occurred after birth were assumed to have experienced stunting onset at the age halfway between birth and the first measurement. The vast majority of children were less than 5 days of age at their first measurement life (https://child-growth.github.io/stunting/age-meas.html).
Incidence proportion We calculated the incidence proportion of stunting during a defined age range (e.g. 3-6 months) as the proportion of children at risk of becoming stunted who became stunted during the age range (the onset of new episodes).
Changes in stunting status were classified using the following categories: “Never stunted”: children with LAZ ≥–2 at previous ages and the current age. “No longer stunted”: children who previously reversed their stunting status with LAZ ≥–2 at the current age. “Stunting reversal”: children with LAZ <–2 at the previous age and LAZ ≥ –2 at the current age. “Newly stunted”: children whose LAZ was previously always ≥–2 and with LAZ <–2 at the current age. “Stunting relapse”: children who were previously stunted with LAZ ≥–2 at the previous age and LAZ <–2 at the current age. “Still stunted”: children whose LAZ was <–2 at the previous and current age.
Growth velocity was calculated as the change in length in centimeters between two time points divided by the number of months between the time points. We compared the change in length in centimeters per month measures to the WHO Child Growth Standards for linear growth velocity.2 We also estimated within-child rates of change in LAZ per month.
Measurement frequency
Analyses of prevalence, incidence, and growth velocity (Figs 2, 3, 5) included cohorts with at least quarterly measurements in order to include as many cohorts as possible. Analyses of fluctuations in stunting status (Fig 4) were restricted to cohorts with at least monthly measurements to allow evaluation of changes in stunting status with higher resolution.
Subgroups of interest
We stratified the above outcomes within the following subgroups: child age, grouped into one- or three-month intervals, (depending on the analysis); the region of the world (Asia, sub-Saharan Africa, Latin America); child sex, and the combinations of those categories.
Statistical analysis
All analyses were conducted in R version 3.4.2.3
Estimation of mean LAZ by age in Demographic and Health Surveys and ki cohorts
We downloaded standard DHS individual recode files for each country from the DHS program website (https://dhsprogram.com/). We used the most recent standard DHS datasets for the individual women’s, household, and height and weight datasets from each country. We obtained variables for country code, sample weight, cluster number, primary sampling unit, and design stratification from the women’s individual survey recode files. From the height and weight dataset, we used standard recode variables corresponding to the 2006 WHO growth standards for height-for-age.
After excluding missing observations, restricting to measurements of children 0-24 months of age, and restricting to z-scores within WHO-defined plausible values, surveys collected from 2006 to 2018 in 51 countries were included (Extended Data Table 2). Surveys from Afghanistan, Bolivia, Brazil, Central African Republic, Colombia, Indonesia, Nicaragua, Philippines, Paraguay, and Vietnam did not meet these inclusion criteria and were excluded from the analysis.
We classified countries into regions (South Asia, Latin America, and Africa) using the World Health Organization regional designations with the exception of the classification for Pakistan, which we included in South Asia to be consistent with prior linear growth studies using DHS.4 One included cohort was from Belarus, and we chose to exclude it from region-stratified analyses as it was the only European study.
We estimated age-stratified mean from ages 0 to 24 months within each DHS survey, accounting for the complex survey design and sampling weights. We then pooled estimates of mean LAZ for each age in months across countries using a fixed effects estimator (details below). We computed two sets of pooled results: 1) DHS measuring children 0-24 months in countries that overlapped with ki study countries and 2) all DHS countries measuring children 0-24 months in each geographic region (as in Fig 2) and (https://child-growth.github.io/stunting/DHS.html). We compared DHS estimates with mean LAZ by age in the ki study cohorts, which we estimated using penalized cubic-splines with bandwidth chosen using generalized cross-validation.5 We used splines to estimate age-dependent mean LAZ in the ki study cohorts to smooth any age-dependent variation in the mean caused by less frequently measured cohorts.
Fixed and random effects models
Several analyses pooled results across study cohorts. The primary method of pooling was using random effects models. This modeling approach assumes that studies are randomly drawn from a hypothetical population of longitudinal studies that could have been conducted on children’s linear growth in the past or future. We also fit fixed effects models as a sensitivity analysis (https://child-growth.github.io/stunting/fixed-effects.html); inferences about estimates from fixed effects models are restricted to only the included studies.6
Random effects models assume that the true population outcomes θ are normally distributed with mean μ and variance τ2 (i.e., that θ ∼ N(μ, τ 2)). To estimate outcomes in this study, the random effects model is defined as follows for each study in the set of i = 1, …, k studies:  where yi is the observed outcome in study i, ui is the random effect for study i, and ei is the estimated outcome for study i, and ei is the sampling error within study i. The model assumes that ui ∼ N(0, τ 2) and ei ∼ N(0, vi), where vi is the study-specific sampling variance. We fit random effects models using the restricted maximum likelihood estimator.7,8 If a model failed to converge, models were fit using a maximum likelihood estimator instead. The estimate of μ is the estimated mean outcome in the hypothetical population of studies (i.e., the estimated outcome pooling across study cohorts).
We also fit inverse variance weighted fixed effects models defined as follows:  where
where  is the weighted mean outcome in the set of k included studies, and wi is a study-specific weight, defined as the inverse of the study-specific sampling variance vi.
  is the estimated mean outcome in the specific studies included in this analysis.
For both types of outcomes, we pooled binary outcomes on the logit scale and then back-transformed estimates after pooling to constrain confidence intervals between 0 and 1. For cohort-stratified analyses, which did not pool across studies, we estimated 95% confidence intervals using the normal approximation (https://child-growth.github.io/stunting/cohort.html).
For the estimates of changes in stunting status, to ensure that percentages summed to 100%, results in Fig 4a were not pooled using random effects. Results were similar when pooling with random effects (https://child-growth.github.io/stunting/fixed-effects.html#changes-in-stunting-status-by-age).
Estimation of prevalence and incidence
We estimated prevalence and incidence as defined above in 3-month age intervals within specific cohorts and pooled within region and across all studies (Fig 3). Pooled analyses used random effects models for the primary analysis and fixed effects models for sensitivity analyses as described above.
Estimation of changes in stunting status
To assess fluctuations in stunting status over time, we conducted an analysis among cohorts with at least monthly measurements from birth through age 15 months to provide sufficient granularity to capture changes in stunting status. Because only 12 cohorts in 10 countries met these criteria, we performed only pooled analyses (i.e., we did not stratify by region or study cohort) to ensure the sample size was sufficient. We estimated the proportion of children in each stunting category defined above under “Changes in stunting status” at each month from birth to 15 months. To ensure that percentages summed to 100%, we present results that were not pooled using random effects. Analyses using random effects produced similar results (https://child-growth.github.io/stunting/fixed-effects.html#changes-in-stunting-status-by-age).
To examine the distribution of LAZ among children with stunting reversal, we created subgroups of children who experienced stunting reversal at ages 3, 6, 9, and 12 months and then summarized the distribution of the children’s LAZ at ages 6, 9, 12, and 15 months. Within each age interval, we estimated the mean difference in LAZ at older ages compared to the age of stunting reversal and estimated 95% confidence intervals for the mean difference. Pooled analyses used random effects models for the primary analysis and fixed effects models for sensitivity analyses as described above.
Linear growth velocity
We estimated linear growth velocity within 3-month age intervals stratified by sex, pooling across study cohorts (Fig 5) as well as stratified by geographic region (Extended Data Fig 4) and study cohort (https://child-growth.github.io/stunting/cohort.html). Analyses included cohorts that measured children at least quarterly. We included measurements within a two-week window around each age in months to account for variation in the age of each length measurement. Pooled analyses used random effects models for the primary analysis and fixed effects models for sensitivity analyses as described above (https://child-growth.github.io/stunting/fixed-effects.html).
Sensitivity Analyses
We conducted three sensitivity analyses; results are available at (https://child-growth.github.io/stunting). First, to assess whether inclusion of PROBIT, the single European cohort, influenced our overall pooled inference, we repeated analyses excluding the PROBIT cohort. Results were very similar with and without the PROBIT cohort. Second to explore the influence of differing numbers of cohorts contributing data at different ages, we conducted a sensitivity analysis in which we subset data to cohorts that measured anthropometry monthly from birth to 24 months (n=8 cohorts in 8 countries, 8,457 children. Third, we compared estimates pooled using random effects models presented in the main text with estimates pooled using fixed effects inverse variance weighted models. The random effects approach was more conservative in the presence of study heterogeneity.
Data and code availability
The data that support the findings of this study are available from the Bill and Melinda Gates Foundation Knowledge Integration project upon reasonable request. Replication scripts for this analysis are available here: https://github.com/child-growth/ki-longitudinal-growth.
Author contributions
Conceptualization: J.B., A.M., J.M.C., K.H.B., P.C., B.F.A
Funding Acquisition: J.M.C., A.E.H., M.J.V., B.F.A.
Data curation: J.B., A.M., J.C., O.S., W.C., A.N., N.N.P., W.J., E.O.C., S.D., N.H., I.M., H.L., R.H., V.S., J.H., T.N.
Formal analyses: J.B., A.M., J.C., O.S., W.C., A.N., N.N.P., W.J., E.O.C., S.D., N.H., I.M., H.L., V.S., B.F.A
Methodology: J.B., A.M., J.M.C, J.C., O.S., N.H., I.M., A.E.H., M.J.V.,K.H.B., P.C., B.F.A.
Visualization: J.B., A.M., A.N., N.N.P., S.D., A.S., J.C., R.H., K.H.B., P.C., B.F.A.
Writing – Original Draft Preparation: J.B., A.M., B.F.A.
Writing – Review & Editing: J.B., A.M., J.M.C., K.H.B., P.C., B.F.A., ki Child Growth Consortium members
Competing interest declaration
Thea Norman is an employee of the Bill & Melinda Gates Foundation (BMGF). Kenneth H Brown and Parul Christian are former employees of BMGF. Jeremy Coyle, Vishak Subramoney, Ryan Hafen, and Jonas Häggström work as research contractors funded by the BMGF.
Additional information
Supplementary Information is available for this paper here: https://child-growth.github.io/stunting/
Acknowledgments
This research was financially supported by a global development grant (OPP1165144) from the Bill & Melinda Gates Foundation to the University of California, Berkeley, CA, USA. We would also like to thank the following collaborators on the included cohorts and trials for their contributions to study planning, data collection, and analysis: Muhammad Sharif, Sajjad Kerio, Ms. Urosa, Ms. Alveen, Shahneel Hussain, Vikas Paudel (Mother and Infant Research Activities), Anthony Costello (University College London), Benjamin Torun, Lindsey M Locks, Christine M McDonald, Roland Kupka, Ronald J Bosch, Rodrick Kisenge, Said Aboud, Molin Wang, Azaduzzaman, Abu Ahmed Shamim, Rezaul Haque, Rolf Klemm, Sucheta Mehra, Maithilee Mitra, Kerry Schulze, Sunita Taneja, Brinda Nayyar, Vandana Suri, Poonam Khokhar, Brinda Nayyar, Poonam Khokhar, Jon E Rohde, Tivendra Kumar, Jose Martines, Maharaj K Bhan, and all other members of the study staffs and field teams. We would also like to thank all study participants and their families for their important contributions.
References
Methods References
- 1.
- 2.
- 3.
- 4.
- 5.
- 6.
- 7.
- 8.
Extended Data References
- 1.
- 2.
- 3.
- 4.
- 5.
- 6.
- 7.
- 8.
- 9.
- 10.
- 11.
- 12.
- 13.
- 14.
- 15.
- 16.
- 17.
- 18.
- 19.
- 20.
- 21.
- 22.
- 23.
- 24.
- 25.
- 26.
- 27.
- 28.
- 29.
- 30.


