
Abstract
Serological assays can detect anti-SARS-CoV-2 (SARS2) antibodies, but their sensitivity often comes at the expense of specificity. Here we developed a Tripartite Automated Blood Immunoassay (TRABI) to assess the IgG response against SARS2. Calibration was performed with 90 prepandemic and 55 virologically and clinically confirmed COVID-19 samples. Posterior probabilities of seropositivities were calculated from 3×8 measurements of logarithmically diluted samples against the ectodomain and the receptor-binding domain of the spike protein and the nucleoprotein. We then performed 760’320 assays on 5’503 prepandemic and 26’177 copandemic samples from hospital patients and healthy blood donors. We found 176 seropositive samples between December 2019 and May 2020. The seroprevalence increased conspicuously in March 2020 but plateaued in late April at 0.8-1.6% in both cohorts, indicating an equilibrium between new infections and the waning of immunity. This points to a high effectiveness of containment measures and/or to unexpectedly rapid loss of humoral responses.
Introduction
Within just a few months of the onset of the SARS-CoV-2 (henceforth SARS2) pandemic, several million cases and hundreds of thousands of fatalities from Corona Virus Disease (COVID-19) have been registered. It has also indirectly caused many more deaths by hijacking healthcare resources, thereby making them unavailable to patients suffering from other diseases. In addition, COVID-19 has created profound economic distress for most travel-related industries. Finally, it has disrupted a plethora of industrial supply chains, resulting in a massive worldwide unemployment crisis that will undoubtedly cost many more human lives.
In order to alleviate the direct consequences of the SARS2 pandemic, governments and public healthcare agencies need granular and reliable data on the prevalence of infection, the incidence of new infections, and the spatial-temporal oscillations of these parameters within regions of interest. The acquisition of such data, however, is daunting and data are prone to misinterpretation [1]. Firstly, data needs to be acquired extremely rapidly. Secondly, their usefulness is dependent on being representative of large populations, meaning that they need to be acquired in massive numbers. Finally, the tolerance of false-positives and false-negatives must be extremely low in order to ensure an accurate estimation of the prevalence; the estimation is particularly challenging in low-prevalence areas.
Intuitively, PCR-based diagnostics would seem suitable to fulfill the above criteria. However, practical experience has shown that this is not the case. The acquisition of representative diagnostic material for PCR has proven challenging, with deep nasal swabs being difficult to perform, uncomfortable for patients and potentially hazardous for medical personnel. Accordingly, the sensitivity of PCR diagnostics is often disappointing, with reported false-negative rates of 25% even under the best conditions [2].
Serological assays, on the other hand, address the adaptive immune responses of the host which are fundamental to limiting viral spread within individuals and populations. While they lag behind the viral infection, they can serve as both powerful epidemiological tools as well as useful clinical aids. Firstly, antibodies can be easily retrieved from many biological fluids, notably including venous and capillary blood. Secondly, antibodies typically persist for several months whereas the viral load in the upper respiratory tract frequently wane within weeks [3]. Importantly, immunological assays can be largely automated, and are thus suitable to mass screening of extremely large cohorts. This aspect is crucial since it provides a reliable readout of degree of immunity in a population, which is necessary for responsible easing of social restriction measures.
Representative testing of entire populations mandates fully automatable assays capable of outputting reliable results at extremely high rates and very low cost. Here we describe an assay that fulfills these criteria. We have screened 31’680 samples for antibodies against three SARS2-related antigens: the ectodomain of the spike protein (S), its receptor-binding domain (RBD) and the nucleocapsid protein (NC), using SARS2 enzyme-linked immunoassays (ELISA) [4-6]. Samples included patients entering the University Hospital of Zurich (USZ) from December 2019 to the present (defined as “copandemic”; n=18’696), a cohort of patients treated at USZ between 2016 and 2018 (“prepandemic”; n=4’407), as well as 1’096 prepandemic and 7’405 copandemic samples from blood donors in Zurich. Our test cohorts were completed by virologically and/or clinically confirmed cases with SARS2 infections (22 annotated USZ samples and 54 additionally recruited samples for blood donation service). Our results paint a detailed picture of the spread of the pandemic within the greater Zurich area, and may be representative of other metropolitan areas with a highly mobile population served by large international airports.
Results
TRABI: a miniaturized high-throughput ELISA for multiple SARS2 antigens
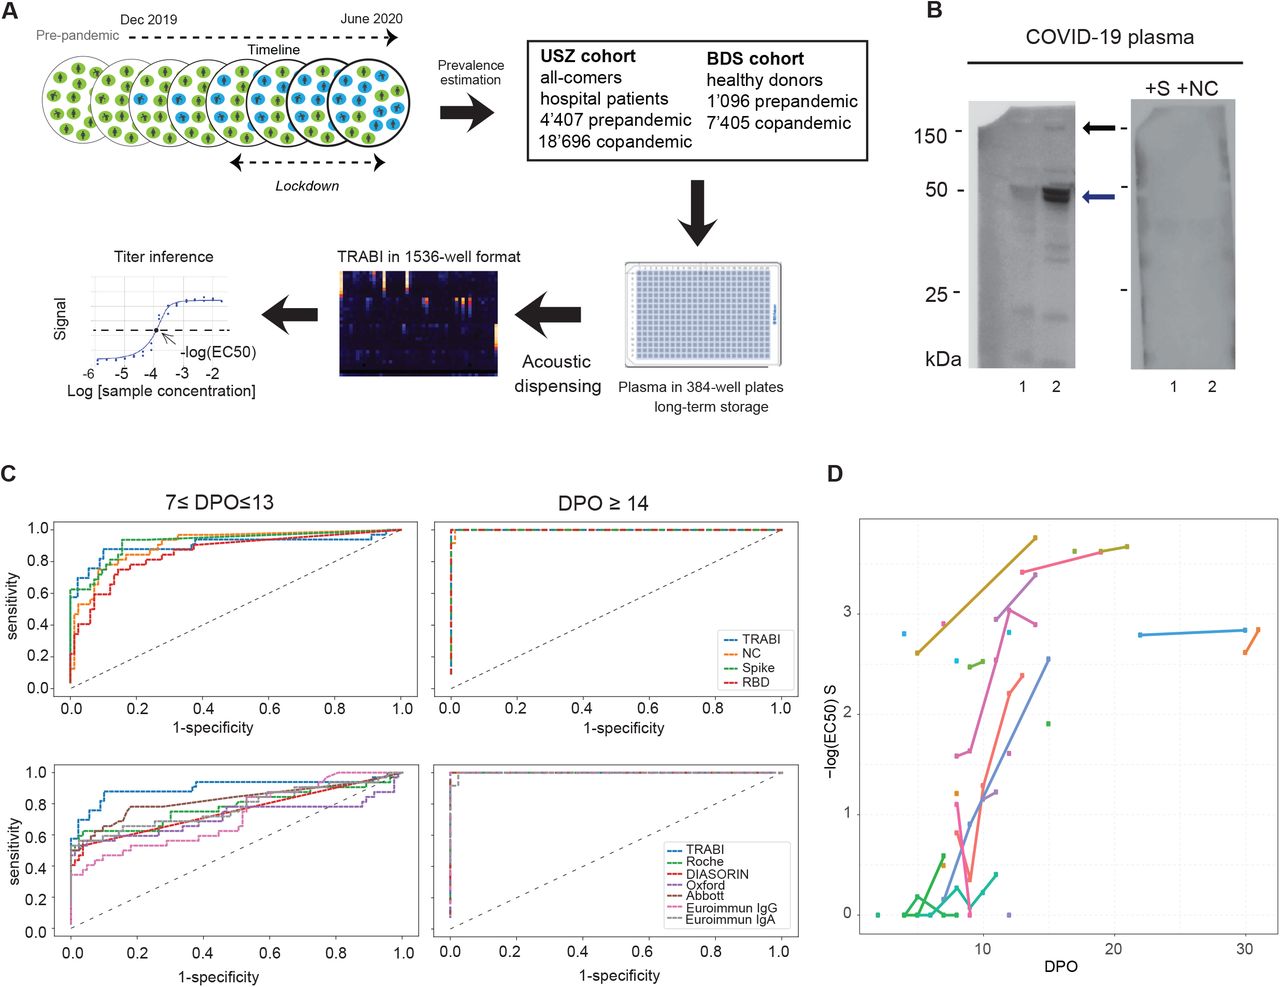
The goal of this project was to assess the rate of seroconversion throughout the course of the pandemic in tens of thousands of individuals who may have been exposed to SARS2. This requires high specificity of the assay procedure in order to avoid false-positive results, while not compromising its sensitivity and risking to underestimate the prevalence of anti-SARS2 antibodies. Equally crucial is the ability to maintain a throughput of >4’000 samples/24h, and to minimize the costs of reagents and labor. We achieved these goals (1) by testing for multiple viral antigens, (2) by employing extensive automation including contactless fluid-handling, (3) by reducing the sample volumes to the nanoliter scale, and (4) by combining multiple antigen measurements via statistical techniques. The TRABI assay described below utilizes contactless acoustic dispensing [7, 8] to transfer droplets (5 nl each) of plasma into high-density 1536-well plates (total volume: 3 µl) and measures the IgG response against viral proteins in an immunosorbent format (Fig. 1A and Fig. S1A for detailed procedure).

A. To estimate the prevalence of SARS2 seropositivity in the population, prepandemic and copandemic samples frm two independent cohorts were analyzed by high-throughput microELISA (TRABI). IgG titers against S, RBD and NC were determined and the –log(EC50) was inferred by regression analysis. B. Vero cells infected with SARS2 (lane 2), but not uninfected cells (lane 1), showed signals corresponding to S (black arrow) and NC (blue arrow, pointing at two bands) when immunoblotted with COVID-19 patient plasma. NC protein undergoes a proteolytic cleavage in SARS-CoV infected VeroE6 cells, resulting in two distinct bands of around 46 and 43 kDa. We confirmed the identity of the two bands by probing with an anti-NC antibody (Sino Biologicals, data not shown). Spiking of COVID-19 patient plasma with recombinant S and NC led to the disappearance of all signals. C. Using 53 samples from confirmed SARS2 patients and 83 prepandemic samples, we assessed the specificity-sensitivity relationship for all antigens individually and after combining all results into a single score (TRABI) using QDA-based posterior probability. Between 7 and 13 dpo, approximately 60% of samples were positive (posterior probability >0.5) at 100% specificity cutoff, whereas 100% sensitivity was reached at ≥ 14 dpo. D. COVID and prepandemic samples were used to assess the performance of TRABI, commercial tests (Roche, DiaSorin, Abbott, Euroimmun) and an assay developed at the Target Discovery Institute (Oxford). While all tests scored equally at ≥14 dpo, TRABI outperformed all other assays at ≤13 dpo. E. Time course of IgG response in 55 samples from 27 COVID patients. IgG antibodies were reliably detectable at ≥13 dpo. Colors represent individual patients.
In order to identify the most suitable viral targets for TRABI, we infected Vero cells with wild-type SARS2 virus. Cell lysates were then subjected to Western blotting using the plasma of patients with confirmed COVID-19 (n=7). The bands corresponding to the spike (S) and nucleocapsid (N) proteins were prominently visible in infected cells, but were undetectable in non-infected cells and were suppressed by adding soluble S and NC antigen to the patient plasma before incubation with the Western blot (Fig. 1B). Accordingly, we selected the SARS2 spike protein [9], the receptor binding domain (RBD, amino acids 330-532 of the S protein), and the nucleocapsid protein (NC, amino acids 1-419) as target antigens for TRABI. Each sample was tested at eight consecutive two-fold dilution points (1:50 to 1:6400), and the resulting data were fitted to a sigmoidal curve by logistic regression. The inflection point (or –log10(EC50)) of each sigmoid was defined as the respective antibody titer.
As reference samples for assay establishment, we utilized a collective of 55 venous plasma samples drawn at various days post onset of symptoms (dpo) from 27 RT-qPCR confirmed patients suffering from COVID-19 and hospitalized at the University Hospital of Zurich (USZ, true positives), as well as 90 anonymized USZ samples from the prepandemic era (true negatives) (see Table S1). We then constructed receiver-operating-characteristics (ROC) curves to assess the assay quality for each antigen individually. Finally, we created a composite metric that integrates S/RBD/NC measurements using quadratic discriminant analysis (QDA). While each single antigen showed excellent discrimination of negatives and positives on samples drawn at ≥14 dpo, the compound models outperformed the individual antigen measurements at 7-13 dpo, where the emergence of an IgG response is expected to be variable (Fig. 1C). We therefore used the QDA modeling assumptions to infer the prevalence in large cohorts based on the distributional information of true negatives and true positives (details in Methods) using information gained from all three antigens.
To benchmark TRABI, we compared the results with a high-throughput assay under development at the University of Oxford as well as assays commercialized by Roche (Elecsys), DiaSorin, EuroImmun, and Abbott (Fig. 1D). This comparative assessment was based on 136 of 146 samples (10 samples were removed from the analysis because of insufficient sample volume to perform all tests). While all assays displayed 100% specificity/sensitivity at late time points, TRABI scored best at early time points. When these results were plotted as a function of dpo, a temporal pattern emerged consistent with the gradual emergence of IgG antibodies within 14 dpo (Fig. 1E).
Temporal evolution of SARS2 pandemics on the population level
Due to supply-chain bottlenecks, but also because of the intrinsically narrow window of infectivity, testing of individuals for the presence of SARS2 nucleic acids is currently limited to those at elevated risk. In Switzerland, individuals with mild symptoms were asked to isolate at home, often without being tested for the presence of SARS2 RNA. Thus, the true number of people who underwent an infection with SARS2 may at best be a rough estimate modelled on data of PCR-confirmed cases and numbers of hospitalizations [10, 11]. We are therefore using TRABI to screen a large sample of Swiss urban populations. To date, we have screened 31’680 samples from a university hospital cohort of Zurich (USZ) of individuals with diverse diseases (Table S1) and from the blood donation service (BDS, see Table S1) of Zurich (healthy group), starting from December 2019 (Fig. S2A, B).
To reliably measure the prevalence of seroconversion, we used known positives and negatives as internal calibrators for each cohort. These condition-positives/negatives were screened simultaneously to all other samples using exactly the same procedures. Their annotation as condition positives/negatives was performed post-hoc using USZ and BDS databases in the absence of serological data. First, we identified all USZ samples with known positive SARS2 RT-qPCR results (n=189). Condition-positive samples (n=22) were defined as those with (1) clinically manifest COVID-19, (2) positive RT-qPCR for SARS2 and (4) venipuncture occurring ≥ 14 days after the positive qPCR. To avail of condition-positives from the cohort of blood donors, 54 samples from convalescent individuals with PCR-confirmed SARS2 infection recruited for a plasmapheresis study were included.
To determine potentially unspecific results, e.g. due to cross-reactivity with other coronaviruses, we screened 5’503 prepandemic samples (condition-negatives). For the BDS cohort, we enriched the condition-negatives with 2,100 samples from December 2019 and January 2020 to increase the numbers of the assumed negatives and to obtain a more reliable baseline. We tested two models: the first model assumes that both the condition-positive and negative data follow distinct multivariate Gaussian distribution with unequal covariances (QDA) (Fig. 2A, B), whereas the second model is based on Gaussian distributions with equal covariances (LDA) (Fig. S2C, D). LDA was additionally performed because it allows to verify the distributional assumptions more readily (Fig. S2E, F). Using the distributions of the condition negatives and the condition positives, we computed the posterior probability (i.e. the probability of an individual to be seropositive as modeled via the distribution of the known condition-negatives and known condition-positives) for all data points (see Fig. S2A, B). The respective ROC curves were then plotted (Fig. S2G, H). At 100% specificity, we identified 20/22 of the annotated true positives for the USZ (Fig. S2G) and 36/54 annotated true positives for the BDS cohort (Fig. S2H). For the BDS cohort, the sensitivity increased rapidly with a slight decrease in specificity (at a false-positive-rate of 0.001, we identified 49/54 condition positives). We then applied this model to estimate the prevalence in the population. No substantial shift above baseline was inferred for samples screened from January, February, and first half of March 2020 (Fig. 2C and Fig. S2I, USZ cohort). A sudden increase in prevalence manifests in the second half of March (QDA: 0.64% (95% confidence intervals: 0.22%-1.03%) and LDA: 0.65% (CI95%: 0.028%-1.07%)) and in the first half of April 2020 (QDA: 1.3% (CI95%: 0.6%-1.8%) and LDA: 0.11% (CI95%: 0.6%-1.6%)), in accordance with the virologically and clinically reported rise in SARS2 infections in these months. After that, the prevalences estimated in half month steps reached a plateau (average value across all half months 1.1% and 1.0% or QDA and LDA respectively). The BDS collective showed a comparable but slightly delayed time course of seroconversion, with the prevalence approximating 1.1% in April (QDA: 1.1% (CI95%: 0.6%-1.7%) and LDA: 1.1% (CI95%: 0.6%-1.7%)) and 1.6% May (QDA: 1.6% (CI95%: 0.9%-2.2%) and LDA: 1.6% (CI95%: 0.9%-2.2%)) (Fig. 2C and Fig. S2I).

A-B. Inflection points of dilution curves, denoted -log(EC50), of plasma titrated against S and RBD in the USZ and BDS cohorts. Posterior probabilities were calculated using QDA assuming a multivariate Gaussian distribution. C. Prevalence of SARS2 seropositivity in prepandemic (before 2019) and co-pandemic samples (from December 2019 to Beginning of May 2020) estimated using the posterior probabilities from the multivariate Gaussian distribution. Bar: 95% confidence intervals (CI). D. TRABI reproducibility was assessed using duplicates run in pairs of independent assay plates. E. To assess potential cross-reactivity of SARS2 seropositive individuals, we tested 210 high-scoring samples and 122 random samples for binding to the RBD of SARS1. SARS2 RBD binders with a high posterior probability (same color maps as in B) segregated within the higher anti-SARS1-RBD titers.
To challenge the technical reproducibility of TRABI, we selected 210 high-score samples and 122 random samples from known seronegatives and repeated the assays. The screens proved to be highly replicable when comparing the duplicates from the same screen (S: R2 = 0.85 among samples where both could be adequately fitted, see Fig. 2D) and the values from the follow-up screen with the values initially derived from serology (for example, 87% among re-screened samples with a -logEC50 for S above 2.5 had a -logEC50 value above 2 in the second screen, see Fig. S3).
Antibodies against the RBD of SARS-CoV (henceforth termed SARS1) can bind to the SARS2 RBD [12]. We therefore tested whether samples with high anti-SARS2-RBD titers display cross-reactivity with SARS1 RBD. For visualization, we binned samples into groups of absent, moderate and high SARS2 RBD titers (–log[EC50] <1.5, 1.5-2, and > 2.5, respectively) and computed their respective QDA-derived posterior probability. For individuals with SARS2 RBD titers < 2, a small fraction showed binding to SARS1 RBD at –log(EC50) > 2 (Fig. 2E). However, those with strong binding properties to SARS2 RBD (> 2.5) clustered at high values for SARS1 RBD, indicating that some anti-SARS2 RBD antibodies were cross-reactive to SARS1 RBD.
In summary, TRABI identified first cases of SARS2 seroconversion in April 2020, consistent with first infections reported in the Zurich area towards the end of February 2020. While data obtained from healthy individuals suggest that around 1% of blood donors have been infected despite the absence of anamnestic COVID-19, the serological prevalence was about 5-fold higher than that of RT-qPCR confirmed cases for the same time point. We conclude that at the time of writing seroconversion within the greater area of Zurich is still exceedingly rare and very far from herd immunity.
Clinical and demographic characteristics of serologically confirmed SARS2 infected hospital patients and healthy donors
Approximately 18% of the USZ samples stem from repeat venipunctures of patients. For the purpose of the following analyses, these samples were not considered (if multiple draws were available, the one with the highest posterior probability was used). Seropositivity was defined as having a posterior probability > 0.5. USZ cohort had a median age of 55 years (39 – 68 lower and upper quartile respectively) with a median for seropositives of 57 years (42 - 66) (Fig. 3A and Table S1). BDS cohort for April and May had a median age of 42 years (29 - 53), and seropositives had a median age of 40 (26 - 51) (Fig. 3B and Table S1). The majority (76%) of patients in the USZ cohort stemmed from the canton of Zurich (including the city of Zurich), with smaller contributions by cantons Aargau, Schwyz, St. Gallen, and Thurgau (Fig. 3C). Inhabitants of the city of Zurich constituted a comparatively larger proportion of SARS2 seropositives than the rest of the canton of Zurich.

A. and B. Age and gender pyramids for the USZ (A) and the BDS (B) cohorts with indications of the respective posterior probability (p > 0.5). A contour of the respective age pyramid for the inhabitants of the Canton of Zurich was drawn based on data provided by the statistical service of the Canton of Zurich. The narrower age spectrum of blood donors reflects regulatory restrictions of donation. C. Total samples (dark blue) and seropositive samples (light blue) stratified by the geographic residence of sample donors. D. Stratification of seropositivity by PCR annotations within the USZ cohort. E. Distribution of plasma samples by clinical departments of the hospital (dark blue: totals; light blue: posterior probability > 0.5).
We then investigated the presence of a positive SARS2 PCR result among the SARS2 seropositive samples detected in our study. Here, we saw that 20 samples have clear clinical indications for COVID-19 and a positive PCR more than 14 days before the sample was drawn, 9 positive PCR > 14 days before sampling with uncertain COVID-19 status based on clinical reports, and 35 had a positive PCR ≤ 14 days before phlebotomy of the sample at our avail (Fig. 3D). Notably, we detected 71 samples without a SARS2-positive PCR annotation. The blood of USZ patients was drawn in 39 clinical departments (Fig. 3E), 23 of which treated patients that with a posterior probability > 0.5. In absolute counts, most SARS2-positive samples were obtained from the Infectious Disease and Hospital Hygiene ward, followed by the departments of Internal Medicine, Medical Oncology and Hematology, and Cardiology. The wide range of medical departments suggests that SARS2 seropositive patients do not solely enter the hospital for the treatment of COVID-19 but for any condition that requires the attention of a USZ physician. Lastly, seropositivity can be found across all age groups and in both genders (Fig. 3A, B, Table S1). Long-term monitoring of SARS2 seropositivity will reveal comorbidities potentially associated with SARS2 infections.
Prevalence of anti-SARS2 antibodies in prepandemic samples
5’503 prepandemic plasma samples (4’407 USZ hospital patients and 1’096 healthy BDS donors) were examined for the presence of cross-reactive antibodies against S, RBD and NC of SARS2. Several individuals had a strong antibody response against a single antigen and an absence of binding to other antigens (Fig. S2A, B). We then directly compared prepandemic and copandemic samples in the USZ cohort on the basis of single antigens and their respective posterior probabilities. When focusing on samples with high values for single assays, we observed an enrichment of high posterior probabilities in pandemic but not in the prepandemic group (Fig. 4A). Among samples with individual –log(EC50) values above 2 in May and June 2020, 68% (S), 78% (RBD), and 17% (NC) had a posterior probability > 0.5. At the same time, no sample with an individual assay level above 2 had a posterior probability above 0.5 in the prepandemic samples. This enrichment is suggestive of a substantial performance improvement when using the combined metric in the USZ cohort.

A. Posterior probability were calculated assuming a Gaussian distribution and visualized for individual antigens (S, RBD and NC) for prepandemic samples vs. copandemic USZ samples drawn in May and June 2020. Prepandemic samples exhibited a low posterior probability as they typically reacted against single antigens, leading to low rankings in a composite metric. For further testing, comparative samples were chosen from the prepandemic era and from May and June 2020. Arrows point to samples of individuals used in (B), (C), (D). P1-6: prepandemic 1-6; C1-2: COVID1-2. B. Western Blot analysis of two samples from May/June 2020 (“COVID 1” and “COVID 2”) and several prepandemic samples (denoted with 2, 4 and 5). Anti-his-tag antibody was included as a positive control. Lane 1 = non-transfected Expi293F cell lysate; Lane 2 = Expi293F cell lysates expressing his-tagged S, NC and RBD proteins. Black arrows: S; blue arrows: NC; purple arrow: RBD. C. ELISA assays on the same samples as in B, using SARS2 S, NC, RBD and NSP1 as well as control proteins (BSA, CMV pp65). D. Soluble recombinant S or RBD were spiked into plasma at 0.04-88 nM (S) and 0.7-1350 nM (RBD), in the same samples as in B and C, and ELISA was then performed with immobilized RBD or S. Data points represent averages of duplicates. Soluble antigens suppressed the ELISA signal in the COVID samples but not in the prepandemic sample, showing that the antibodies present in the latter had lower affinities for SARS2 targets.
We then compared the immunochemical properties of six prepandemic samples with high binding to S, RBD or NC to two samples of confirmed COVID-19 (COVID 1 and 2, see annotation in Fig. 4A). The COVID samples, but not the prepandemic samples, recognized in Western blots the S and NC antigens of SARS2 expressed by Expi293F (Fig. 4B and Fig. S4A). Additional ELISAs performed on the same samples confirmed the initial findings (Fig 4C and Fig. S4B) including intact binding to the RBD. The discrepancy between ELISA and Western Blot suggests that the RBD is a highly conformational epitope lost upon boiling and SDS denaturation.
To further probe the specificity of the findings, we also carried out competitive ELISAs on prepandemic and COVID patients. First, we determined plasma concentrations close to the EC50. Then we pre-incubated appropriately diluted samples with various concentrations of S and RBD (0.04-88 and 0.7-1350 nM, respectively). Samples were then transferred onto ELISA plates coated with S, RBD, and NC. The concentration-dependent displacement of the measured optical density was then visualized (Fig. 4D and Fig. S4C). We found that both soluble S and the RBD caused a concentration-dependent depletion of the RBD in COVID samples. The S signal could not be depleted with RBD, indicating the presence of epitopes other than the RBD. One prepandemic sample (#1, see Fig. S4C) displayed competition of the S signal with soluble S but not with soluble RBD. Other prepandemic samples did not show competition at all, suggesting that their reactivity was due to high concentrations of low-affinity antibodies cross-reacting with SARS2 S.
Identification of asymptomatic cases and clonality of anti-S immune response
TRABI enabled the identification of 41 blood donors with no objective signs of SARS2 infection and no anamnestic symptoms (Fig. 2B, C) despite clear serological indications of past infection and antibody titers in the same range as those of symptomatic individuals (Fig. 5A). We assessed IgG and IgA antibodies to S, RBD, and NC as well as responses to multiple control antigens, in 4 asymptomatic blood donors and 4 convalescent individuals recruited to the BDS. We observed binding of IgG antibodies in asymptomatic and convalescent individuals against S, RBD, and NC, with usually lower IgA titers. No binding against the SARS2 non-structural-protein 1 (NSP1), or against bovine serum albumin (BSA) was observed.

A. ELISA assays of asymptomatic vs. convalescent individuals. B. Microfluidic-based assessment of binding between an Alexa 647-labelled RBD antigen and antibodies in solution. No change in diffusion coefficient or the associated hydrodynamic radius was observed in control samples, while all ELISA-positive samples from convalescent and healthy donors indicated a clear binding of antibodies to RBD, confirming the ELISA-based results. C. Western Blot analysis of the same individuals tested in (A). Lane 1 = non-transfected Expi293F cell lysate; Lane 2 = Expi293F cell lysates expressing his-tagged S, NC and RBD proteins. Black arrows: S. Blue arrows: NC. D. Competitive ELISA using RBD or S for soluble competition with antibodies in plasma from the same individuals as in (A) and (C). Each point is the average of duplicates with error bars except for “asymptomatic 4” in the competitive ELISA using soluble RBD and immobilization for RBD which is a unicate.
To further validate the seropositivity in asymptomatic blood donors, we employed an orthogonal methodology which allows antibody/antigen interactions to be probed in solution, without any immobilization of antigens to a surface. Samples of SARS2 convalescent individuals, healthy donors and controls were preincubated with fluorescently conjugated RBD protein. We then monitored the increase in the effective molecular weight of an Alexa647-labelled RBD construct in solution upon complex formation with an antibody present in the patient sample. This was achieved by measuring the associated decrease in its molecular diffusion coefficient upon binding using a microfluidic platform. While no change in diffusion coefficient or the associated hydrodynamic radius was observed in control samples, all ELISA-positive samples from convalescent and healthy donors indicated a clear binding of antibodies to RBD (Fig. 5B). We confirmed these findings by using the samples of several asymptomatic and convalescent individuals as primary antibodies in Western Blot and detected bands for both S and the NC in the Expi293 cells over-expressing the viral proteins but not in the Expi293 control lysate (Fig. 5C).
To obtain a rough estimate of the clonality and epitope specificity of the immune response raised against the S protein, we conducted an ELISA-based soluble antigen competition. Competition with the RBD lead to a decrease in ELISA signal for RBD but not for S or NC in both convalescent and asymptomatic individuals (Fig. 5D and Fig. S5). Conversely, competition with S decreased the signal for both S and the RBD (Fig. 5D), suggesting the presence of antibodies targeting multiple S epitopes, including RBD. Therefore, the immune response against S was polyclonal and involved multiple viral epitopes.
Discussion
The high-throughput pipeline for SARS2 serology described above has enabled us to study a cohort of >35’000 individuals over the time span of the pandemic. In view of the critique levelled at past serological studies [1, 13], we have gone to great lengths to assess and validate our technology. For the initial assay calibration, sensitivity was measured using a panel of clinically and RT-qPCR-confirmed SARS2 sera (n=55) at various time points after onset of clinical signs and symptoms and 90 negative controls. A blinded comparison with commercial test kits showed that our approach, which combines three individual assays into one single score, was suitable for large-scale epidemiologic studies.
A key question of relevance to public health is the true rate of people who have already contracted the virus. As a proxy for the estimation of the true prevalence in the population of the greater area of Zurich, we have used two independent cohorts: (1) unselected patients coming from all clinical departments of USZ and (2) healthy individuals donating blood to local blood banks (BDS). The availability of known positives and negatives in both cohorts allowed us to model the posterior probability from the multiple available antigen measurements, using the respective distributions of these intrinsic controls. Combining the metrics did indeed lead to a power gain, as shown by the enrichment of samples with high posterior probabilities in excess of the single assays during the pandemic phase. As a possible drawback, the direct modeling of the multivariate distribution of antigen measurements may hinder the detection of deviations from the modeling assumptions. We explored the robustness to modeling assumptions by employing a mixed univariate Gaussian distribution and saw generally good agreement for prevalence estimations. The extent of our sampling bolsters our confidence in the representativity and validity of our results.
In both cohorts, the prevalence of seropositives climbed over the baseline in late March 2020 and has stably lingered between 0.8 and 1.6% ever since. But are our cohorts representative for the population of the greater area of Zurich? On the one hand, the USZ cohort consists mostly of individuals suffering from disparate diseases, some of which may be a consequence of SARS2 infections. On the other hand, individuals with acute infections are typically excluded from donating blood. As a consequence, the BDS cohort may be biased against individuals who may have experienced COVID-19 symptoms and refrained from donating. Yet, despite these fundamental differences in their composition, seroprevalence estimates from both cohorts are in good agreement. This observation underscores the presumption that the prevalence reported here is truly representative of the population under study. Clearly, our study would benefit from the inclusion of cohorts with different age architectures, such as e.g. school children or individuals staying in retirement homes. While such cohorts have not been introduced in this study, the workflow established here could easily be adapted to the investigation of more focal populations.
The low prevalence and the early plateau of SARS2 seroconversion is unexpected for many reasons. The initial trajectory of the disease with high replicative numbers had engendered suggestions that a large swath of the population might have encountered the virus and developed humoral immunity. This idea is now soundly refuted. The prevalence around 1% is even more surprising when considering that (1) Switzerland borders on Northern Italy whose prevalence of infection was reported to reach 43% in healthcare workers [14], (2) Ticino and Western Switzerland were profoundly affected by the pandemic (see [15]), and (3) no travel restrictions were imposed between Ticino, the Romandie, and Northern Switzerland.
When set in relation to the regional numbers of RT-qPCR-positive cases, our cohort-based estimates of the seroprevalence (1.6% (CI95%: 0.9%-2.2% in early May 2020 for BDS) are in line with those of more affected regions of Switzerland such as Geneva (seroprevalence: 10.8% (CI95% 8.2–13.9%) beginning of May 2020 [16]) and are about 5-10 times higher than the respective incidence of overt COVID-19 [15]. Likewise, the infection-fatality rate (IFR) is similar between differently affected regions of Switzerland. With 266 deaths due to COVID-19 in Geneva until May 9th in a population of around 500’000 inhabitants [16], the resulting IFR is 0.5% (CI95%: 0.4-0.6%), which is similar to that of 0.3% (CI95%: 0.2-0.4%) in a German study [13]. Based on our seroprevalence and the number of inhabitants of the canton of Zurich of 1.5 million, the IFR for early May (number of deaths = 126) is 0.5% (CI95%: 0.4-0.9%). The overall IFR in Switzerland was estimated to be 0.5% (CI95%: 0.4-0.6%) [17].
If the seropositive status is long-lasting, the evolution of anti-SARS2 seroprevalence should reflect the cumulative incidence of new infections with a delay of ≤13 DPO. Therefore, the data presented here suggest that very few new infections have taken place in Zurich after April 1st, 2020, roughly 2 weeks after the enactment of lockdown measures. Alternatively (or additionally), the observed plateau of seroprevalence in the greater area of Zurich could be explained by rapid waning of antibodies directed against SARS2 antigens. In the latter scenario, the plateau would indicate an equilibrium between gain and loss of SARS2 seropositivity.
A recent publication [18] has shown pre-existing anti-SARS2 antibodies in unexposed humans. Our affinity determinations and immunoblots, however, point to fundamental differences between prepandemic seropositivity and the immune responses of SARS2-infected individuals. While the latter consistently showed high-affinity responses that were clearly visible in Western blotting, the few seropositive prepandemic sera were unanimously negative in Western blotting, and equilibrium displacement ELISA of one prepandemic plasma sample suggested a much lower affinity despite similar antibody EC50 titers. We conclude that any immune response in uninfected individuals, whether it represents cross-reactivity with common-cold coronaviruses or something else, is of inferior quality and may less likely be protective.
It has been proposed that asymptomatic individuals entail a different, weaker immune response to SARS2 [19]. While follow-up studies including affinity determinations, epitope mapping, and B-cell receptor repertoire analyses (described in [20]) will paint a more detailed picture, our data suggests that asymptomatic individuals enjoy an immune response comparable to the one seen in individuals with clinical signs of SARS2.
Our population-wide screen allows us to address several crucial questions that have been controversially discussed. What is the frequency of truly asymptomatic cases? What is the complete spectrum of clinical signs and symptoms with which SARS2-infected individuals present? Many SARS2 patients present with monosymptomatic anosmia caused by olfactory neuritis [21], and it is conceivable that other illnesses may represent hitherto unrecognized signs of SARS2 infection. Stratifying the results of our screens by clinical parameters (including international classification of diseases (ICD) codes as well as hematological clinical-chemistry values) will become increasingly important in the years to come, e.g. to protect those at risk, to evaluate immune defenses and their possible waning, and to plan vaccination campaigns.
Our study is conceived as a long-term exercise which, given appropriate funding, will be continued for the next several years. In addition to allowing precise monitoring of the population, it will also enable the determination of titer decays in seropositive individuals as a function of demographic indicators and of comorbidities. However, there are societal concerns linked to antibody testing, and scientists must not downplay them. Serology is a powerful medical and epidemiological instrument, but it can also be misused to stratify the workforce, to discriminate against the nonimmune, and even for far more nefarious deeds. Let’s study immune responses, but let’s not create a dystopian society based on them.
Materials and Methods
Human specimens and data
All experiments and analyses involving samples from human donors were conducted with the approval of the local ethics committee (KEK-ZH-Nr. 2015-0561, BASEC-Nr. 2018-01042, and BASEC-Nr. 2020-00802), in accordance with the provisions of the Declaration of Helsinki and the Good Clinical Practice guidelines of the International Conference on Harmonisation. Specimens were denoted according to the following conventions: prepandemic samples: samples collected before December 2019; COVID samples: samples from patients with clinically and/or virologically confirmed SARS2 infection; copandemic samples: any samples collected in December 2019 or thereafter.
Sample acquisition and biobanking
Small volumes (< 100 µL) of heparin plasma samples were obtained from the Institute of Clinical Chemistry at the University Hospital of Zurich as unique bio specimens, biobanked over recent years in a high-throughput liquid biobank. We received one sample per patient per month. After one month, another sample from the same individual would be included. EDTA plasma from healthy donors was obtained from the Blutspendedienst (blood donation service) Kanton Zürich and Kanton Luzern from donors who signed the consent that their samples can be used for con- ducting research.
High-throughput serological screening
In order to test the samples for the presence of IgG antibodies directed against SARS-CoV-2 antigens, high-binding 1536-well plates (Perkin Elmer, SpectraPlate 1536 HB) were coated with 1 µg/mL S or RBD or NC in PBS at 37 °C for 1 h, followed by 3 washes with PBS-T (using Biotek El406) and by blocking with 5% milk in PBS-T (using Biotek MultifloFX peristaltic pumps) for 1.5 h. Three µL plasma, diluted in 57 µL sample buffer (1% milk in PBS-T), were dispensed at various volumes (from 1200 nL down to 2.5 nL) into pre-coated 1536-well plates using contactless dispensing with an ECHO 555 Acoustic Dispenser (Labcyte/Beckman Coulter). Sample buffer was filled up to 3 uL total well volume using a Fritz Gyger AG Certus Flex dispenser. Thereby, dilution curves ranging from plasma dilutions 1:50 to 1:6400 were generated (eight dilution points per patient plasma sample). After the sample incubation for 2 h at RT, the wells were washed five times with wash buffer and the presence of IgGs directed against above-defined SARS-CoV-2 antigens was detected using an HRP-linked anti-human IgG antibody (Peroxidase AffiniPure Goat Anti-Human IgG, Fcγ Fragment Specific, Jackson, 109-035-098, at 1:4000 dilution in sample buffer). The incubation of the secondary antibody for one hour at RT was followed by three washes with PBS-T, the addition of TMB, an incubation of three minutes at RT, and the addition of 0.5 M H2SO4 (both steps with Biotek MultifloFX syringe technology). The final well volume for each step was 3 µL. The plates were centrifuged after all dispensing steps, except for the addition of TMB. The absorbance at 450 nm was measured in a plate reader (Perkin Elmer, EnVision) and the inflection points of the sigmoidal binding curves were determined using the custom designed fitting algorithm described below.
Counter screening using commercial and custom-designed platforms
We used the following commercial tests for the detection of anti-SARS-SARS2 antibodies in 56 plasma samples of 27 patients who were diagnosed by RT-PCR to be infected by SARS-SARS2 as well as 83-90 plasma samples which were collected before December 2019 and, hence, before the start of the COVID-19 pandemics: The double-antigen sandwich electro-chemiluminescence immunoassay from Roche diagnostics (Rotkreuz, Switzerland) was performed with the E801 of the COBAS8000® system (Roche diagnostics, Rotkreuz, Switzerland). The test detects any antibody against the nucleocapsid antigen. The fully automated LIAISON® SARS-CoV-2 chemilu-minescence immunoassay from DiaSorin (Saluggia, Italy) detects IgG against the S1/S2 antigens. The SARS-CoV-2 chemiluminescent microparticle immunoassay from Abbott (Abbott Park, IL, USA) detects IgG against the nucleocapsid antigen and was performed on an Architect™ ana- lyser. Two ELISAs from EUROIMMUN (Lübeck, Germany) detect IgA or IgG against the S1 antigen and were performed by the use of a DSX™ Automated ELISA System (DYNEX Technologies (Chantilly, VA, USA). The high-throughput serology assay in Oxford (under development) was carried out in the Target Discovery Institute, University of Oxford. High-binding 384-well plates (Perkin Elmer, SpectraPlate) were coated with 20 µL of 2.5 µg/mL S o/n at 4°C, followed by 3 washes with PBS-T and by blocking with 5% milk in PBS-T for 2 h. Blocking buffer was removed and 20 µL of 1:25 sera diluted in sample buffer (1% milk in PBS-T) was dispensed into S-coated wells then incubated for 2 h at RT. The wells were washed five times with wash buffer and the presence of IgGs directed against S was detected using an HRP-linked anti-human IgG antibody (Peroxidase AffiniPure Goat Anti-Human IgG, Fcγ Fragment Specific, Jackson, 109-035-098) at 1:50,000 dilution in 20 µL sample buffer. The incubation of the secondary antibody for one hour at RT was followed by three washes with PBS-T and the addition of QuantaRed™ Enhanced Chemifluorescent HRP Substrate Kit (Thermo Scientific, Waltham Massachusetts, USA) then incubated for four minutes at RT before the addition of the stop solution. The fluorescence at excitation/emission maxima of ∼570/585nm was measured in a fluorescent plate reader (Perkin Elmer, EnVision).
Data analysis
Data fitting
Data fitting. Eight-dilution points equally spaced on a logarithmic scale are fitted with an equation derived from a simple binding equilibrium. The inflection point (-log10EC50) is extracted from the fit. Baseline and plateau values are fixed by the respective positive and negative controls in a plate-wise fashion and the signal is fitted following these equations:
 where cbound, ca and c are concentration of the antigen-antibody, antigen, and blood concentration respectively.

Data preprocessing
All samples that yielded an –log10EC50 of below –3 on any antigen were labelled as non-fittable and non-detectable. Their dilution curves cannot be differentiated from baseline and therefore only an upper bound for the –log10EC50 can be determined. These samples were therefore excluded from data fitting but were of course included in ROC analysis and prevalence estimation.
QDA, LDA, and Prevalence estimation
Assume that we have data for m samples with known serostatus and antibody measurements, that is, we have (Xi, Yi), i = 1,‥, m, where Xi is the vector of size p (in our case our antigen measurements) and Yi is a Boolean variable defining group membership (in our case, whether the individual is seropositive or not). The QDA model assumes multivariate normal distributed Xi given Yi:
Further, the model assumes that the prior, that is, distribution of Yi, is known s. t. P[Y = j] = πj The quadratic discriminant classifier simply assigns each sample to the group which has the larger posterior P[Y|X], which is proportional to the joint probability P[Y, X].
Therefore, we assign sample i to group 1 if

And to group 0 otherwise. To set the prior, one option is to take just the mean of the group sizes. However, this is not an ideal option in our case, where we have an additional n samples with unknown serostatus to classify: The prevalence in the m samples with known serostatus might deviate substantially from the prevalence in population with unknown serostatus. We therefore estimate π1directly from the data of unknown serostatus using a simple expectation maximization scheme. Proceeding in an iterative fashion, from a given estimate  , we define the posterior (E step):
Then, we update our estimate of π1 (M step):
After convergence, this yields our estimate of the positive serostatus prevalence in the samples. Note that the sample ordering according to this classifier is independent of the prior and therefore has no impact on an analysis via ROC curves. Further, note that evaluating QDA via ROC analysis, an out of sample scheme should be employed to avoid biased estimates of performance; we chose 10-fold cross-validation throughout. Lastly, note that the strategy does not critically depend on the normality assumption but just requires an estimate for the density functions, fx|y=j (xi). Even nonparametric estimates could be an option.
For the LDA approach, we first collapse the antigen measurements per samples according to the linear discriminant classifier:
Where Σ0 is the covariance estimated from the known negatives only and μ1, μ0 are the means of the known positives and negatives respectively. The above algorithm is then applied on the resulting one dimensional variablezi. 95% confidence intervals were derived by bootstrap drawing 1000 bootstrap samples, where the number of samples drawn from each annotation group (known positives, known negatives and unannotated) was kept constant.
High-throughput validation screen
For the validation screen, we picked 60 and 150 samples from BDS and USZ, respectively, that had the high average values when summing -logEC50 for both Spike and RBD. Additionally, we added 52 and 70 randomly selected prepandemic samples for the BDS and the USZ cohort respectively. We supplemented the three antigens used in the first screen (NC, S, RBD of SARS-SARS2) with a SARS-CoV RBD antigen. Unlike for the primary screen, we ran all samples in duplicates spread over two independent plates.
Protein production
The proteins were produced and purified at different sites in Zurich (CH), Oxford (UK), Lausanne (CH), and Yale University (USA).
Oxford, SGC
Recombinant proteins were purified as reported previously with small modifications [6, 22]. Mammalian expression vectors containing secreted, codon-optimized SARS-CoV-2 S (pHL-Sec [23]; aa. 1-1208, C-terminal 8His-Twin-Strep) and RBD (pOPINTTGNeo; aa. 330-532, C-terminal 6His) were transiently transfected with linear PEI into Expi239™ cells cultured in roller bottles in FreeStyle 293 media. Cell culture media was harvested after 3 days at 37°C for RBD or 3 days at 30°C for Spike and then buffered to 1X PBS. Proteins were first pulled down on Ni2+ IMAC Sepharose® 6 Fast Flow (GE) with stringent washing (>50 CV with 40 mM imidazole). RBD was polished on a Superdex 75 16/600 column (GE) equilibrated with 1X PBS, while Spike was directly dialyzed into 1X PBS using SnakeSkin™ 3,500 MWCO dialysis tubing. Proteins were concentrated with VivaSpin® centrifugal concentrators, centrifuged at 21,000 × g for 30 min to remove precipitates, and flash frozen at 1 mg/mL
Lausanne, EPFL SV PTECH PTPSP and Zurich UZH
The prefusion ectodomain of the SARS-CoV-2 S protein (the construct was a generous gift from Prof. Jason McLellan, University of Texas, Austin; see [22]) was transiently transfected either into suspension-adapted ExpiCHO cells (Thermo Fisher) or Expi293F (Thermo Fisher) cells with PEI MAX (Polysciences) in ProCHO5 medium (Lonza). After transfection, incubation with agitation was performed at 31°C and 4.5% CO2 for 5 days. The clarified supernatant was purified in two steps; via a Strep-Tactin XT column (IBA Lifesciences) followed by Superose 6 10/300 GL column (GE Healthcare) and finally dialyzed into PBS. The average yield was 15 mg/L culture.
Yale, New Haven
Human codon optimized SARS-CoV (2003) RBD (pEZT containing H7 leader sequence; aa. 306-527, C-terminal Avi- and 8His tags) was transiently transfected into Expi293™ cells (Thermo Fisher) using the ExpiFectamine™ 293 Transfection kit (Gibco) according to the manufacturer’s instructions. Cells were cultured in a 37°C incubator with 8% humidified CO2 for 4 days after transfection. Culture supernatant was collected by centrifugation (500 × g for 10 minutes) and RBD was captured using Ni-NTA Superflow resin (Qiagen), washed, and eluted in buffer containing 50 mM Tris-HCl pH 8, 350 mM NaCl, and 250 mM imidazole. RBD was further purified using an ENrich™ SEC 650 column (Bio-Rad) equilibrated in 1X PBS (Thermo Fisher). Peak fractions were pooled and the protein concentration was determined by 280 nm absorbance with a Nanodrop™ One Spectrophotometer (Thermo Fisher). Protein was snap frozen in liquid nitrogen and shipped on dry ice prior to experiments.
Zurich, ETH
NSP1 carrying an N-terminal His6-tag followed by a TEV cleavage site was expressed from a pET24a vector. The plasmid was transformed into E. coli BL21-CodonPlus (DE3)-RIPL and cells were grown in 2xYT medium at 30 °C. At an OD600 of 0.8, cultures were shifted to 18 °C and induced with IPTG to a final concentration of 0.5 mM. After 16 h, cells were harvested by centrifugation, resuspended in lysis buffer (50 mM HEPES-KOH pH 7.6, 500 mM KCl, 5 mM MgCl2, 40 mM imidazole, 10% (w/v) glycerol, 0.5 mM TCEP and protease inhibitors) and lysed using a cell disrupter (Constant Systems Ltd). The lysate was cleared by centrifugation for 45 min at 48.000 xg and loaded onto a HisTrap FF 5-ml column (GE Healthcare). Eluted proteins were incubated with TEV protease at 4 °C overnight and the His6-tag, uncleaved NSP1 and the His6-tagged TEV protease were removed on the HisTrap FF 5-ml column. The sample was further purified via size-exclusion chromatography on a HiLoad 16/60 Superdex75 (GE Healthcare), buffer exchanging the sample to the storage buffer (40 mM HEPES-KOH pH 7.6, 200 mM KCl, 40 mM MgCl2, 10% (w/v) glycerol, 1 mM TCEP). Fractions containing NSP1 were pooled, con-centrated in an Amicon Ultra-15 centrifugal filter (10-kDa MW cut-off), flash-frozen in liquid nitrogen, and stored until further use at -80 °C.
Details of viral proteins used for this study
For high-throughput serology, the following proteins were used: SARS-CoV-2 S (pHL-Sec; aa. 1-1208, C-terminal 8His-Twin-Strep) and RBD (pOPINTTGNeo; aa. 330-532, C-terminal 6His) produced at the SGC in Oxford and the nucleocapsid protein from AcroBiosystems (AA Met 1 - Ala 419, C-terminal his-tag, NUN-C5227). For competitive ELISA, we used: The prefusion ectodomain of the SARS-CoV-2 S protein (Lausanne, EPFL SV PTECH PTPSP), the RBD from Trenzyme (C-terminal his-tag, P2020-001) and the nucleocapsid protein from AcroBiosystems (AA Met 1 - Ala 419, C-terminal his-tag, NUN-C5227). For additional ELISAs following the high-throughput serology, we used: The prefusion ectodomain of the SARS-CoV-2 S protein (Lausanne, EPFL SV PTECH PTPSP), the RBD from Trenzyme (C-terminal his-tag, P2020-001) and, nucleocapsid protein from AcroBiosystems (AA Met 1 - Ala 419, C-terminal his-tag, NUN-C5227), the SARS2 NSP1 protein (from Nenad Ban, ETH Zurich), the CMV pp65 protein (Abcam, ab43041), and BSA (Thermo Scientific).
Western Blotting
Expi293F cells were obtained as a gift from Prof. Maurizio Scaltriti (Memorial Sloan Kettering Cancer Center, New York). Non transfected control cells and cells overexpressing either His-tagged S, His-tagged NC or His-tagged RBD domain were lysed in 0,1% Triton X-100/PBS. Total protein content in the cellular fraction was quantified using bicinchoninic protein assay (Pierce BCA Protein Assay Kit, ThermoFisher). For Western Blotting, 30 µg of ECD-expressing lysate, 10 µg of NC-expressing lysate and 10 µg of RBD-expressing lysate were loaded all in the same well of NU-PAGE 4-12% Bis-Tris gels (ThermoFisher). 50 µg of non-transfected cell lysate were loaded as negative control. Gels were run at a constant voltage (150 V) in MES running buffer for 50 minutes, then transferred onto PVDF membrane with a dry transfer system (iBlot 2 Gel Transfer Device, ThermoFisher). The membranes were blocked with 5% SureBlock (Lubio Science) for 1 hour at room temperature, and then incubated overnight with a 1:100 dilution of patients’ plasma in 1% SureBlock, at 4 degrees. The day after, membranes were washed four times with PBS-T and incubated for 1 hours with an anti-human secondary antibody, HRP-conjugated, diluted 1:10000 in 1% SureBlock. The membranes were then washed four times with PBS-T and acquired using Immobilon Crescendo HRP Substrate (Merck Millipore) and Fusion SOLO S imaging system (Vilber). As a positive control, one membrane was incubated overnight with mouse anti-Histag antibody (ThermoFisher, dilution 1:10000 in 1% SureBlock) and subsequently with anti-mouse secondary antibody, HRP-conjugated (Jackson, dilution 1:10000 in 1% SureBlock).
Competitive ELISA
To perform competitive ELISAs, high-binding 384-well plates (Perkin Elmer, SpectraPlate 384 HB) were coated with 1 ug/mL S or RBD or NC in PBS at 37°C for 1 h, followed by 3 washes with PBS-T and by blocking with 5% milk in PBS-T for 1.5 h. Meanwhile, plasma samples were diluted to a final concentration close to the EC50, incubated with either RBD (50 ug/mL) or S (12.5 ug/mL) and serially diluted (11 dilution points per patient sample, 25 uL per dilution) in a low-binding 384-well plates (Perkin Elmer, high binding SpectraPlate). After 2 h of incubation at RT, 20 uL of all the samples were transferred to the previously coated plates and incubated for additional 2 h at RT. Then, the plates were washed five times with PBS-T and the presence of IgGs was detected using an HRP-linked anti-human IgG antibody (Peroxidase AffiniPure Goat Anti-Human IgG, Fcγ Fragment Specific, Jackson, 109-035-098, at 1:4000 dilution in sample buffer). The incubation of the secondary antibody for one hour at RT was followed by three washes with PBS-T, the addition of TMB, an incubation of 5 minutes at RT, and the addition of 0.5 M H2SO4. The absorbance at 450 nm was measured in a plate reader (Perkin Elmer, EnVision) and the inflection points of the sigmoidal binding curves were determined using a custom designed fitting algorithm.
Microscale diffusional sizing
For the microfluidic binding measurements, 40% of human plasma was added to 10 nM antigen and PBS was added to give a constant volume of 20 µL. The antigen used was RBD labelled with Alexa Fluor 647 through N-terminal amine coupling. These samples were incubated at room temperature for 40 minutes and the size, hence molecular weight of the formed immunocomplex, was determined through measuring the hydrodynamic radius, Rh with microfluidic diffusional sizing [24] using a Fluidity One W platform (Fluidic Analytics, Cambridge, UK). Following correction of fluorescence intensities for serum autofluorescence, the fraction, fd, of RBD to diffuse into the distal channel is defined by:
Where [AbR] is the concentration of bound RBD, [R]0 is the total concentration of RBD, and ρb and ρf are the fractions of bound and free RBD to diffuse into the distal channel, respectively.
Data Availability
The raw data underlying this study will be made available upon reasonable request. The biobank samples are limited and were exhausted in several instances. Therefore, while we will make ef-forts to provide microliter amounts of samples to other researchers, their availability is physically limited.
Funding
Institutional core funding by the University of Zurich and the University Hospital of Zurich to AA, as well as Driver Grant 2017DRI17 of the Swiss Personalized Health Initiative to AA. The robotic rig was acquired with a R’Equip grant of the Swiss National Foundation to AA. Screening meth-odologies had been developed thank to the support of an Advanced Grant of the European Research Council and a Distinguished Scientist Award of the Nomis Foundation to AA. Funding by grants of Innovation Fund of the University Hospital Zurich to AA, AvE, DS, EPM, ME, and OB. Access to the Creoptix WAVE system was kindly provided by Creoptix AG. Wädenswil, CH. Utilization of the Fluidity One-W was kindly granted by Fluidic Analytics, Cambridge, UK. This work was supported by ETH Research Grant ETH-23 18-2 and a Ph.D. fellowship by Boehringer Ingelheim Fonds to KS. Raphaël Jacquat acknowledges funding by the EPSRC for Doctoral Training in Sensor Technologies and Applications (grant EP/L015889/1). ICM acknowledges funding by the Swiss Government FCS. Carlo Cervia was funded by a Swiss Academy of Medical Sciences fellowship (#323530-191220). GFXS was supported by an COVID-19 Emergency Fund of the Director of PSI. TM is supported by Cancer Research UK grants C20724/A14414 and C20724/A26752 to Christian Siebold (Oxford). Oxford work was supported by the MRC and Chinese Academy of Medical Sciences Innovation Fund for Medical Science, China Grant 2018-I2M-2-002. GRS is supported as a Wellcome Trust Senior Investigator (grant 095541/A/11/Z) and receives funding from the National Institute for Health Research Biomedical Research Centre Funding Scheme.
Author contributions
Collected and processed the biological specimens, prepared and carried out the high-throughput screenings, maintained the machines: ME, DS, BD, JG, AW, MI, JD, CZ. Analyzed data from the high-throughput serology: DL, RJ, IX, ME, AA. Carried out follow-up ELISAs and competitive ELISAs: EDC, RM, ME. Carried out Western Blots: EDC, CT, AGG. Carried out and interpreted experiments in solution using microfluidics diffusional sizing technology: MMS, ICM, CKX, GM, TJPK, VK, ME, AA. Collected samples from COVID-19 patients for the establishment of serology: ILD, DJS. Coordinated the sample acquisition and processing from the Institute of Clinical Chemistry: AvE and LS. Coordinated the sample acquisition and processing from the blood donation services: BF and JG. Coordinated and performed high-throughput ELISAs for comparison in Oxford: DE, StH, DIS. Coordinated and performed SARS2 serological assays using commercial platforms: LS, KS, AvE, EPM, OB. Produced proteins: DIS, NBB, RO, TM, FP, DH, KL, EDC, JDH, FL, AMR, SH, GS. Coordinated the correspondence with the ethics committee of the Kanton of Zurich: RR, JN, ME. Produced and redacted the figures: AA, RJ, DL, EDC, ME. Conceived the idea of creating a biobank of plasma samples, supervised the study on a daily basis, proposed primary and confirmatory experiments, advised on best lab practices, on control experiments and on data interpretation: AA. Wrote abstract, introduction and discussion: AA. Wrote a first draft of the Results part of the manuscript: ME. Advised on and corrected the Results section: AA.
Competing interests
TPJK is a member of the board of directors of Fluidic Analytics. AA is a member of the board of directors of Mabylon AG which has funded antibody-related work in the Aguzzi lab in the past. All other authors declare no competing interests.
Data and materials availability
The raw data underlying this study will be made available upon reasonable request. The biobank samples are limited and were exhausted in several instances. Therefore, while we will make efforts to provide microliter amounts of samples to other researchers, their availability is physically limited.
Supplementary Materials
Fig. S1. Detailed assay procedure. A. Sample acquisition. B. Experimental workflow using high-throughput screening platform.
Fig. S2. Prevalence estimation in two large cohorts. A. and B. Half-violin plots showing the distribution of anti-S/RBD/NC reactivity in the –log(EC50) scale for the USZ (A) and the BDS (B) cohort. Color bar: posterior probability C. and D. Depicted are all the –log(EC50) values calculated for S and the RBD for the USZ (C) and the BDS (D) cohort. Posterior probability were calculated using LDA. E. and. F. Q-Q plots to check the Gaussian distributional assumption of the LDA model. For USZ (E) and the BDS (F) cohort respectively, we collapsed the 3 measures per sample according to the linear discriminant classifier. We then scaled known positives and negatives to mean zero and unit variance and compared their distributions to the univariate Gaussian distribution via Q-Q plot. We saw that for the relevant upper tail, the distribution of known negatives followed the normal distribution with only a mild deviation, such that, for instance, the upper one percent quantile is reached at 2.04 (E) and 2.00 (F) rather than at their theoretical value of 2.32. G. and. H. ROC curves for the USZ (G) and BDS (H) cohorts using the prepandemic samples (including the ones from December 2019 and January 2020 for BDS) as condition negatives and selected condition positives from both cohorts. I. Using the posterior probabilities from the LDA, the prevalence of SARS2 seropositivity was calculated in prepandemic samples and then from December 2019 to June 2020.
Fig. S3. Assay reproducibility using 210 high scoring samples and 122 random samples (based on results from the high-throughput screen) for binding against S, the RBD, and the NC. A. S binding shows that reproducibility increases at higher values, consistent with increased posterior probabilities. B. Same observation as (A) for the RBD. C. Same observation as (A) for the NC.
Fig. S4. Characterization of prepandemic and copandemic samples. A. Western Blot analysis. For a better visualization, brightness and contrast have been modified and the images have been partially cropped. Original images are shown in Fig. S6. B. Additional ELISA. C. Competitive ELISA.
Fig. S5. Competitive ELISA probing for NC signal for asymptomatic and convalescent individuals.
Fig. S6. Uncropped and unmodified camera-acquired images of the Western Blots displayed in Figs. 4 and 5 and Fig. S4.
Table S1. Descriptive statistics of age and sex for all cohorts. Data shown here show basic annotations for the USZ as well as for the BDS cohort. Samples from the BDS cohort were fully anonymized until March. Demographic and clinical annotations are only available since April 2020 for bioethical reasons.
Acknowledgments
All authors wish to thank their entire teams for support in the lab. Linda Irpinio, André Wethmar, and Andra Chincisan are acknowledged for help in the lab and with data processing. Vishalini Emmenegger (ETH Zurich) offered insightful advice and kind help with illustrations. We are grateful to Elisabeth J. Rushing (USZ) for proofreading the manuscript, to Guido Bucklar, Michael Fetzer, Patrick Hirschi, Katie Kalt, Karin Edler and Roland Naef (USZ) for their help with hospital data, and to Didier Trono for helpful insights and discussions. Michael Weisskopf, Regina Grossmann and the team of the Clinical Trials Center (CTC) of the USZ are acknowledged for their help with sample acquisition and protocols. Above all, we are grateful to all blood donors and hospital patients for helping us conduct this study.


