
Abstract
Purpose To determine sources of variation between countries in per-capita mortality from COVID-19 (caused by the SARS-CoV-2 virus).
Methods Potential predictors of per-capita coronavirus-related mortality in 200 countries by May 9, 2020 were examined, including age, sex, obesity prevalence, temperature, urbanization, smoking, duration of infection, lockdowns, viral testing, contact tracing policies, and public mask-wearing norms and policies. Multivariable linear regression analysis was performed.
Results In univariate analyses, the prevalence of smoking, per-capita gross domestic product, urbanization, and colder average country temperature were positively associated with coronavirus-related mortality. In a multivariable analysis of 196 countries, the duration of infection in the country, and the proportion of the population 60 years of age or older were positively associated with per-capita mortality, while duration of mask-wearing by the public was negatively associated with mortality (all p<0.001). International travel restrictions and a lower prevalence of obesity were independently associated with mortality in a model which controlled for testing policy. Internal lockdown requirements and viral testing policies and levels were not associated with mortality. The association of contact tracing policy with mortality approached statistical significance (p=0.06). In countries with cultural norms or government policies supporting public mask-wearing, per-capita coronavirus mortality increased on average by just 15.8% each week, as compared with 62.1% each week in remaining countries.
Conclusions Societal norms and government policies supporting the wearing of masks by the public, as well as international travel controls, are independently associated with lower per-capita mortality from COVID-19.
Introduction
The COVID-19 global pandemic caused by infection with severe acute respiratory syndrome coronavirus 2 (SARS-CoV-2) has presented a major public health challenge. For reasons that are not completely understood, the per-capita mortality from COVID-19 varies by several orders of magnitude between countries.1 Numerous sources of heterogeneity have been hypothesized. Higher mortality has been observed in older populations and in men.2,3 Patient-level behaviors, such as smoking, might also have an impact.3 Other potentially relevant factors include economic activity, and environmental variation, such as temperature.4 More urban settings and increased population density would be expected to enhance viral transmission.5
In addition, public health responses to the COVID-19 pandemic may influence per-capita mortality. Various strategies have been implemented, ranging from robust testing programs to lockdown or stay-at-home orders, to mandates regarding social distancing and face mask usage. Practices with theoretical benefit, such as social distancing, stay-at-home orders, and implementation of mandates regarding use of masks in public spaces, must be assessed quickly, as implementation has the potential to reduce morbidity and mortality.
Mask usage by the public is postulated to decrease infection by blocking the spread of respiratory droplets,1 and was successfully implemented during other coronavirus outbreaks (i.e. SARS and MERS).6 In the context of the ongoing pandemic, we assessed the impact of masks on per-capita COVID-19-related mortality, controlling for the aforementioned factors. We hypothesized that in countries where mask use was either an accepted cultural norm or favored by government policies on a national level, the per-capita mortality might be reduced, as compared with countries which did not advocate masks.
Methods
Data acquisition
In order to be included in the study, countries had to: 1) have coronavirus mortality data listed in the publicly available Worldometer Database on May 9, 2020;7 2) have dates of first case and first death reported by the European Centre for Disease Prevention and Control (which did tabulate worldwide data);8 and 3) have an assessment of viral testing through May 9, 2020 by either: 3a) report on Worldometer of numbers of coronavirus PCR tests performed,7 or: 3b) testing and lockdown policies graded by the University of Oxford Coronavirus Government Response Tracker.9,10
Oxford University defined and scored several composite government response indices. The stringency index was defined in terms of containment policy and public information.9 The government response index incorporated containment, economic measures, public information, and testing and tracing policies.9 The containment and health index was defined in terms of containment measures, public information, and testing and tracing policies.9
Archived viral testing data for April 2020 were also downloaded.11 Mean temperature in each country during the pandemic was estimated using the average monthly temperature in the country’s largest city from public sources.12,13
Online news reports and government statements, including those cited by a previous review14 and a public database,15 were searched to identify countries in which the public wore masks early in the outbreak based on tradition, as well as countries in which the national government mandated or recommended mask-wearing by the public before April 16, 2020.
For each country, the population,16 fraction of the population age 60 years and over, and age 14 and under, male: female ratio per country,17 surface area,16,17 gross domestic product per capita,18 percent urbanization,16,19 adult smoking prevalence20-23 and prevalence of adult obesity24-43 were tabulated. Whether a nation was an isolated political entity on an island was also recorded.
Statistical analysis
The prevalence of an infectious process undergoing exponential growth (or decay) appears linear over time when graphed on a logarithmic scale.1 Therefore, we postulated that the logarithm of the country-wide infection prevalence would be linearly related with the duration of the infection in each country. In addition, our analysis postulated that deaths from coronavirus would follow infections with some delay.
On average, the time from infection with the coronavirus to onset of symptoms is 5.1 days,44 and the time from symptom onset to death is on average 17.8 days.45 Therefore, the time from infection to death is expected to be 23 days.1,46 These incubation and mortality times were prespecified.1,46 Therefore, the date of each country’s initial infection was estimated as the earlier of: 5 days before the first reported infection, or 23 days before the first death.8,11,47 Deaths by May 9, 2020 would typically reflect infections beginning 23 days previously (by April 16). Therefore, we recorded the time from the first infection in a country until April 16. We also recorded the period of the outbreak: 1) from when public mask-wearing was recommended until April 16, 2) from the mandating of international travel restrictions or quarantine until April 16, and 3) from the start of mandated limits on internal activities (e.g. closures of schools or workplaces, limits on public gatherings or internal movement, or stay-at-home orders) until April 16. For countries scored by Oxford University, the Oxford data were used to determine the start of international travel restrictions and lockdowns on internal activity. In addition, we calculated the mean time-weighted score for each lockdown and testing policy as graded by the University of Oxford for the duration of the country’s outbreak, from beginning through April 16.9 For instance, if the school closure score was 1 for half the outbreak and 2 for the other half, then the mean score was 1.5.
Per-capita mortality can be analyzed as a binary outcome (low or high), or as a continuous variable. Each approach has strengths and weaknesses. Analysis of a binary outcome is not unduly influenced by outliers. Countries with extremely low or high mortality are included in the appropriate group, but the exact mortality value does not change the results. Moreover, analysis of a binary outcome facilities clear communication, because one can describe the characteristics of low and high mortality countries.
On the other hand, per-capita mortality is in fact a continuous variable, and the separation of countries just below or just above a threshold value is somewhat arbitrary, or susceptible to chance variation. Analysis of mortality as a continuous variable uses all the information available, and can appropriately model the exponential growth of an infection. We view the binary and continuous analyses as complementary. When one sees that a univariate association is found with both types of analysis, one gains confidence that the association is not an artifact of the analytic method selected.
In univariate analysis, characteristics of countries with above-median per-capita mortality were compared with the remaining (lower mortality) countries by the two-sample t-test using groups.
Significant predictors of per-capita coronavirus mortality in the univariate analysis were analyzed by stepwise backwards multivariable linear regression analysis. The dependent variable was the logarithm (base 10) of per-capita coronavirus-related mortality. Because of the importance relative to public health, the weeks the country spent in lockdown, with international travel restrictions, and using masks, and per-capita testing levels, were retained in the model. In addition, because of their biological plausibility and presumed importance, urbanization, prevalence of obesity, and average ambient temperature were retained in most of the multivariable models presented below. Statistical analysis was performed with xlstat 2020.1 (Addinsoft, New York). An alpha (p value) of 0.05 was deemed to be statistically significant. The study was approved by the Virginia Commonwealth University Office of Research Subjects Protection.
Results
We studied coronavirus mortality in 200 countries, of which 183 had testing data,7 169 had government policies scored by Oxford University,9 and 152 fell into both categories.
The 100 lower-mortality countries had 0.99 deaths per million population, in contrast with an average of 93.3 deaths per million population in the 100 higher-mortality countries (p<0.001, Table 1, Appendix Table A1). The median value was 4.0 deaths per million population.
Characteristics of countries with low and high per-capita coronavirus mortality by May 9, 2020 in 200 countries.
We assumed that island nations might find it less challenging to isolate and protect their populations. However, 19 of 100 low-mortality countries were isolated on islands, compared with 28 of 100 high-mortality countries (p=0.18). Country surface area and population were not associated with coronavirus mortality (Table 1).
Population characteristics
Countries with older populations suffered higher coronavirus mortality. Countries with low mortality had on average 8.8% of their population over age 60, as compared with 18.2% in the high-mortality countries (p<0.001, Table 1). The proportion of the population which was male was not associated with country-wide mortality (p=0.95, Table 1). Smoking prevalence was on average 13.7% in low mortality countries and 18.4% in high-mortality countries (p<0.001, Table 1). The prevalence of obesity was on average 14.6% in low-mortality countries and 24.0% in high-mortality countries (p<0.001, Table 1).
Temperature
Colder countries were associated with higher coronavirus mortality in univariate analysis. The mean temperature was 22.2 C (SD 7.6 C) in the low-mortality countries, and 14.1 C (SD 9.1 C) in the high-mortality countries (p<0.001, Table 1).
Economics
Urbanization was associated with coronavirus mortality in univariate analysis. In low-mortality countries, on average 52% of the population was urban, as compared with 70% of the population in the high-mortality countries (p<0.001, Table 1). Richer countries suffered a higher coronavirus related mortality. The mean GDP per capita was $9,060 in the low-mortality countries, and was $27,140 in the high-mortality countries (Table 1, p<0.001).
Masks: Early Adoption
The World Health Organization initially advised against widespread mask wearing by the public, as did the United States CDC.1,48 The WHO reversed course and recommended masks in public on June 5, 2020.49
Despite these initial recommendations, a number of countries did favor mask wear by the public early in their outbreak, and such countries experienced low coronavirus-related mortality (Table 2, Table A1, Figure 1).50-68,S1-S301 It is likely that in Mongolia and Laos, both of which reported no coronavirus-related mortality by May 9, the public began wearing masks before any cases were confirmed in their countries (Table 2). We identified 22 additional countries with recommendations or cultural norms favoring mask-wearing by the public within 20 days of the estimated onset of the country’s outbreak:1 including (beginning with those favoring masks earliest in the course of their outbreak): Japan, the Philippines, Macau, Hong Kong, Sierra Leone, Cambodia, Timor-Leste, Vietnam, Malaysia, Bhutan, Venezuela, Taiwan, Slovakia, St. Kitts and Nevis, South Korea, Indonesia, Brunei, Grenada, Mozambique, Uzbekistan, Thailand, and Malawi (Table 2). The average mortality by May 9 for these 24 early mask-wearing countries was 1.5 per million (SD 2.0). Twenty of the 24 were lower-mortality countries (p=0.001).
Countries in which masks were widely used by the public or recommended by the government within 31 days of the estimated local onset of the outbreak, by timeliness of mask-wearing.
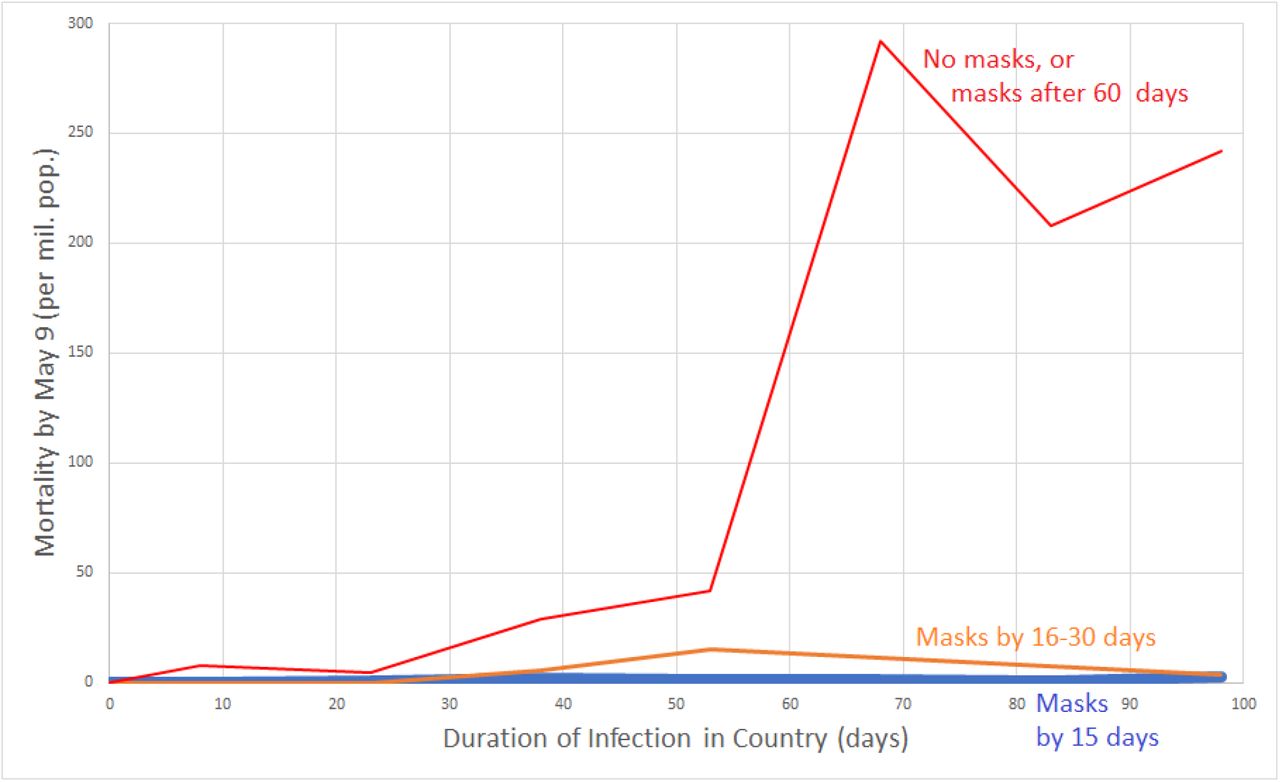
Per-capita mortality by May 9 versus duration of infection according to whether early masking was adopted. Data grouped by whether country did not recommend masks by April 16, 2020 or recommended them more than 60 days after outbreak onset (red line); recommended masks 16 to 30 days after onset of the country’s outbreak (orange line); or recommended masks (or traditionally used masks) within 15 days of the outbreak onset (blue line close to the x-axis). Country mortality was averaged for the following country groups of infection duration: 0-15 days, 16-30 days, 31-45 days, 46-60 days, 61-75 days, 76-90 days, 91-105 days. For instance, per-capita mortality for all non-mask or late-masking countries with infection duration between 61 and 75 days was averaged, and graphed at the x-value 68 days. Data for graph derived from 200 countries.
An additional 17 countries recommended that the public wear masks within 30 days of the estimated onset of their outbreak: São Tomé and Príncipe, Czechia, Dominica, Bangladesh, Zambia, Chad, Benin, Sudan, El Salvador, Antigua and Barbuda, Myanmar, Bosnia and Herzegovina, Côte d’Ivoire, South Sudan, Kenya, Saint Lucia, and Barbados (Table 2). The average mortality by May 9 for this group was 8.5 per million (SD 12.4).
Masks in Asia
Throughout much of East, South, and Southeast Asia, masks were worn by the public as a preventive measure, rather than a policy implemented after evidence emerged of health system overload (Table 2). The public sometimes implemented masks before government recommendations were issued.
As the country where the pandemic started, China is a noteworthy case of a nation which traditionally has favored mask-wearing by the public for respiratory illnesses, but which did not deploy masks immediately. The first cases in China had begun by December 1, 2019.69 By the time human-to-human transmission was confirmed on Jan. 20, 2020, many in Beijing were already wearing masks.S58 The government required masks in public in Wuhan on Jan. 22.S59 From Jan. 23-25, thirty regions in China mandated masks in public.58,70 Masks were ordered throughout China when around others in public on Jan. 31.S60 China suffered a very significant outbreak in Wuhan, but appears not to have experienced the same level of infection in other regions. Surveys indicate that the prevalence of public mask wear in China remained between 82% and 90% between February 24 and June 22.53 Another survey confirmed mask wear from 80-90% from March 12 to April 14.52 The reported country-wide per-capita mortality by May 9, 2020 was 3.2 per million population.
For several countries in South or Southeast Asia with mortality lower than in the West, we did not score the country as mask-wearing in the primary analysis until their governments issued recommendations to do so. Nonetheless, there is evidence of significant mask wear by the public before the recommendations in Nepal, India, and Sri Lanka.
In Nepal, facemasks are commonly seen in urban centers due to air pollution.71 The first case of COVID-19 in the country was reported on January 13, in a traveler returning from Wuhan.72 However, no subsequent cases were reported in Nepal until the second week of March.72 By January 29, all students at some schools were wearing masks.S198 By February 3, pharmacies were selling out of masks due to increased demand.S199 With the outbreak, tailors began sewing cloth masks.71 By February 8, 2020, “a majority” of the public was wearing masks.S200 The recommendation to wear masks in public became more formalized on March 25.S201 The Ministry of Health distributed masks to children and elderly in shelters by March 25.S202 Surveys in Nepal found that 83% of respondents agreed that asymptomatic people should wear masks to prevent COVID-19 infection at the end of March,72 and 96% agreed with this statement from May 15 to June 20.73 As of May 9, Nepal reported no coronavirus-related mortality. We used the March 25 recommendation as the date in the mask analysis, but earlier mask use might have forestalled the epidemic in Nepal.
In India, the first case of coronavirus was diagnosed on January 30.S124 The Health Ministry recommended homemade face masks on April 4, 2020.S125 However, mask wear was high both before and after the recommendation. According to one poll, masks were worn by 60% of the public from March 12-14, 67% from March 19-21, and then from 73% to 76% between March 26 through April 12.52 According to another poll, masks were worn by 43% of the public on March 16, 46% on March 20, 65% on March 27, 71% on April 3, 79% on April 10, and 81-84% between April 17 and May 1.53 A survey conducted in March 2020 found that 75% of the public believed that masks should be worn even by asymptomatic people, and 77% of respondents indicated that the N95 mask was most protective.74 By May 9, the per-capita mortality was 1.5 per million.
In Sri Lanka, the public immediately bought masks at the end of January when the first cases were identified.S257 Masks were mandated in public on April 11.S258 The per-capita mortality by May 9 was 0.4 per million.
Singapore was slower than its Asian neighbors to embrace masks, but when the government shifted course, the public was ready to respond. On March 27, only 27% of respondents indicated that they wore a mask.53 On April 3, when the government announced that it would no longer discourage mask-wearing by the public, and would instead distribute masks,S239-S241 37% indicated that they wore a mask.53 Mask wearing by the public reached 73% on April 10, 85% on April 17, and 90% on April 24, where it remained through June 19. 53
Early in the pandemic, masks were noted to be “somewhat common” in Afghanistan.75 By March 29, 2020, the Taliban had begun distributing masks to the public in areas under their control.S1
In March 2020, 78% of Pakistanis in Sargodha were in favor of wearing a mask to prevent coronavirus.76 Another survey conducted from April 1-12 indicated that 80% of Pakistanis believed the government should mandate mask wearing for adults outside the home.77 Masks were mandated when in crowded spaces in Pakistan on May 31.S209
Masks in the Middle East
In parts of the Middle East, masks were embraced by the public even before government requirements. In the United Arab Emirates, the first cases were reported on January 29.S280 By February 29, mask usage had become “more prominent”, but the Ministry of Health and Community Protection advised that N95 masks should be reserved for medical personnel treating coronavirus patients, and could cause “respiratory illness” if worn by the public.S281 Despite this warning, a poll of UAE residents found that masks were worn by 39% of the public on March 18, and 44% on March 25.53 On March 27, the government followed the people’s lead, and mandated masks when indoors.S282 Subsequently, masks were worn by 63% on April 1 and between 78% and 81% between April 14 and June 17.53 By May 9, the per-capita mortality was 18.7 per million.
In Saudi Arabia, the first case was announced on March 2.S231 A poll of Saudi residents found that 35% wore a mask on March 18, 54% on April 1, and 59% on April 14,53 despite the lack of any official guidance to do so. A different survey conducted from April 2-5, during a period of lockdown, found that 16.9% had worn a mask even without symptoms.78 Public mask-wearing was recommended by the Saudi government on April 28,S232 and mandated on May 30.S233 Mask-wearing reached 63% on May 4, and 72% on June 3.53 A survey of Saudi nursing students which concluded on June 30 found that 87% had worn a mask when going out in recent days.79 By May 9, the per-capita mortality was 6.9 per million.
In Lebanon, the first case was reported on February 21.S159 Masks were popular among the public from mid-March to early April.S160,S161 Masks were recommended by the health minister on April 25.S161 By May 9, the per-capita mortality was 3.8 per million.
In March 2020 in Egypt, 76.4% of adults expressed an understanding of the value of wearing a mask in public, but only 36.4% agreed that they actually did so.80 At this time, the government was not mandating masks, but by March 20, prices of masks had soared, and volunteer organizations were advocating public masking in Egypt.S87 Masks were mandated in public in Egypt on May 31.S88
In Iran, no infections were announced until February 19, when two deaths were reported.S130 By March 12, satellite imagery demonstrated the digging of mass graves in Qom.S131 In accord with WHO guidelines, the guidance of the Iranian Health Ministry available on March 24, 2020 advised that the public wear a mask only if symptomatic or caring for the sick (personal communication, Linnea I. Laestadius, June 7, 2020).14 However, a new guidance which recommended universal masking in gyms, parks, and public transit was issued by the Ministry by March 29,14 an estimated 62 days after the start of the outbreak (assuming the reported deaths were really the first). A survey conducted from February 25 to April 25 found that 64% of the public reported wearing a mask and gloves in crowded places.81 By May 9, the reported per-capita mortality in Iran was 78.4 per million, though many, even those within the Iranian government, have questioned the official figures.82,83,S132
In Jordan, a study conducted from March 19-21, 2020 found that 39.8% of university students wore a face mask when leaving home.84 King Abdullah recommended that the public wear masks when shopping on April 27.S147
In Yemen, 90% of women wear the niqab, which local doctors believe might reduce transmission of the virus by functioning as a mask.85 By May 9, the per-capita mortality in Yemen was 0.2 per million.
In Syria, a survey of university students conducted from March 19-21, 2020 found that 52% of respondents indicated that everyone should wear a mask when outside, but that 25% indicated that they did so at least sometimes, and 75% never wore a mask on the street.86
Government mandates or recommendations for mask wearing by the public were issued in Kuwait for gatherings by March 23,14 in Israel on April 1,S135 and in Bahrain on April 9.S17
Masks in Africa
As noted above, 11 African countries recommended or mandated masks within 31 days of the onset of their outbreak: Sierra Leone, Mozambique, Malawi, São Tomé and Príncipe, Zambia, Chad, Benin, Sudan, Côte d’Ivoire, South Sudan, and Kenya (Table 2). In addition, the public widely sought masks to wear early in the outbreak in Gambia.S100,S101
In Ethiopia, 75.7% of chronic disease patients surveyed from March 2-April 10, 2020 agreed that it was important to wear a mask outside the home to prevent infection with coronavirus.87 A survey from March 20-24 found that 87% of the public believed wearing a mask could prevent spread of the virus, but only 14% had done so in the few days before the survey.88 Another survey from April 1-15 in southern Ethiopia found that 84% believed that wearing a mask was protective, 160 respondents (36%) had been to a crowded place in recent days, and 129 respondents (29%) had worn a mask when leaving home in recent days.89 Masks were mandated in public on April 11.S95 In a survey in that country from April 15-22, 84% believed a mask could provide protection from coronavirus, 137 people (40%) had gone to a crowded place after the onset of the pandemic, and 82 people (24%) had worn a mask outside the home.90 By May 9, Ethiopia had reported no deaths from coronavirus.
In Cameroon, the first cases of coronavirus were identified on March 6.91 From March 10-18, a study found that 93.5% of the public viewed the wearing of face masks as protective, and 21.7% had already purchased them.91 A study in Northern Cameroon conducted from March 1-28 found that only 13% wore a mask outside the home.92 A survey in Cameroon conducted from April 1 to 25 found that 83.6% reported wearing a mask at gatherings.93 On April 9, it was announced that masks would be mandatory in public beginning April 13.66,S47,S48 By May 9, the per-capita mortality was 4.1 per million.
In a city in the Democratic Republic of the Congo not yet affected by the pandemic at the time of a survey conducted from April 17 to May 11, 61% of respondents were aware of the value of wearing a face mask, 27% reported wearing a face mask since the pandemic began, and 65% felt that wearing a face mask was difficult.94
In Ghana, a study from March 27-29 of 43 public transport stations found that masks were worn by many people at one station, worn by a few people at 27 stations, and not worn at the remainder.95 On April 19, 2020, the president of Ghana announced that masks would be required in public.S107,S108
Masks were required in public in Nigeria on April 14.96,S206 A study in Nigeria from May 7 to 18 found that 65% of respondents had worn a mask outside the home in recent days.97
In South Africa from April 8-24, 2020, 85.6% of the public agreed that wearing a mask could help to prevent coronavirus infection.S246 South African health officials recommended mask wear in public on April 10.S247
In addition, government mandates or recommendations for mask wearing by the public were issued by April 16 in: Mauritius on March 31;S178 TunisiaS274 and MoroccoS187 on April 6; Guinea on April 13;S114 Gabon on April 15;63,66 Equatorial Guinea on April 14;S93 and Libya on April 16.S164
Masks in Europe
Most countries in Europe and North America failed to embrace masks early in their outbreaks, and only adopted mask policies after signs of health system overload became apparent. Only 3 countries in Europe appear to have had government recommendations for the public to wear masks within 31 days of the onset of their outbreak: Slovakia, Czechia, and Bosnia and Herzegovina (Table 2).
The first country in Europe to be strongly affected by the outbreak was Italy, which reported its first cases on January 31, among a family who arrived from China on January 23.S136 By March 10, doctors in Lombardy indicated that all intensive care beds were taken, and the system did not have enough respirators for the affected.208X A poll found that only 26% of Italians wore a mask in public on March 11, but, with the rising health system overload, 59% did so on March 1953—at least 53 days from the local onset of the outbreak. Another poll confirms that the prevalence of mask wear exceeded 50% for the first time from March 19-21.52 Lombardy (April 5) and Tuscany (April 6) required the public to wear masks in early April.S138 A nationwide mandate to wear masks in shops and public transport was announced on April 28, to take effect on May 4.S139 Mask wear in public remained between 85% and 89% between April 16 and June 10.53 By May 9, the per-capita mortality in Italy was 502.7 per million.
The next country to suffer was Spain, which reported its first case on January 31,S254 and experienced its first death from the virus on February 13.S255 The prevalence of mask wear among the Spanish public was 5% on March 12, 25% on March 19, 42% on March 25, and 56% on April 853—potentially 72 days after the entry of the virus into the country. Masks were mandated when in transit beginning April 11.S256 Mask wearing in public had climbed to 65% by April 16, 72% by April 30, and remained between 84% and 87% between May 20 and June 12.53 According to another survey, the prevalence of mask wear was 50% by March 21, 53% by April 4, and 61% by April 12.52 The per-capita mortality by May 9 was 566.3 per million.
In France, the first case of coronavirus was reported on January 24,S97 and the first death on February 14, of a man who arrived from China on January 16.S98 A poll found on March 10 that only 5% of those in France wore a mask in public.53 This number increased to 22% on March 27 and 25% on April 3,53 the day that the Académie Nationale de Médecine announced that masks should be compulsory in publicS99—at least 72 days into their outbreak. Polls indicated that mask wear among the public climbed to 38% on April 10, 43% on April 17, 56% on May 1, 76% on May 20, and 75% on June 12.53 Mask wear below 50% in early April was confirmed in another survey.52 On May 7, it was announced that throughout France, including its overseas departments, masks would be mandatory on transport, starting May 11.98 By May 9, the per-capita mortality in France was 403.1 per million.
In Germany, the first case of COVID-19 was reported on January 27. The patient had contact with a colleague visiting from China beginning January 19.S103 By March 30, only 7% of the public reported wearing a mask in public.53 On March 31, the city of Jena mandated use of masks by the public.S104 The Robert Koch Institute recommended that the public wear masks on April 1S105—at least 70 days from the onset of the outbreak. Masks were worn by 14% of the public on April 6, 17% on April 13, 24% on April 20, 62%-64% from May 4 through June 18.53 Another survey confirms mask wear at or below 20% in March and early April.52 All German states had mandates relating to mask wear in public by April 22.S106 By May 9, the per-capita mortality was 90.1 per million.
In the United Kingdom, the first cases of coronavirus were reported on January 31.S283 Here, 2% of the population wore a mask by March 20, 11% by April 17, 20% on May 1, and 27% on June 17.53 Another survey confirms mask wear below 20% from March 12 to April 12.52 Masks were recommended in England on public transport and in shops on May 11S284—over 100 days after the local outbreak onset. On June 4, English authorities announced that masks would be mandatory on public transit, beginning June 15.S285 By May 9, the per-capita mortality was 465.3 per million.
In the Netherlands, from April 1 to 19, the prevalence of mask wear was approximately 7%.99 The prime minister announced on May 6, 2020 that beginning June 1, masks would be required on public transport due to their value in situations where social distancing was not possible.S203
In Belgium, from April 4 to 19, the prevalence of mask wear increased from about 30 to 37%.99 The Prime Minister of Belgium announced on April 24 that masks would be mandatory on public transport effective May 4.S25
In the Scandinavian countries of Sweden, Norway, Denmark, and Finland, polls repeatedly showed masks to be worn by 10% or less of the population from March 16 through June 9.53 This low usage occurred despite the fact that the government in Finland began recommending that the public wear masks on April 14.S96
In Switzerland, the chief of the Communicable Diseases Department recommended masks on public transport on June 15.S264 However, a survey released June 18 found that only 6% of Swiss public transport riders did so.S264
In Poland, the health minister announced on April 9 that a public mask mandate would go into effect on April 16, and mask vending machines began to be installed.S216 In Poland, from April 12-14, 2020, 60.4% of Polish students age 18 to 27 wore a face mask in the previous 7 days.100 By May 9, the per-capita mortality was 20.7 per million.
The first cases of coronavirus in Russia were reported on January 31, 2020.S220 In Russia, the prevalence of mask wear among the public was 11% by March 14, 19% by March 21, 36% by March 28, and 57% by April 452—69 days after the estimated start of the outbreak. Mask wearing prevalence had increased to 59% by April 12.52 On May 11, it was announced that masks would be mandatory in shops and public transport (Time/Russia). By May 9, the per-capita mortality was 12.5 per million.
In Serbia, in April 2020, 60% of the public agreed they were willing to wear a mask during a pandemic, and respondents on average answered 3.25 (SD 1.6) on a 1 to 5 scale when asked if they wore masks, where 4 represented “agree” and 5 represented “strongly agree”.101
Some additional Western governments mandated or recommended mask-wearing in public by April 16, 2020. By March 29, masks were mandated in indoor public spaces in Slovenia.S245 In Austria, a mandate to wear masks in shops was announced on March 30, with the expectation that masks would be available by April 1.S13 In addition, the requirement to wear masks on public transit was announced there on April 6.S14 Masks were recommended for the public in BulgariaS41 and UkraineS278,S279 on March 30. In Lithuania, masks were recommended for the public on March 26,S166 and mandated on April 8.S167 Government mandates or recommendations for mask wearing by the public were also issued in: Turkey,S275 and CyprusS69 on April 3; Estonia on April 5;S94 and Luxembourg on April 15.S168
Masks in the United States and Canada
The earliest case of COVID-19 in the United States was a man who returned from China on January 15, 2020, and presented at an urgent care clinic on January 19.102 In the United States, the prevalence of mask wear in public was 7% on March 2, 5% on March 17, and 17% on March 30.53 The U.S. C.D.C. began recommending that asymptomatic people wear a mask in public on the evening of April 3103—at least 79 days after the virus had entered the country. Subsequently, the prevalence of mask wear was 29% on April 6, 49% on April 13, 58% on April 20, 63% on April 27, 68% on May 26, and 66% on June 8.53 Another survey found that the prevalence of mask wear was 32% from April 2-4, and 50% from April 9-12.52 According to another survey, from April 14-20, 36% of U.S. adults always wore a mask outside the home, 32% did so sometimes, and 31% never did.S286 Mask wearing varied by region. In Vermont, from May 16 to 30, 76% of people entering businesses were observed to wear a mask.104 On the other hand, in Wisconsin from June 3-9, only 42% of shoppers were observed to wear a mask.105 By May 9, the per-capita coronavirus-related mortality was 241.8 per million.
In Canada, the prevalence of mask wear was 6% on March 17, and 18% on April 6,53 when the government announced that masks were now recommended in public.S49 Uptake was gradual, with mask wearing at 16% on April 13, 31% on April 20, 41% on April 27, 49% on May 26, and 58% on June 11.53 Another survey confirms mask wear below 30% in March and early April.52 By May 9, the per-capita coronavirus-related mortality was 124.3 per million.
Masks in Australia
In Australia, surveys of the public indicated that 10% wore a mask by March 15, which gradually increased to a high point of 27% by April 19, after which use gradually declined to 17% on June 5.53 Another survey confirms mask wear below 25% in March and early April.52
Masks in Latin America and the Caribbean
On April 3, a reporter in Bogotá noted that 90% of the people on the street were wearing face masks.S63 On April 4, the government of Colombia mandated masks on public transport and shops.S62-S65
On April 6, the Minister of Health in Chile announced that masks would be mandatory on public transport starting April 8.S57 Due to the shortage of medical masks, the public was invited to make their own out of cloth.S57
Surveys indicate that in Mexico, the prevalence of public mask wear increased steadily from 17% on March 17 to 37% on April 6, 46% on April 13, 60% on April 20, and 67% on April 27.53 According to another survey, the prevalence was 31% by March 14, 36% by March 21, 46% by April 4, and 58% by April 9.52 Although some states had mandated masks, the federal minister leading the coronavirus response refrained from encouraging the public wearing of masks until May 5.S180,S181 By May 9, the per-capita mortality was 26.0 per million.
Ecuador did not require masks early in their outbreak. The first case of COVID-19 in Ecuador was reported on February 29 in a traveler who had arrived from Spain on February 14.S83 The first death was reported on March 13.S84 By April 3, it was noted in Guayaquil that mortuary facilities were overwhelmed, and bodies were being left on the streets.S85 On April 7, the Interior Minister of Ecuador announced that face masks were mandatory in publicS86—at least 48 days (and possibly 53 days) after the local onset of the outbreak. By May 9, the reported mortality was 97.3 per million.
The first case of COVID-19 in Brazil was reported on February 26.S37 In Brazil, the prevalence of mask wear in public was 25% by March 14, 28% by March 21, 39% by April 4, and 56% by April 1252—50 days after the virus is estimated to have arrived in the country. By May 9, the per-capita mortality was 50.1 per million.
Graphical Analysis of Mask Effect
Before the formal statistical analysis, we graphically illustrate the effect of mask wear (Figures 1, 2). The first figure demonstrates the effect of early mask usage (Figure 1). In the countries not using masks by April 16, or not using them until 60 days after the start of the outbreak, the per-capita mortality by May 9 rises dramatically if the infection has persisted in the country over 60 days (Figure 1, red line). On the other hand, countries in which a mask was used from 16 to 30 days after infection onset had per-capita mortality several orders of magnitude less by May 9 (Figure 1, orange line). When countries recommended masks within 15 days of the onset of the outbreak, the mortality was so low that the curve is difficult to distinguish from the x-axis (Figure 1, blue line).

Scatter-plot of per-capita mortality by May 9, 2020 as a function of the period of the country’s outbreak without mask recommendations or norms. The dotted line represents the best fit using least-squares linear regression. Data for graph derived from 200 countries. Start of outbreak defined as 5 days before first case reported, or 23 days before the first death (whichever was earlier).
For instance, for the early mask-wearing countries in which the infection had arrived by January (Thailand, Japan, South Korea, Taiwan, Macau, Hong Kong, Vietnam, Cambodia, Malaysia, the Philippines), the virus was present in the country by 80 or more days by April 16 (Table 2). If masks had no effect, we might have expected these countries to have a mortality well over 200 deaths per million (Figure 1). Instead, the mortality for these 10 regions was 2.1 per million (SD 2.5, Table 2)—approximately a 100-fold reduction.
In order to provide some graphical idea of the scatter of the data when exponential growth is assumed, we graphed per-capita mortality by May 9 on a logarithmic scale as a function of the duration of the country’s outbreak not using masks in all 200 countries (Figure 2). This simple model explained 28.4% of the variation in per-capita mortality.
Initial multivariable analyses
An initial multivariable analysis was conducted including all 200 countries. By multivariable linear regression, significant predictors of the logarithm of each country’s per-capita coronavirus mortality included: duration of infection in the country, duration of wearing masks (p<0.001), percentage of the population over age 60, and urbanization (all p≤0.009, Appendix Table A2). The association of mortality with the timing of international travel restrictions was of borderline statistical significance (p=0.051). The model explained 48.3% of the variation in per-capita mortality (Table A2).
We also prepared a multivariable model to predict the logarithm of per-capita coronavirus mortality in the 196 countries with obesity data. In this model, lockdown, obesity, temperature, and urbanization were retained due to their plausibility as important factors (Table 3). By multivariable linear regression, significant predictors of the logarithm of each country’s per-capita coronavirus mortality included: duration of infection in the country, duration of wearing masks, and percentage of the population over age 60 (all p<0.001, Table 3). The associations of obesity and or urbanization with increased mortality approached statistical significance (p=0.10, Table 3). When controlling for the duration of infection in the country, there appeared to be a negative association between mortality and time in lockdown (p=0.85) and time with international travel restrictions (p=0.07), though neither association reached statistical significance (Table 3). The model explained 51.0% of the variation in per-capita mortality.
Predictors of (log) Country-wide Per-capita Coronavirus Mortality by May 9 by Multivariable Linear Regression in 196 Countries.
In countries not recommending masks, the per-capita mortality tended to increase each week by a factor of 1.621, or 62.1%. In contrast, in countries recommending masks, the per-capita mortality tended to increase each week by a factor of 1.6210*0.7145 = 1.158, or just 15.8%. With international travel restrictions in place (without masks), the per-capita mortality increased each week by (1.6210)(0.8645) = 1.401, or 40.1%. Under lockdown (without masks), the per-capita mortality increased each week by (1.6210)(0.9780) = 1.585, or 58.5%, i.e. slightly less than the baseline condition (Table 3).
A country with 10% more of its population living in an urban environment than another country tended to suffer a mortality 14.5% higher (100.0588 = 1.145, Table 3). A country in which the percentage of the population age 60 or over is 10% higher than in another country tended to suffer mortality 206% higher (100.485 = 3.06, Table 3). A country with a prevalence of obesity 10% higher tended to suffer mortality 39% higher (100.144 = 1.39, Table 3).
Numbers of Viral Tests
Among the 183 countries with viral (PCR) testing data by May 9, per-capita testing performed at all 3 time points was positively associated with per-capita mortality in univariate analysis (all p<0.001, Table 1). By May 9, 2020, low-mortality countries had performed 1 test for every 575 members of the population, while high-mortality countries had performed 1 test for every 81 members of the population (p<0.001, Table 1).
To the multivariable model (Table 3), we added testing by May 9, using data from 179 countries with both testing and obesity data. Duration of infection in the country, the duration that masks were recommended, and age at least 60 years continued to be significant predictors of per-capita mortality (all p≤0.001, Appendix Table A3). The model explained 52.5% of the variation in per-capita mortality. Each week the infection persisted in a country without masks was associated with a 62.7% increase in per-capita mortality (Table A3). In contrast, in countries where masks were recommended, the per-capita mortality tended to increase each week by 19.1% (because (1.6271)(0.7319) = 1.191, Table A3). In this model, the prevalence of obesity was associated with increased country-wide per-capita mortality, though the association was not significant (p=0.09). If the prevalence of obesity increased by 10% (e.g. from 10% to 20% of a population), the per-capita mortality tended to increase by 47% (Table A3)
In this model, a 10-fold increase (i.e. one logarithm) in per-capita testing tended to be associated with a 26.0% increase in reported per-capita mortality, though the trend was not close to reaching statistical significance (p=0.38, Appendix Table A3).
If early testing lowers mortality, one might expect negative regression coefficients. Testing on both April 16 and May 9 were added to the multivariable model of Table 3, using data from the 158 countries with both obesity and testing data by these dates. Per-capita testing (log) by April 16 was not negatively associated with per-capita mortality (log) by May 9 (coefficient 0.211, 95% CI -0.305 to 0.868, p=0.34).
Likewise, testing on both April 4 (the earliest archived data) and May 9 were added to the multivariable model of Table 3, using data from the 131 countries with both obesity and testing data by these dates. Per-capita testing (log) by April 4 was not significantly associated with per-capita mortality (log) by May 9 (coefficient -0.0535, 95% CI -0.380 to 0.273, p=0.75). Given the coefficient, a 10-fold (one log) increase in early testing would be associated with a (non-significant) decrease in per-capita mortality of 11.6%.
Only 5 countries had performed over 1 test for every 10 people in the country by May 9, 2020 (in order of most testing to least): the Faeroe Islands, Iceland, the Falkland Islands, the UAE, and Bahrain. The Faeroe and Falkland Islands reported no coronavirus-related deaths. The highest per-capita mortality among this group was 29.0 per million population (or 1 in 34,480 people), seen in Iceland.
Containment and Testing Policies
For 169 countries, containment, testing, and health policies were scored by Oxford University.9 The following countries with mask policies by April 16 were included in this analysis, but not in the previous multivariable model, for lack of data on numbers of tests performed: China, Macau, Cameroon, Sierra Leone, and Sudan. In univariate analysis, scores for school closing, cancelling public events, international travel controls, and index of containment and health were significantly associated with lower per-capita mortality (all p<0.05, Table 4). Policies regarding workplace closing, restrictions on gatherings, closing public transport, stay at home requirements, internal movement restrictions, public information campaigns, testing, and contact tracing were not significant predictors of mortality (all p>0.05, Table 4). Likewise, overall indices of stringency and government response were not associated with mortality (all p>0.05, Table 4).
Government policies in 169 countries with low and high per-capita coronavirus mortality by May 9, 2020.
A multivariable model in 169 countries found that duration of the infection, duration masks were recommended, prevalence of age at least 60 years, obesity, and international travel restrictions were independently predictive of per-capita mortality (Table 5). The model explained 66.8% of the variation in per-capita mortality. At baseline, each week of the infection in a country without masks was associated with an increase in per-capita mortality of 50.9% (Table 5). In contrast, for each week that masks were worn, the per-capita mortality was associated with a lesser increase of 12.4% each week (given that 1.5085 (0.7449) = 1.124, Table 5).
Predictors of (log) Country-wide Per-capita Coronavirus Mortality by May 9 by Multivariable Linear Regression in 169 Countries.
International travel restrictions were scored by Oxford as: (0) no measures, (1) screening, (2) quarantine arrivals from high-risk regions; and ban on arrivals from some (3) or all (4) regions. The international travel restrictions were scored as 4 in Greenland, 3.8 in Bermuda, 3.6 in Israel, 3.5 in Czechia and New Zealand, 3.1 in Taiwan, and 2.9 in Australia, and at the other extreme, were scored as 1.1 in Sweden, and as 0 in Iran, Luxembourg, and the UK.
International travel restrictions were associated with lower mortality, regardless of whether incorporated in the model as time since onset, or as mean score during the outbreak. We present the model based on the former because of the strength of the association, and for consistency with the models presented previously. The regression analysis suggested that for each week of travel restrictions (without masks), the per-capita mortality increased by 25.1% (given that 1.5085 (0.8291) = 1.251, Table 5).
Per-capita mortality was not significantly associated with policies regarding either testing policy (p=0.91), or contact tracing (p=0.06, Table 5). Testing policy was scored as: no policy (0), symptomatic with exposure, travel history, hospitalization, or key occupation (1), all symptomatic (2), or open to anyone (3). Testing policy tended to be positively associated with mortality. Contact tracing was scored as: none (0), some cases (1), or all cases (2), and tended to be inversely related with per-capita mortality (though not significantly). These countervailing associations meant that as compared with a country with no testing or tracing policy, a country which opened testing to the entire public with comprehensive contact tracing might be associated with a reported change in mortality of 10(3*0.0122+2*(−0.172)) = 0.493, i.e. a 51.7% reduction in per-capita mortality (though statistical significance was not demonstrated). Thus, testing and tracing may be important factors, but seem unlikely to account for the majority of the 100-fold variation in per-capita mortality between low and high mortality countries early in the course of the pandemic.
Survey-modified Model
Surveys of mask wearing by the public during the exposure period were available for 41 countries (see above). To determine the influence that actual mask-wear, as opposed to mask policies, might have on the model, we scored countries as mask-wearing if at least 50% of the public wore a mask, and non-mask wearing if less than 50% of the population did so.
Based on surveys, Canada, Finland, France, Germany, and Malawi were not considered mask-wearing countries at any time during the exposure period (ending April 16). In contrast, Italy was scored as mask-wearing beginning March 19,53 Spain53 and India52 beginning March 21, Saudi Arabia beginning April 1,53 Russia beginning April 4, Singapore beginning April 10,53 and the United States, Brazil and Mexico beginning April 12.52,53
In this survey-modified model in 200 countries, duration of the outbreak, duration of mask wear, proportion of the population age 60 or over, and urbanization were all significant predictors of per-capita mortality (all p<0.01, Appendix Table A4). Time since the start of international travel restrictions tended to be inversely associated with mortality (p=0.051). Each week that the infection persisted in the country without masks was associated with a 59.9% increase in per-capita mortality. On the other hand, when masks were worn, the per-capita mortality only increased by 9.3% weekly, (1.5993)(0.6836) = 1.093, (Appendix Table A5). The model explained 48.3% of the variance in mortality.
Discussion
These results confirm that in the first 4 months of 2020, there was marked variation between countries in mortality related to COVID-19. Countries in the lower half of mortality experienced an average COVID-19-related per-capita mortality of 0.99 deaths per million population, in contrast with an average of 93.3 deaths per million in the remaining countries. Depending on the model and dataset evaluated, statistically significant independent predictors of per-capita mortality included urbanization, fraction of the population age 60 years or over, prevalence of obesity, duration of the outbreak in the country, international travel restrictions, and the period of the outbreak subject to cultural norms or government policies favoring mask-wearing by the public.
These results support the universal wearing of masks by the public to suppress the spread of the coronavirus.1 Given the low levels of coronavirus mortality seen in the Asian countries which adopted widespread public mask usage early in the outbreak, it seems highly unlikely that masks are harmful.
On April 30, 2020, we originally published the finding that the logarithm of per-capita coronavirus mortality is linearly and positively associated with the duration of the outbreak without mask norms or mandates .46 This key finding was recently confirmed by Goldman Sachs chief economist Jan Hatzius, who cited our work.107 The regression analysis performed by Goldman Sachs confirms that, for prediction of both infection prevalence and mortality, the significance of the duration of mask mandates or norms in the model persists after controlling for age of the population, obesity, population density, and testing policy.107
One major limitation is that evidence concerning the actual prevalence of mask-wearing by the public is unavailable for most countries. Our survey of the literature is one of the more complete evaluations of the question to date. Available scholarship and surveys do corroborate reports in the news media that mask wear was common in public in many Asian countries, including Japan, the Philippines, Hong Kong, Vietnam, Malaysia, Taiwan, Thailand, China, Indonesia, India, Myanmar and Bangladesh (Table 2). Internet search data are consistent with interest in masks developing much earlier in the course of the pandemic in Asia than elsewhere.108,109 Mask wear was widespread in some low-mortality countries even before, or in the absence of, a formal government recommendation.
In addition, it is likely that the policies favoring mask-wearing in parts of the Middle East, Africa, Latin America and the Caribbean were markers of a general cultural acceptance of masks that helped to limit spread of the virus. Had there been adequate survey data to fully reflect the early wearing of masks in these regions, it is possible that the association of masks with lower mortality would be even stronger.
Conversely, in Western countries which had no tradition of mask-wearing, and which only recommended (rather than mandated) mask-wearing by the public, such as the United States, the practice has been steadily increasing, but change has not been immediate.
Much of the randomized controlled data on the effect of mask-wearing on the spread of respiratory viruses relates to influenza. One recent meta-analysis of 10 trials in families, students, or religious pilgrims found that the relative risk for influenza with the use of face masks was 0.78, a 22% reduction, though the findings were not statistically significant.110 Combining all the trials, there were 29 cases in groups assigned to wear masks, compared with 51 cases in control groups.110 The direct applicability of these results to mask-wearing at the population level is uncertain. For instance, there was some heterogeneity in methods of the component trials, with one trial assigning mask wearing to the person with a respiratory illness, another to his close contacts, and the remainder to both the ill and their contacts.110 Mask-wearing was inconsistent. The groups living together could not wear a mask when bathing, sleeping, eating, or brushing teeth.111-113 In one of the studies reviewed, parents wore a mask during the day, but not at night when sleeping next to their sick child.113 In a different trial, students were asked to wear a mask in their residence hall for at least 6 hours daily (rather than all the time).111 The bottom line is that it is nearly impossible for people to constantly maintain mask wear around the people with whom they live. In contrast, wearing a mask when on public transit or shopping is quite feasible. In addition, as an infection propagates through multiple generations in the population, the benefits multiply exponentially. Even if one accepts that masks would only reduce transmissions by 22%, then after 10 cycles of the infection, mask-wearing would reduce the level of infection in the population by 91.7%, as compared with a non-mask wearing population, at least during the period of exponential growth (because 0.7810 = 0.083). It is highly unlikely that entire countries or populations will ever be randomized to either wear, or not wear, masks. Public policies can only be formulated based on the best evidence available.
Some countries which used masks were better able to maintain or resume normal business and educational activities. For instance, in Taiwan, schools reopened on February 21, 2020, with parents directed to purchase 4 to 5 masks per week for each child.S265
Limits on international travel were significantly associated with lower per-capita mortality from coronavirus. On the other hand, nationwide policies to ban large gatherings and to close schools or businesses, tended to be associated with lower mortality, though not in a statistically significant fashion. However, businesses, schools, and individuals made decisions to limit contact, independent of any government policies. The adoption of numerous public health policies at the same time can make it difficult to tease out the relative importance of each.
Colder average monthly temperature was associated with higher levels of COVID-19 mortality in univariate analysis, but not when accounting for other independent variables. One reason that outdoor temperature might have limited association with the spread of the virus is that most viral transmission occurs indoors.114 We acknowledge that using the average temperature in the country’s largest city during the outbreak does not model the outbreak as precisely as modelling mortality and temperature separately in each of the thousands of cities around the world. However, to a first approximation, our method did serve to control for whether the country’s climate was tropical, temperate, or polar, and whether the outbreak began in late Winter (Northern hemisphere) or late Summer (Southern hemisphere). Environmental factors which could influence either human behavior or the stability and spread of virus particles are worthy of further study.
Presumably, high levels of testing might identify essentially all coronavirus-related deaths, and still higher levels of testing, combined with contact tracing, might lower mortality. Statistical support for the benefit of mass testing could not be demonstrated. It seems likely that countries which test at a low level are missing many cases. We identified just 5 countries (Iceland, the Faeroe Islands, the UAE, the Falkland Islands, and Bahrain) which had tested over one tenth of their population by May 9. All 5 countries had a mortality of 29 per million (1 in 34,480 people) or less. The degree to which these results would apply to larger, less isolated, or less wealthy countries is unknown. Statistical support for benefit of high levels of testing might be demonstrated if additional and more diverse countries are able to test at this level. The benefits of contact tracing policies with respect to mortality were of marginal statistical significance (p=0.06).
One limitation of our study is that the ultimate source of mortality data is often from governments which may not have the resources to provide a full accounting of their public health crises, or an interest in doing so. It should be noted that the benefit of wearing masks persisted in a model which excluded data from China (because no testing data were available, Appendix Table A3). We also acknowledge that country-wide analyses are subject to the ecologic fallacy.
The source for mortality and testing data we selected is publicly available,7 has been repeatedly archived,11 contains links to the source government reports for each country, and agrees with other coronavirus aggregator sites.115 In the interest of transparency, we presented the per-capita mortality data in Appendix Table A1. One might question whether any of these data sites or governments provide a complete and accurate picture of coronavirus mortality. But we must remember that this information does not exist in a vacuum. Independent sources confirm when mortality has been high. Social media alerted the world to the outbreaks in Wuhan, Iran, Italy, and New York. News reports have used aerial photography to confirm the digging of graves in Iran, New York, and Brazil. Long lines were seen to retrieve remains at crematoria in Wuhan. Mortuary facilities were inadequate to meet the demand in New York, and Guayaquil.S85 Conversely, signs of health system overload have been noted to be absent in the countries reporting low mortality. The health systems in Hong Kong, Taiwan, Japan, and South Korea are believed to be transparent. Reporters in Vietnam have even called hospitals and funeral homes to confirm the absence of unusual levels of activity.S297 Therefore, while no data source is perfect, we believe that the data used in the paper are consistent with observations from nongovernmental sources, and are comparable in reliability to those in other scholarly works.
It is not the case that countries which reported no deaths due to coronavirus simply were not exposed to the virus. All 200 countries analyzed did report COVID-19 cases. Several countries which traditionally use masks and sustained low mortality (or none) are close to and have strong travel links to China. Some of these countries reported cases early in the global pandemic (Table 2). Community transmission has been described in Vietnam.116
The pandemic is a matter of universal concern, but ophthalmologists have specific reasons to understand and prevent infection with SARS-CoV-2. The virus can cause a conjunctivitis, and has been identified in tears.117,118 It is possible that transmission can occur by conjunctival exposure to droplets.117 Ophthalmology was among the specialties whose residents were at higher risk of coronavirus infection.119 COVID-19 claimed the lives of 3 ophthalmologists from Wuhan Central Hospital, including 33-year-old Li Wenliang, who was admonished for sharing news of the novel pneumonia online.117,S61 As of April 15, 2020, at least 8 ophthalmologists had died from COVID.120
In summary, older age of the population, urbanization, obesity, and longer duration of the outbreak in a country were independently associated with higher country-wide per-capita coronavirus mortality. International travel restrictions were associated with lower per-capita mortality. However, other containment measures, testing and tracing polices, and the amount of viral testing were not statistically significant predictors of country-wide coronavirus mortality, after controlling for other variables. In contrast, societal norms and government policies supporting mask-wearing by the public were independently associated with lower per-capita mortality from COVID-19. The use of masks in public is an important and readily modifiable public health measure.
Financial Disclosures
The authors have no conflicts of interest.
Author contributions
Design of the study (CL, EI); collection of data (CL, EI, JL, MH); management and analysis of data (CL, EI); interpretation of the data (CL, EI, JL, CM, AG); preparation of the manuscript (CL,EI,JL); review and approval of the manuscript (CL, EI, JL, MH, CM, AG).
Acknowledgements / Disclosures. Funding
None.
Appendix
Supplemental Tables
Per-capita COVID-19 Mortality by May 9 and Date of Mask Recommendation or Widespread Use Based on Cultural Norms.
Predictors of (log) Country-wide Per-capita Coronavirus Mortality by May 9 by Multivariable Linear Regression in 200 Countries.
Predictors of (log) Country-wide Per-capita Coronavirus Mortality by May 9 by Multivariable Linear Regression in 179 Countries.
Predictors of (log) Country-wide Per-capita Coronavirus Mortality by May 9 by Multivariable Linear Regression in 200 Countries, with Mask Wear Determined by Recommendations and Surveys (When Available).
Footnotes
None of the authors has any conflicts of interest to disclose.
References
- 1.↵
- 2.↵
- 3.↵
- 4.↵
- 5.↵
- 6.↵
- 7.↵
- 8.↵
- 9.↵
- 10.↵
- 11.↵
- 12.↵
- 13.↵
- 14.↵
- 15.↵
- 16.↵
- 17.↵
- 18.↵
- 19.↵
- 20.↵
- 21.
- 22.
- 23.↵
- 24.↵
- 25.
- 26.
- 27.
- 28.
- 29.
- 30.
- 31.
- 32.
- 33.
- 34.
- 35.
- 36.
- 37.
- 38.
- 39.
- 40.
- 41.
- 42.
- 43.↵
- 44.↵
- 45.↵
- 46.↵
- 47.↵
- 48.↵
- 49.↵
- 50.
- 51.
- 52.↵
- 53.↵
- 54.
- 55.
- 56.
- 57.
- 58.↵
- 59.
- 60.
- 61.
- 62.
- 63.↵
- 64.
- 65.
- 66.↵
- 67.
- 68.
- 69.↵
- 70.↵
- 71.↵
- 72.↵
- 73.↵
- 74.↵
- 75.↵
- 76.↵
- 77.↵
- 78.↵
- 79.↵
- 80.↵
- 81.↵
- 82.
- 83.
- 84.↵
- 85.↵
- 86.↵
- 87.↵
- 88.↵
- 89.↵
- 90.↵
- 91.↵
- 92.↵
- 93.↵
- 94.↵
- 95.↵
- 96.
- 97.↵
- 98.↵
- 99.↵
- 100.↵
- 101.↵
- 102.↵
- 103.↵
- 104.↵
- 105.↵
- 106.
- 107.↵
- 108.↵
- 109.↵
- 110.↵
- 111.↵
- 112.
- 113.↵
- 114.↵
- 115.↵
- 116.↵
- 117.↵
- 118.↵
- 119.↵
- 118.
Supplemental References by Country
Afghanistan.
- S1.↵
Algeria.
- S2.
Andorra.
- S3.
Angola.66
- S4.
- S5.
- S6.
- S7.
- S8.
Antigua & Barbuda.
- S9.
- S10.
Argentina.
- S11.
Armenia.
- S12.
Austria.
Azerbaijan.
- S15.
Bahamas.
- S16.
Bahrain.
- S17.↵
Bangladesh.
- S18.
- S19.
Barbados.
- S20.
- S21.
- S22.
- S23.
- S24.
Belgium.
- S25.↵
Belize.
- S26.
Benin.
- S27.
- S28.
- S29.
- S30.
Bhutan.
- S31.
- S32.
Bosnia & Herzegovina.
- S33.
- S34.
- S35.
Botswana.
- S36.
Brazil.
- S37.↵
British Virgin Islands.
- S38.
Brunei.
- S39.
- S40.
Bulgaria.
- S41.↵
Burkina Faso.
- S42.
Cabo Verde.
- S43.
Cambodia.
- S44.
- S45.
- S46.
Cameroon.66
Canada.
- S49.↵
Cayman Islands.
- S50.↵
- S51.
Chad.66
- S52.
- S53.
- S54.
- S55.
- S56.
Chile.
- S57.↵
China.
Colombia.
Congo (Brazzaville).
- S66.↵
Croatia.
- S67.
Cuba.
- S68.↵
Cyprus.
- S69.↵
Czechia.
- S70.
- S71.
Djibouti.
- S72.
Dominica.
- S73.
- S74.
- S75.
- S76.
- S77.
- S78.
- S79.
- S80.
Dominican Republic.
- S81.
- S82.↵
Ecuador.
Egypt.
El Salvador.
- S89.
- S90.
- S91.
- S92.
Equatorial Guinea.
- S93.↵
Estonia.
- S94.↵
Ethiopia.
- S95.↵
Finland.
- S96.↵
France.
French Guayana.98 Gabon.63,66 Gambia.
Georgia.
- S102.
Germany.
Ghana.
Greece.
- S109.
Grenada.
- S110.
- S111.
- S112.
Guadeloupe.98
Guatemala.
- S113.
Guinea.
- S114.↵
Guinea-Bissau.
- S115.
Guyana.
- S116.
Haiti.
- S117.↵
- S118.
Honduras.
- S119.
Hong Kong.
- S120.↵
- S121.
- S122.
Hungary.
- S123.
India.
Indonesia.
- S126.
- S127.
- S128.
- S129.
Iran.
Iraq.
- S133.
Ireland.
- S134.
Israel.
- S135.↵
Italy.
Ivory Coast.66
- S140.
- S141.
Jamaica.
- S142.
- S143.
Japan.
- S144.
- S145.
- S146.
Jordan.
- S147.↵
- S148.
Kazakhstan.
- S149.
Kenya.
- S150.
- S151.
- S152.
- S153.
- S154.
Kuwait14 Kyrgyzstan.
- S155.
Laos.
- S156.
- S157.
Latvia.
- S158.
Lebanon.
Liberia.
- S163.
Libya.
- S164.↵
Liechtenstein.
- S165.
Lithuania.
Luxembourg.
- S168.↵
Macao.
- S169.
Madagascar.
- S170.
Malawi.
- S171.
- S172.
Malaysia.
- S173.
Maldives.
- S174.
Mali.
- S175.
Malta.
- S176.
Mauritania.
- S177.
Mauritius.
- S178.↵
Mayotte.
- S179.
Mexico.
Moldova.
- S182.
Mongolia
- S183.
- S184.
Montenegro.
- S185.
Montserrat.
- S186.
Morocco.
- S187.↵
Mozambique.
- S188.
- S189.
- S190.
Myanmar.
- S191.
- S192.
- S193.
- S194.
- S195.
- S196.
Namibia.
- S197.
Nepal.
Netherlands.
- S203.↵
New Caledonia.
- S204.
Niger.
- S205.
Nigeria.
- S206.↵
North Macedonia.
- S207.
Oman.
- S208.
Pakistan.
- S209.↵
Palestine.
- S210.
Panama.
- S211.
Papua New Guinea.
- S212.
Paraguay.
- S213.
Peru.
- S214.
Philippines.
- S215.
Poland.
- S216.↵
Portugal.
- S217.
Qatar.
- S218.
Réunion.98 Romania.
- S219.
Russia.
- S220.↵
- S221.
Rwanda.
- S222.
Saint Kitts & Nevis.
- S223.
- S224.
- S225.
Saint Lucia.
- S226.
- S227.
- S228.
Saint Vincent & Grenadines.
San Marino.
- S229.
São Tomé & Príncipe.63
- S230.
Saudi Arabia.
Senegal.66 Serbia.
- S234.
Seychelles.
- S235.
Sierra Leone.
- S236.
- S237.
- S238.
Singapore.
Sint Maarten.
- S242.
Slovakia.
- S243.
- S244.
Slovenia.
- S245.↵
South Africa.
South Korea.
- S249.
- S250.
- S251.
South Sudan.
- S252.
- S253.
Spain.
Sri Lanka.
St. Vincent & Grenadines.
- S259.
- S260.
Sudan.
- S261.
- S262.
Suriname.
- S263.
Switzerland.
- S264.↵
Taiwan.
- S265.↵
Thailand.
- S266.
- S267.
- S268.
- S269.
Timor-Leste.
- S270.
- S271.
Togo.
- S272.
Trinidad & Tobago.
- S273.
Tunisia.
- S274.↵
Turkey.
- S275.↵
Turks and Caicos.
- S276.
Uganda.
- S277.
Ukraine.
United Arab Emirates.
United Kingdom.
United States.
- S286.↵
Uruguay.
- S287.
Uzbekistan.
- S288.
- S289.
Venezuela.
- S290.
- S291.
- S292.
- S293.
- S294.
Vietnam.
- S295.
- S296.
- S297.↵
Zambia.
- S298.
- S299.
- S300.
Zimbabwe.
- S301.↵


Subject Area
Reviews and Context
14
Comment
0
TRIP Peer Reviews
0
Community Reviews
0
Automated Services
62
Blogs/Media
Author Videos