
Abstract
Polygenic [risk] scores (PGS) can enhance prediction and understanding of common diseases and traits. However, the reproducibility of PGS and their subsequent applications in biological and clinical research have been hindered by several factors, including: inadequate and incomplete reporting of PGS development, heterogeneity in evaluation techniques, and inconsistent access to, and distribution of, the information necessary to calculate the scores themselves. To address this we present the PGS Catalog (www.PGSCatalog.org), an open resource for polygenic scores. The PGS Catalog currently contains 192 published PGS from 78 publications for 86 diverse traits, including diabetes, cardiovascular diseases, neurological disorders, cancers, as well as traits like BMI and blood lipids. Each PGS is annotated with metadata required for reproducibility as well as accurate application in independent studies. Using the PGS Catalog, we demonstrate that multiple PGS can be systematically evaluated to generate comparable performance metrics. The PGS Catalog has capabilities for user deposition, expert curation and programmatic access, thus providing the community with an open platform for polygenic score research and translation.
Main Text
By aggregating the effects of many genetic variants into a single number, polygenic scores (PGS) have emerged as a method to predict an individual’s genetic predisposition for a phenotype1–4. Early studies indicated that combining allelic counts of Genome-wide Association Study (GWAS)-significant variants in individuals was predictive of the phenotype5–8. Owing to larger and more powerful GWAS, more recent PGS typically comprise hundreds-to-millions of trait-associated genetic variants which are combined using a weighted sum of allele dosages multiplied by their corresponding effect sizes.
Many PGS have been developed and demonstrated to be predictive of common traits (e.g. body mass index [BMI]9, blood lipids10, educational attainment11). Similarly, PGS for various diseases have been shown to be predictive of disease incidence, defining marked increases in risk over the lifecourse or at earlier ages for those individuals with high PGS (e.g. coronary artery disease [CAD]12,13, breast cancer14, schizophrenia15). Existing risk prediction models using traditional risk factors can be improved by incorporating PGS12,16,17. In some cases PGS may be the most informative risk factor in pre-symptomatic individuals1,18, and for some diseases independent of a family history of the condition19–22. Other potential clinical uses of PGS include predicting prognosis, aetiology and disease subtypes; stratification of patients according to therapeutic benefit and identification of new disease biomarkers and drug targets. Given their multiple applications, a large number of PGS have been developed, with over 900 articles indexed in PubMed since 200923.
There is widespread variability in PGS research, even with regard to nomenclature: they can be referred to as genetic or genomic scores, and as polygenic risk scores (PRS) or genomic risk scores (GRS) if they predict a discrete phenotype (such as a disease)24. There are also many approaches to derive PGS using individual level genotype data or GWAS summary statistics25. The goals of most computational methods are to select the most predictive set of variants in the score, and to adjust their weights to maximise predictive capacity and account for linkage disequilibrium (LD) between variants.
The need for an open resource for polygenic scores
Multiple barriers inhibit progress in PGS research and the translation of PGS into healthcare settings. Lack of best practices and standards, particularly with regard to PGS reporting, are major issues identified by our group and others24,26. Reproducibility has been hampered by underreporting of key PGS information; ~33% of 165 papers we reviewed during our curation efforts did not have adequate variant information (e.g. chromosomal location, effect allele and weight) to calculate the PGS for new samples.
Apart from information necessary for PGS calculation, a complete understanding of a score’s ability to accurately predict its target trait (also known as analytic validity) is necessary to help evaluate clinical utility and enable other applications of PGS. However, the performance reported for existing PGS are conditional on study design, participant demographics, case definitions, and covariates adjusted for in the original study’s models. While there are few direct evaluations of PGS, benchmarking of multiple PGS for the same trait in external data provides the comparable performance metrics needed to decide which PGS offers the best performance for a particular task and how this varies when important factors change, such as ancestry27. Since PGS are based on data and cohorts of largely European ancestries, there is a well-characterised underperformance of PGS when applied to non-European individuals, thus the transferability of PGS performance is a particularly important challenge28–30.
Here, we present the Polygenic Score Catalog (PGS Catalog; www.PGSCatalog.org): an open resource of published PGS annotated with relevant metadata required for accurate application and evaluation. The PGS Catalog promotes PGS reproducibility by providing a venue to annotate and distribute scores according to current exemplar reporting standards. As such, it enables users to re-use and evaluate polygenic scores, thus firmly establishing their predictive ability and facilitating studies to investigate clinical utility.
Development of the PGS Catalog
The aim of the PGS Catalog is to index and distribute the key aspects of each PGS (underlying variants, results, and experimental design) in a standardised representation, in order to facilitate evaluations of analytic validity. To maximise usability, the data representation and database were designed to be findable, accessible, interoperable, and reusable (FAIR) according to established principles for scientific data management (Supplemental Table 1)31.
To define the key information that would need to be captured in the PGS Catalog we undertook an initial literature review of 27 highly-cited publications that developed PGS for the following traits and diseases based on their potential clinical utility and public health burden of disease: coronary artery disease (CAD), diabetes (types 1 and 2), obesity / body mass index (BMI), breast cancer, prostate cancer and Alzheimer’s disease. During our review we took note of how PGSs were described, how they differed between studies and traits, as well as the most common study designs and PGS evaluation scenarios. To capture common aspects of PGS studies we built upon the NHGRI-EBI GWAS Catalog’s established frameworks to catalog published data from genomic studies, using established conventions for representing sample ancestry 32, variant, and trait information 33. Using our survey and established frameworks we defined four major data objects: Scores, Samples, Performance Metrics, and Publications (Box 1, Supplemental Table 2). These objects describe the common PGS development and evaluation processes (Figure 1A), and can be used to capture the detailed data elements necessary to evaluate PGS development and performance.

(A) PGS analyses can broadly be described in two stages: determining the set of variants and weights that will predict a trait of interest (Score Development), and an evaluation of how predictive the PGS is in an external set of samples (PGS Evaluation). Major data items (Box 1) that can be queried and browsed in the PGS Catalog are highlighted as coloured boxes, and linked to metadata items that are recorded. (B-C) Example of how PGS metadata is displayed for each score on PGSCatalog.org (example score PGS00007 14). Sections are highlighted with coloured bars corresponding to the data objects they display in A.
To ensure that the PGS Catalog contains the information necessary to describe and evaluate PGS, we collaborated with the ClinGen Complex Disease Working group34, composed of experts in epidemiology, statistics, implementation science and the actionability of genetic results, as well as those with disease-domain specific knowledge and interests in PRS application. Together we developed the Polygenic Risk Score Reporting Standards (PRS-RS)24, a joint statement describing a set of reporting items that should be described in studies developing and evaluating PRS. The PGS Catalog captures the data required by the PRS-RS to assess PGS validity, while also being flexible enough to capture multiple different study designs and evaluation scenarios in a structured database. The PGS Catalog therefore provides a venue to index PGS analyses and maximize uptake of these reporting standards.
Description of the PGS Catalog objects and metadata
(Field-by-field reporting items are available in Supplemental Table 2)
Scores (e.g. PGS/PRS/GRS) are the main data object-type in the PGS Catalog, linked to all other objects internally and can be cited or externally linked to by its persistent identifier (e.g. PGS000018). Each PGS is annotated with information about the phenotype it predicts (Reported Trait), and mapped to Experimental Factor Ontology (EFO) terms35,36 to consistently annotate related scores and facilitate data linkage and search. Score development details, including computational algorithms and parameters are recorded for each score. The GWAS summary statistics used to derive the model, if any, are linked as Sample objects and further linked to the GWAS Catalog if applicable33; any other datasets used for training are also linked as Sample objects. Each PGS has a PGS Scoring File, a flat text file in a consistent format (Supplemental Note 1) which contains the variant-level information necessary to calculate the score on new data (minimally the genome build, rsID or chromosomal positions, effect alleles and their weights).
Samples are described with detailed information to enable the interpretation and assessment of the validity of a PGS. Sample size (stratified by cases and controls if dichotomous) and participant ancestry are described using frameworks identical to the GWAS Catalog - this enables the systematic tracking of participant diversity in PGS37. To facilitate reproducible analyses, phenotyping descriptions (e.g. case definition, ICD-9/10 codes, measurement methods), the sex distribution, and the distributions of participant ages and follow-up times for prospective study designs can also be recorded. To ensure that PGS are not evaluated on individuals who contributed to the original GWAS or PGS training cohorts, Samples can be annotated with existing cohort names38. Groups of Samples used to evaluate PGS are given a Sample Set (PSS) ID.
Performance Metrics assess the validity of a PGS in a Sample Set, independent of the samples used for score development. Common metrics include standardised effect sizes (odds/hazard ratios [OR/HR], and regression coefficients [β]), classification accuracy metrics (e.g. AUROC, C-index, AUPRC), but other relevant metrics (e.g. calibration [χ2]) can also be recorded. The covariates used in the model (most commonly age, sex, and genetic principal components (PCs) to account of population structure) are also linking to each set of metrics. Multiple PGS can be evaluated on the same Sample Set and further indexed as directly comparable Performance Metrics.
Publications provide provenance information for Scores and Performance Metrics (including those from external evaluations of existing PGS). Both journal articles and preprints can be indexed by either DOI or PubMed ID.
The PGS Catalog: data content, access, and expansion
Any published or preprinted PGS can be added to the PGS Catalog provided it has (1) established analytic validity in external samples, and (2) the information necessary to calculate the score (see Supplemental Note 2 for additional details). To populate the PGS Catalog we screened over 180 publications for eligibility, of which 110 publications were eligible for curation and inclusion. The PGS Catalog currently contains 192 consistently-annotated PGS, curated from 69 publications (with the earliest published in 2008). These PGS predict a wide variety of diseases (e.g. cardiovascular diseases and different types of cancer) as well as anatomical (e.g. body mass index (BMI), bone density), cellular (e.g. blood cell counts and phenotypes) and molecular (serum urate, cholesterol and triglyceride levels) traits and measurements, encompassing 86 unique mapped ontology terms. To assess external validity the Catalog also indexes the results of evaluations of existing PGS in new contexts (e.g. direct comparisons of multiple PGS on the same sample); nine of these benchmarking publications evaluating nine existing PGS are also included in the current release of the PGS Catalog. Of the 68 publications developing at least one new PGS, nine also include a benchmarking of the performance to existing PGS.
The PGS Catalog can be accessed through a user interface (www.PGSCatalog.org) where indexed publications, scores and traits are browsable and searchable. Metadata describing PGS development and evaluation can be viewed on each score’s page (annotated example in Figure 1B). Pages describing traits with available PGS and the scores developed and evaluated within each publication can also be viewed (Supplemental Figure 1). Each PGS Scoring File contains a header describing the provenance of the score and consistently formatted columns describing the variants, alleles and weights. The Scoring File can be used in conjunction with common tools (e.g. PLINK39; (Supplemental Note 1)). The metadata and scoring files can be downloaded alone or in bulk from our website and FTP server; programmatic access to the database is also available through a RESTful API (complete implementation details are provided in Supplemental Note 3). Importantly the PGS Catalog provides users a source of existing scores that can be directly applied to their own data, making results obtained in PGS using the same score more comparable and circumventing the need to develop a new PGS for every application.
The Catalog identifies new papers from a manual literature search and user submissions, which subsequently undergo curation prior to their inclusion. Data curation and submission have been designed around a flexible template40, that allows common PGS development and evaluation details and results to be described according to our reporting items, and can be submitted directly to the Catalog for inclusion after validation by curators 41. Authors of PGS studies are encouraged to submit new PGS as well as subsequent PGS validations for indexing (by e-mail to pgs-info{at}ebi.ac.uk), to grow the Catalog for the community, to maximize the utility of their PGS, and to enable reproducibility.
Systematic evaluation of PGS yields comparable performance metrics
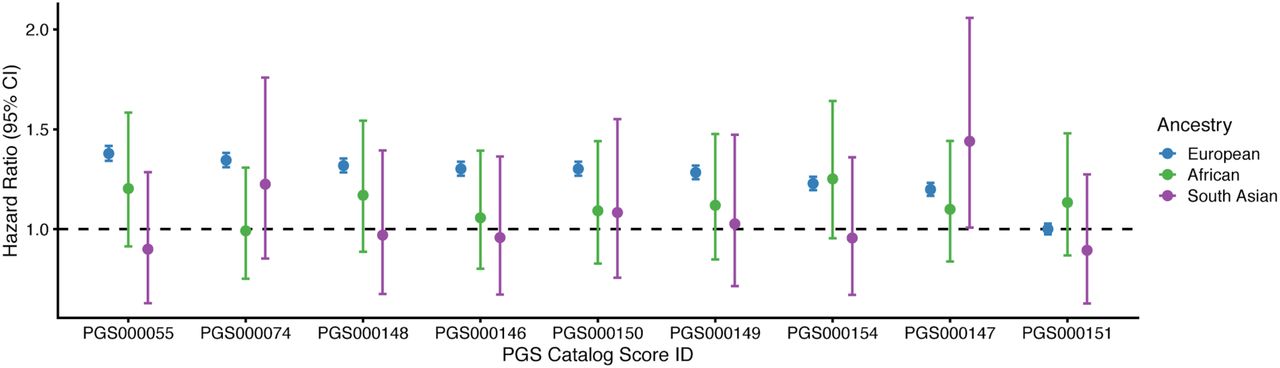
To demonstrate re-use and systematic comparison, we utilised the Catalog to assess the performance of nine PGSs for colorectal cancer in European, South Asian and African ancestries in the UK Biobank (UKB), a dataset external to all scores42 (methods described in Supplemental Note 4, cohort described in Supplemental Table 3). For each ancestry group, each PGS was evaluated using the standardised effect size of the PGS (OR/HR per standard deviation increase of PGS) and changes in classification accuracy (AUROC and C-index) as performance metrics (Figure 2, Supplemental Figure 2). Eight of the nine scores were predictive of colorectal cancer in European ancestries of UKB to varying degrees, and the magnitudes of effect sizes for two of the PGS were similar to that previously reported (Supplemental Figure 2). The score not significantly predictive of colorectal cancer in Europeans (PGS000151) comprised only 14 variants, and its predictive capacity in Europeans had not been previously evaluated. In South Asian and African ancestries of UKB, which combined are ~8% of total UKB individuals, the PGSs were largely not significantly predictive (Supplemental Table 2).

Each PRS was evaluated using a Cox proportional hazards regression model (age-as-timescale) to predict colorectal cancer status. Each model was fitting separately for each ancestry group. Standardised effect size (Hazard Ratio; HR), together with 95% confidence interval (CI), describes the increase in hazard per standard deviation increase of each PGS. Models were adjusted for sex, recruitment country, genotyping array, and the first 10 genetic principal components within each ancestry group.
Conclusions and future developments
The PGS Catalog serves the community as a platform for polygenic score studies. The Catalog makes polygenic scores available for analysis in a standardised format along with consistent metadata, thereby enabling direct comparison between scores. We hope to facilitate reproducible PGS analyses by working with others towards standard formats and content of scoring files, and to provide new tools to support this (e.g. for validation and scoring). For instance, to address a common user request, we will harmonise PGS scoring files to frequently utilised genome builds (GRCh37 and 38). As the database grows, we will leverage the trait ontology to extend search functionality, allowing users to better identify and extract PGSs for any trait of interest.
PGS reproducibility must ensure that calculations are valid and consistent, with minimal variability across users. Based on community need, we intend to provide reference sample calculations and population distributions, similar to those for clinical tests. These enhancements will facilitate systematic and external PGS benchmarking studies, which are key to evaluating the validity of existing PGS.
As PGS increase in number, along with the diversity of phenotypes they predict, we will continue to grow the Catalog, curating new data and simplifying processes for researchers to deposit PGS they have developed and evaluated. We hope that researchers will join us in promoting data-sharing and submitting data so that the PGS Catalog provides a comprehensive resource for the community, enabling reproducibility as well as subsequent applications and translation of PGS.
Conflict of Interest / Competing Interest
John Danesh sits on the International Cardiovascular and Metabolic Advisory Board for Novartis (since 2010); the Steering Committee of UK Biobank (since 2011); the MRC International Advisory Group (ING) member, London (since 2013); the MRC High Throughput Science ‘Omics Panel Member, London (since 2013); the Scientific Advisory Committee for Sanofi (since 2013); the International Cardiovascular and Metabolism Research and Development Portfolio Committee for Novartis; and the Astra Zeneca Genomics Advisory Board (2018).
Supplemental Note 1. PGS Catalog Scoring Files
The PGS Catalog’s Scoring File format is described on our website: https://www.pascataloa.org/downloads/. Each scoring file (variant information, effect alleles/weights) is formatted to be a gzipped tab-delimited text file, labelled by its PGS Catalog Score ID (e.g. PGS000001.txt.gz). We developed the scoring file format to closely resemble existing formats used to calculate scores in common software (e.g. PLINK) so that users could easily apply these scores within existing pipelines.
Scores are extracted from the relevant publication, and a consistent header (lines starting with #) has been added to each file listing relevant information about the PGS with links to the original publication and Catalog identifier:
### PGS CATALOG SCORING FILE - see www.pgscatalog.org/downloads/#dl_ftp for additional information
## POLYGENIC SCORE (PGS) INFORMATION
# PGS ID = PGS identifier, e.g. ‘PGS000001’
# Reported Trait = trait, e.g. ‘Breast Cancer’
# Original Genome Build = Genome build/assembly, e.g. ‘GRCh38’
# Number of Variants = Number of variants listed in the PGS
## SOURCE INFORMATION
# PGP ID = PGS publication identifier, e.g. ‘PGP000001’
# Citation = Information about the publication
rsID chr_name chr_position effect_allele reference_allele…
PGS scoring files are re-formatted to have consistent column headings based on the following schema:
Supplemental Note 2. Inclusion Criteria for the PGS Catalog
For the current PGS Catalog inclusion criteria see: https://www.pgscatalog.org/about/#eligibility. For a publication’s data to be included in the PGS Catalog, it must fulfill the following criteria for either a newly developed polygenic score or an evaluation of an existing score(s):
A newly developed PGS
This includes the following information about the score and its predictive ability (evaluated on samples not used in training):
Variant information necessary to apply the PGS to new samples (variant rsID and/or genomic position, weights/effect sizes, effect allele, genome build).
Information about how the PGS was developed (computational method, variant selection, relevant parameters).
Descriptions of the samples used for training (e.g. discovery of the variant associations [these can usually be extracted directly from the GWAS Catalog using GCST IDs], as well as fitting the PGS) and external evaluation.
Establishment of the PGS’ analytic validity, and a description of its predictive performance (e.g. effect sizes [beta, OR, HR, etc.], classification accuracy, proportion of the variance explained (R2), and/or covariates evaluated in the PGS prediction).
An evaluation of a previously developed PGS
This would include the evaluation of PGS already present in the Catalog (or one that meets the inclusion criteria specified above), on samples not used for PGS training. The requirements for description would be the same as for the evaluation of a new PGS.
Supplemental Note 3. PGS Catalog Data Access and Implementation
Data in the PGS Catalog is provided under EMBL-EBI’s standard terms of use (https://www.ebi.ac.uk/about/terms-of-use/). The data in the Catalog can be currently accessed in the following three ways:
Bulk download of the entire PGS Catalog’s metadata, describing all PGS in terms of their publication source, samples used for development/evaluation, and related performance metrics (details and links: www.pgscatalog.org/downloads/).
The PGS Catalog FTP server (available at: https://ftp.ebi.ac.uk/pub/databases/spot/pgs/) is indexed by Polygenic Score (PGS) ID to allow programmatic access to the Scoring Files and metadata for each PGS, archived versions of the scoring files and metadata are also stored for reference (additional details: www.pgscatalog.org/downloads/).
A REST API is also provided to allow programmatic access and querying of the PGS Catalog, better enabling other applications to be built on top of the resource. Endpoints to retrieve all or individual PGS Catalog data objects (Publications, Scores, Samples, Traits, Performance Metrics) are available (details at: https://www.pgscatalog.org/rest/).
The PGS Catalog is also is indexed on FAIRsharing.org (ref: bsg-d001448), and polygenic score identifiers (e.g. PGS000018) can be externally resolved via IDENTIFIERS.org (ref: pgs). A description of the FAIR indicators for the PGS Catalog are provided in Supplemental Table 1.
Additional bibliographic information for PGS Catalog Publication objects are retrieved from EuropePMC (e.g. title, authors, journal, publication dates)43. Additional information for each ontology term (e.g. synonyms, and mapped terms from other ontologies and disease coding resources [e.g. ICD/READ/SNOMED]) from the EFO 35 are obtained using the EMBL-EBI Ontology Lookup Service (OLS)36.
The PGS Catalog website and database are developed using the Django framework (version 3.0; https://djangoproject.com) in Python (version 3.7; https://www.python.org) with a PostgreSQL database (version 11; https://www.postgresql.org/). The website and database are both deployed on the Google Cloud (https://cloud.google.com/). The codebase for the Catalog can be viewed within our public GitHub repository (https://github.com/PGScatalog), currently provided under an Apache 2.0 License.
Supplemental Note 4. Colorectal cancer benchmarking methods
To evaluate the predictive ability of PGS for colorectal cancer in the Catalog we used data from the UK Biobank (UKB), a cohort of ~500,000 participants from three countries (England, Wales, Scotland) of the United Kingdom42. Our analysis included 421,332 participants with genetic and phenotypic data (Supplemental Table 2), corresponding to 409,253 participants of European ancestry (UKB “White British” subset), 6,086 South Asian ancestry, and 5,984 African ancestry participants. South Asian (self-identifying as: Indian, Pakistani, or Bangladeshi) and African ancestry (self-identifying as: Caribbean, African, or Any other black background) participants were defined using an identical process to the White British participants, using principal components of genetic ancestry to identify a homogenous subset of self-identifying individuals by clustering42.
Diagnosis of colorectal cancer was performed using data linkage to the UK’s national cancer and death registries. Cases of colorectal cancer were identified using previously used ICD codes in UKB 44:
ICD9: 153.0 - 153.9, 154.0, 154.1, 154.8
ICD10: C18.0 - C18.9, C19, C20, C21.8
For each colorectal cancer diagnosis or death we recorded the date and age of the event. colorectal cancer events were defined as the first event of colorectal cancer, and participants were censored after the last cancer registry linkage date (2016-03-31). We excluded 449 participants who had self-reported history of colorectal cancer at recruitment and no linked cancer registry data.
PGS files were downloaded from the PGS Catalog and scores for each participant were calculated using PLINK39. Scores were standardised within each ancestry; the mean and standard deviation for colorectal cancer cases and controls are reported by ancestry group (Supplemental Table 3).
Each score’s predictive ability is measured in terms of classification of cases vs controls, via the standardised effect size of the PGS (OR/HR per standard deviation increase of PGS) and classification accuracy (AUROC and concordance statistic [C-index]). We measured the HR and C-index using a Cox Proportional Hazards model with age-as-timescale, adjusting for sex, genotyping array, country of recruitment, and 10 PCs of genetic ancestry. We measured the OR and AUROC using a logistic regression model adjusting for the sex, age at recruitment, country of recruitment, genotyping array, and 10 PCs of genetic ancestry. The effect sizes are reported with the 95% confidence interval for each PGS (Supplemental Table 3). Statistical analyses were performed in python: the Cox model was implemented using the lifelines package45, and logistic regression was performed using the statsmodels package46.
Supplemental Figure

(A) Example of how each Publication and its related metadata (links to publication, EuropePMC, and PGS that were developed and evaluated within the paper) are displayed on PGSCatalog.org (example publication PGP0000712). (B) Example of how each Trait (ontology term, description, synonyms, and mapped terms [e.g. ICD/SNOMED] extracted from EFO35,36) and its related metadata (PGS that have predicted the current trait, and subsequent evaluation of those scores) are displayed on PGSCatalog.org (example trait: colorectal cancer, EFO_0005842). Sections of each webpage are highlighted with coloured bars corresponding to the data objects they display in Figure 1A.

Each PRS was evaluated within a logistic regression model for predicting colorectal cancer status for participants in UKB (A-B), and a separate Cox proportional hazards regression model (age-as-timescale) (Figure 2, C). (A) Standardised effect size (Odds Ratio; OR) describing the odds of having colorectal cancer per unit increase in each PGS. Previously reported effect sizes that were recorded in the Catalog are also plotted for PGS000074 and PGS000146. (B) Change in model classification accuracy (Area Under the Reciever Operating Characteristic Curve; AUROC) when the PGS is added to a logistic regression model including the existing covariates (age at recruitment, sex, recruitment country, genotyping array, and 10 PCs of genetic ancestry). (C) Change in model classification accuracy (concordance statistic; C-index) when the PGS is added to a risk model including the existing covariates (sex, recruitment country, genotyping array, and 10 principal components [PCs] of genetic ancestry).
Supplemental Tables
This table describes details of how the current PGS Catalog conforms to FAIR data principles. For the purposes of this table the Score constitutes the data (e.g. variants, effect weights and alleles), and is linked to metadata (Samples, Performance Metrics, Publications) describing it.
This table describes the reporting items that can be captured for each of the data objects in the PGS Catalog.
Cohort age and sex demographics broken down by colorectal cancer case/control status and participant ancestry. The distribution (mean and standard deviation [SD]) of each standardised PGS in colorectal cancer cases is also given, along with its effect size (Hazard Ratio; HR), citation and number of variants included in the PGS; the distribution of each PGS in controls is zero-mean and unit-variance.
Acknowledgments
We wish to thank all the authors of publications in the PGS Catalog for making their data available and indexable in our database, and wish to thank all those who responded to our inquiries and requests for data. This work makes use of UK Biobank Project #7439.This work was supported by core funding from: the UK Medical Research Council (MR/L003120/1), the British Heart Foundation (RG/13/13/30194;RG/18/13/33946) and the National Institute for Health Research [Cambridge Biomedical Research Centre at the Cambridge University Hospitals NHS Foundation Trust] [*]. This work was also supported by Health Data Research UK, which is funded by the UK Medical Research Council, Engineering and Physical Sciences Research Council, Economic and Social Research Council, Department of Health and Social Care (England), Chief Scientist Office of the Scottish Government Health and Social Care Directorates, Health and Social Care Research and Development Division (Welsh Government), Public Health Agency (Northern Ireland), British Heart Foundation and Wellcome. MI was supported by the Munz Chair of Cardiovascular Prediction and Prevention. This study was supported by the Victorian Government’s Operational Infrastructure Support (OIS) program. Research reported in this publication was supported by the National Human Genome Research Institute of the National Institutes of Health under Award Number U41HG007823. The content is solely the responsibility of the authors and does not necessarily represent the official views of the National Institutes of Health. In addition, we acknowledge funding from the European Molecular Biology Laboratory. JD holds a British Heart Foundation Chair and is funded by the National Institute for Health Research [Senior Investigator Award] [*]. MI and SR are supported by the National Institute for Health Research [Cambridge Biomedical Research Centre at the Cambridge University Hospitals NHS Foundation Trust].
*The views expressed are those of the authors and not necessarily those of the NHS, the NIHR or the Department of Health and Social Care.
References


