
Abstract
Background Preliminary evidence has shown wide inequities in COVID-19 related deaths in the US. We explored the emergence of spatial inequities in COVID-19 testing, positivity, and incidence in New York City, Philadelphia, and Chicago.
Methods We used zip code-level data on cumulative tests and confirmed cases by date for each city and computed testing, positivity, and incidence indicators. We linked these to 2014-2018 American Community Survey data on income, education, race/ethnicity, occupation, health insurance, and overcrowding, and computed a summary index. We computed associations between using Poisson models. We also examined clusters of high and low incidence using the G* statistic.
Results Through May 18th, there were wide inequities in positivity and incidence, with less advantaged neighborhoods having a higher incidence (RR=1.36 [95% CrI 1.18;1.57], 1.17 [1.11;1.23], and 1.10 [0.98;1.23], per 1 SD increase in the summary index in Chicago, NYC and Philadelphia, respectively). In all three cities inequities in incidence increased as the pandemic advanced, while inequities in positivity remained stable. In contrast the social patterning of testing changed over time: testing was inversely associated with disadvantage early in the pandemic but was either not associated or positively associated with disadvantage later in the pandemic. We also found clusters of high and low incidence, co-located with areas of high and low disadvantage.
Conclusions We found wide spatial inequities in COVID-19 positivity and incidence in three large metropolitan areas of the US. In health crises health inequities become magnified and reflect a longstanding history of racial and economic injustice.
Introduction
As of May 26th, 2020, the COVID-19 pandemic had taken the lives of more than 340,000 people worldwide, while in the US deaths are approaching 100,0001. Cities across the globe have emerged as especially vulnerable to COVID-19 and as locations where social and spatial inequities in COVID-19 incidence and mortality are quickly emerging. For example, there is a much higher incidence rate of COVID-19 in the poor compared to the wealthier neighborhoods of Barcelona, one of the most affected cities in Spain2. Reports from lower- and middle- income countries are also revealing higher COVID rates in informal settlements within cities3.
Preliminary research has shown very wide inequities in COVID-19 incidence and mortality in the US. Around 20% of US counties have a majority Black population, and they account for more than half of all COVID-19 cases4. In states reporting data by race/ethnicity, Black Americans are only 13% of the population but represent 27% of the COVID-19 related deaths.5 These inequities are especially worrisome in some US cities with very high incidence. In New York City, both Blacks and Latinxs have double the mortality rate as compared to whites after age-adjustment6, in Chicago 50% of deaths have occurred in Blacks, who make only 30% of the population7, while in Milwaukee Blacks account for 69% of deaths while accounting for only 27% of the population8.
Characterizing social and spatial inequities in cities is critical to understanding the racial inequities that have emerged and developing appropriate interventions and policies to prevent COVID-19 deaths in the future. Yet it is rendered complex during an evolving pandemic because of the interrelated nature of access to testing and diagnosis and because the social patterning of the pandemic is likely to change as it advances through the population. We used data from three large US cities to (1) characterize spatial and social inequities in testing, positivity, and incidence and (2) examine how the social patterning has evolved in different cities as the pandemic progressed through them.
Methods
Setting
We used data on cumulative total numbers of tests and confirmed cases by zip code of residence from Chicago, New York City (NYC), and Philadelphia. For Chicago, we downloaded data compiled by the Illinois Department of Public Health9 and made available by the Chicago Observer10, and obtained daily cumulative data from April 18th through May 18th for the entire state of Illinois, and restricted the data to zip codes that intersected with the city of Chicago. We followed a similar approach for New York City, where we downloaded daily cumulative data compiled by the NYC Department of Health and Mental Hygiene in their GitHub repository11 from April 1st through May 18th. For Philadelphia, we downloaded data from the Philadelphia Department of Public Health12 on April 24th, including all tests and confirmed cases prior to that date, by zip code and result date. We then calculated cumulative number of confirmed cases and total tests by zip code and date from March 21st through April 23rd. From thereon we followed an approach similar to the other three cities, and downloaded daily cumulative number of total tests and confirmed cases by zip code12.
Predictors
We linked zip code data to the 2014-2018 American Community Survey. We obtained data on variables that we hypothesized could be linked to differential exposure to SARS-COV-2 or to differential testing practices. Specifically, we calculated six variables reflecting income (median household income [log]), race/ethnicity (% non-Hispanic White), education (% with college education), occupation (% working in service jobs [food preparation and serving, personal care, and other service occupations]), health insurance status (% uninsured), and housing (% overcrowded households [>1 person per room]). To provide a summary of all six variables, we calculated extracted the first component from a principal component analysis (PCA) with all six variables (Appendix Table 1 shows the loadings for each variable and city). Median household income, % non-Hispanic White, and % college education loaded negatively on this index, while % working in service jobs, % uninsured, and % overcrowded households loaded positively. Therefore, a higher value in this summary index represents a higher concentration of relative disadvantage, while a lower value represents a higher concentration of relative advantage.
Outcomes
As the main outcomes, we computed three indicators that reflect different testing practices and infection burden: (1) testing per capita (total tests/population); (2) positivity rate13 (confirmed cases/total tests); and (3) incidence (confirmed cases/population).
Analysis
We conducted our analysis in three steps. First, we conducted a graphical assessment of correlations between each of the seven variables (six predictors and the summary index) and the three outcomes (testing, positivity, and incidence).
Second, similar to other work14, we estimated the strength of the associations between each predictor and outcome using a Poisson model. To make coefficients comparable, we standardized all predictors by subtracting the mean and dividing over the standard deviation (SD) for each city. To account for spatial autocorrelation of the outcomes, we fitted a conditional autoregressive generalized linear mixed model. The resulting coefficients and standard errors can be used to estimate rate ratios of testing, positivity and incidence (and 95% credible intervals) per 1 SD increase in each predictor. Third, to explore temporal trends in inequities, we repeated the second step for every date from April 1st through May 18th, 2020 and plotted rate ratios for each outcome cumulative through each date associated with a one SD higher summary index, separately for each city.
Fourth, to show spatial patterns in the outcomes we mapped zip code-level outcomes and the summary index for each city, for the last available date (May 18th, 2020). To show clusters of high and low incidence, testing, positivity, and disadvantage, we computed the G* star statistic, and show clusters of high or low levels with a Bonferroni-adjusted p-value of p<0.05.
AN analyses were conducted using R v4.0. Code for replication is available at: https://github.com/usamabilal/COVID_Disparities
Results
We included a total of 177, 84, and 46 zip codes in NYC, Chicago and Philadelphia, respectively. For NYC, we had cumulative testing data for 44 days from April 1st through May 18th; for Chicago we had cumulative testing data for 30 days from April 18th through May 18th; for Philadelphia we had cumulative testing data for 54 days, from March 21st through May 18th.
Cumulative data through May 18th, 2020, showed that COVID-19 testing outcomes were not correlated with zip code-level socioeconomic variables (Figure 1, Appendix Figures 1-4). In Chicago, NYC and Philadelphia, a 1 SD higher zip code-level summary index was not associated with higher testing rates (RR=0.99, 95% CrI 0.91 to 1.08, RR=1.01, 95% CrI 0.98 to 1.06, RR=0.95, 95% CrI 0.87 to 1.03, for Chicago, NYC, and Philadelphia respectively) (Table 1).
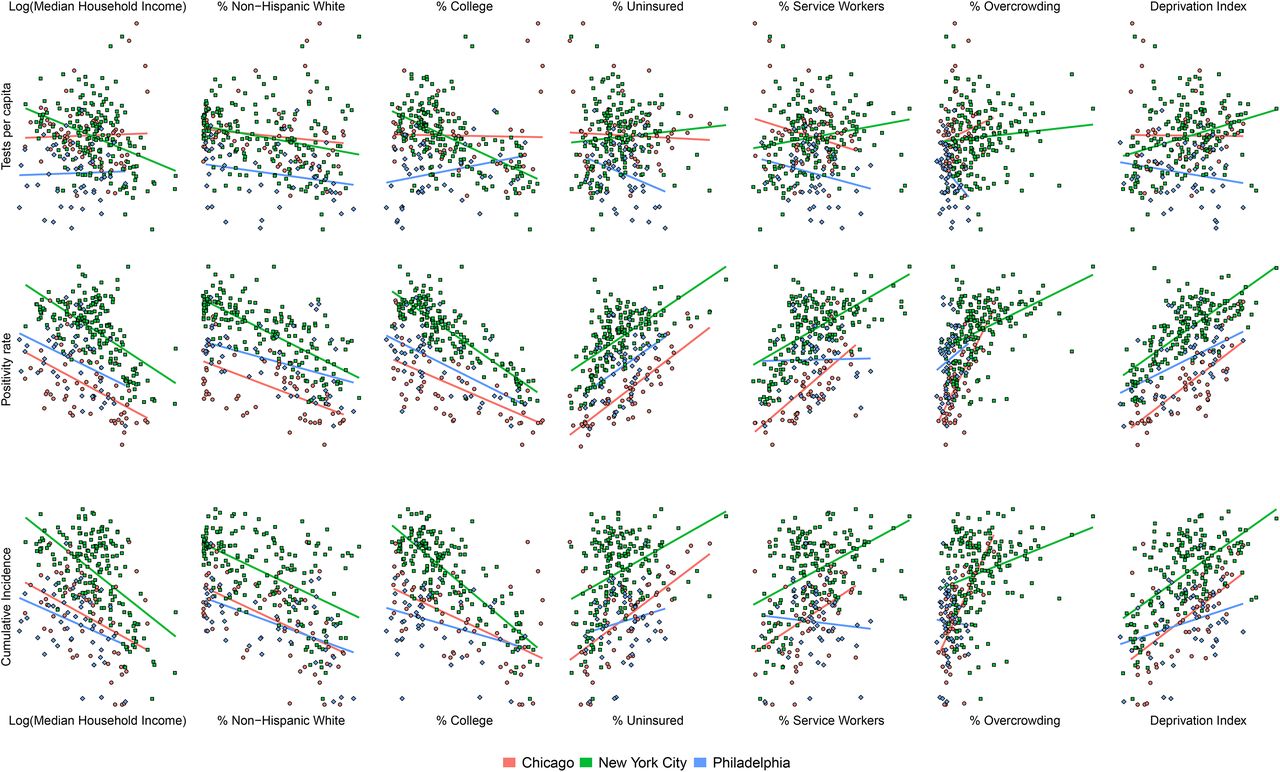
Scatterplots showing the relation between six socioeconomic variables and three COVID-19 testing outcomes at the zip code level in Chicago, NYC, and Philadelphia. Data is cumulative up to May 18th, 2020.
Footnote: solid lines are linear fits of outcome on predictor, for each city separately
Relative rates of cumulative testing, positivity and incidence associated with zip code socioeconomic characteristics in Chicago, NYC and Philadelphia, using cumulative data up to May 18th, 2020.
We found strong inequities in positivity rates and incidence for the three cities by May 18th. A higher zip code-level median household income, % college educated, and % non-Hispanic white, and a lower % uninsured, % service workers, and % overcrowding, were all associated with a higher positivity rate for all three cities. Specifically, a 1 SD higher zip code-level summary index was associated with a 33%, 13%, and 14% higher positivity rate and a 36%, 17%, and 10% higher incidence in Chicago, NYC and Philadelphia, respectively (Table 1).
These inequities were dynamic and evolved over time (Figure 2). Cumulatively through April 1, New York had a weak inequity in incidence and testing, and a strong inequity in positivity rates, whereby higher value of the summary index was associated with higher incidence and positivity but lower testing. As the pandemic evolved and testing became more widespread, the inequity in testing was reversed, so that by late April cumulative testing per capita was higher in less advantaged neighborhoods. Given that the inequity in positivity rate stayed constant over time, the inequity in incidence became stronger. Chicago followed a similar pattern, with a reversal of the inequity in testing, a stable inequity in the positivity rate, and a strengthening of the inequity in incidence.

Trends in association between zip-code disadvantage and COVID-19 testing outcomes by city
Footnote: rate ratios (and 95% credible intervals) for each outcome associated with a 1 SD increase in the summary index
While Philadelphia followed similar trends to the other cities, data availability in Philadelphia allowed us to explore the inequities earlier in the epidemic. Specifically, during all of April in Philadelphia there was a strong inequity in testing, with less advantaged zip codes receiving a much lower amount of testing (RR=0.79, 95% CrI 0.72 to 0.87 by April 1st) (Figure 2). However, this association changed over time, and by May 18th the inequity in testing was very weak or non-existent (RR=0.94, 95% CrI 0.87 to 1.02). Although the inequity in each city differed over time, we found that inequities in testing and incidence were similar in NYC and Philadelphia when dates were matched based on the levels of cumulative incidence at the city level, while they were stronger overall for Chicago at any given time (Appendix Figure 5).
There was a clear spatial pattern of incidence on May 18th, and this pattern strongly follows the spatial patterning of advantage, especially in New York City and Chicago (Figure 3). There are clusters of high and low incidence in the three cities (Figure 4). In Chicago, there is a large cluster of high incidence in the West and Southwest side of the city, and a cluster of low incidence in the North side and Central parts of the city (Figure 4, Panel A). In New York, there is a cluster of low incidence in most of Manhattan and parts of Brooklyn, while there are several clusters of high incidence in most of the Bronx and Staten Island, and parts of Brooklyn and Queens (Figure 4, Panel B). In Philadelphia, there was a cluster of low incidence in most of Center City and other areas along the Delaware river, while there were clusters of high incidence in West, North and Northeast Philadelphia (Figure 4, Panel C). Appendix Figures 6-8 show the spatial clustering of positivity rates, testing, and disadvantage.
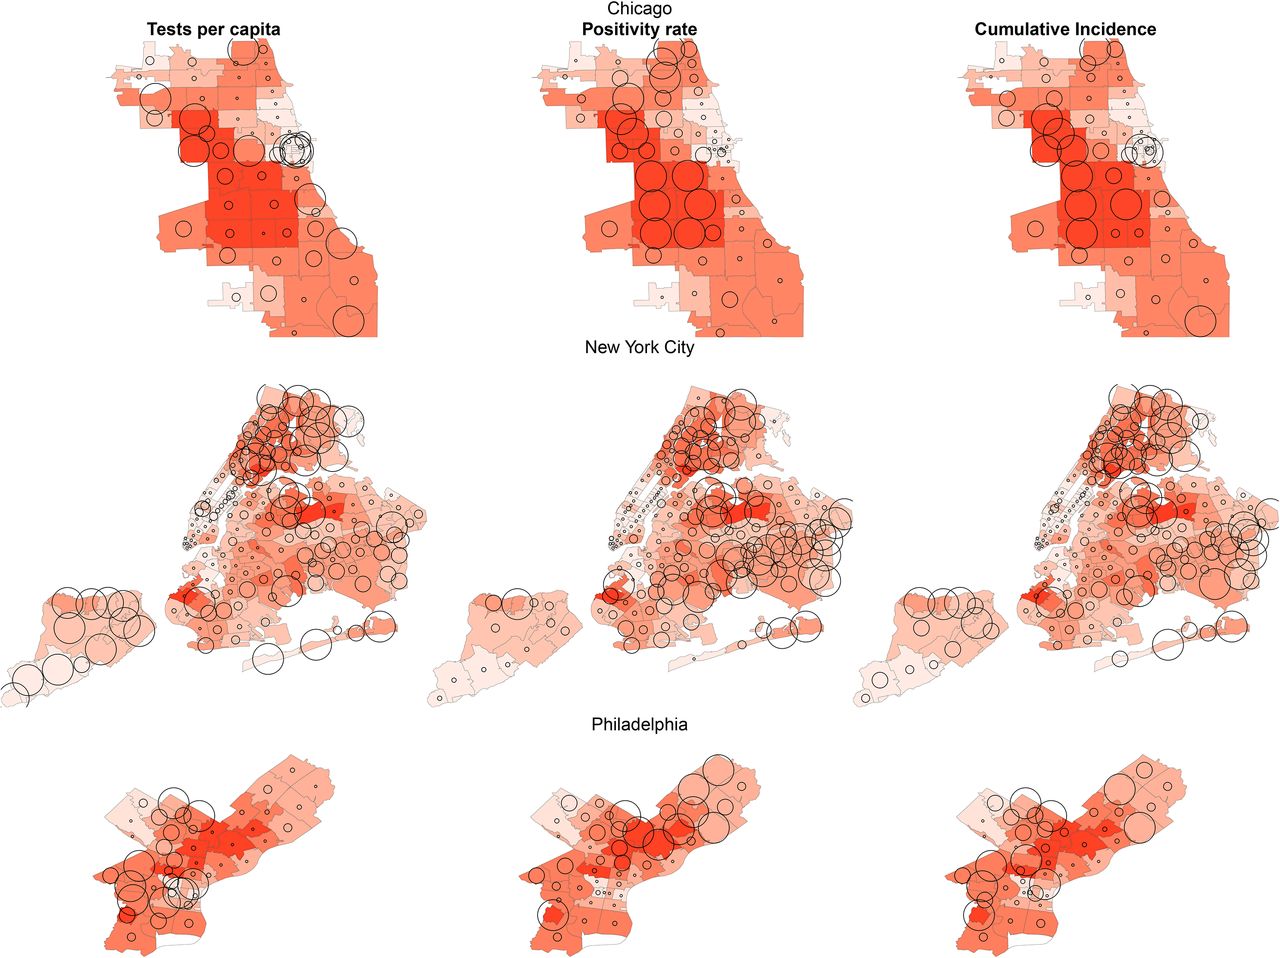
Spatial distribution of disadvantage and COVID-19 incidence in Chicago, New York City and Philadelphia
Footnote: testing, positivity rate, and incidence are proportional to circle area

spatial clusters of low and high incidence
Footnote: clusters calculated using the G* statistic, with a Bonferroni-adjusted threshold of p<0.05% College
Discussion
We documented large spatial inequities in COVID-19 outcomes through May 18 in three large US cities with more deprived neighborhoods having a higher incidence and positivity rates. These inequities were strongest in Chicago and similar in New York City and Philadelphia. We also found clusters of high and low incidence, co-located with areas of low and high advantage, respectively. In all three cities, inequities in incidence increased as the pandemic advanced, while inequities in positivity rates remained stable. In contrast the social patterning of testing changed over time: testing was more common in more advantage neighborhoods early in the pandemic, while it became more common in less advantaged neighborhoods later in the pandemic.
Potential explanations for inequities in incidence include a differential exposure to the virus and a differential susceptibility to infection due to a longstanding history of structural racism and residential segregation15-17. Differential exposures could emerge from occupation, such as healthcare18, personal care or service occupations19, lack of telecommuting options20, mass transit use21, and overcrowding within households22. Utility disruptions leading to a lack of access to running water can also introduce barriers to hand washing in cities like Detroit23. Whether there are factors associated with differential susceptibility to infection is still unclear, but prior research on respiratory viruses has documented that stress linked to disadvantage may increase the likelihood of developing disease after exposure24,25.
We found inequities in testing at the beginning stages of the epidemic by which deprived neighborhoods had less per capita testing, although these inequities were reduced as the epidemic progressed. This change in the social patterning of testing was most pronounced in Philadelphia, for which data earlier in the pandemic was available. Barriers to testing when resources are constrained can include unequal location of testing sites26, lack of vehicle ownership27, lack of health insurance28, a usual source of care for referrals29, and potential mistrust of the medical system30.
We also found clusters of high and low incidence that were mostly co-located with clusters of high and low disadvantage, respectively. These include areas of concentrated poverty and with a history of extreme racial segregation and discrimination, including West and North Philadelphia, the West Side of Chicago, and The Bronx in NYC.
The consequences of these inequities in infection rates are reflected in preliminary reports of wide inequities in deaths due to COVID-19. Vulnerability to severe disease and death by COVID-19 are related to the presence of previous comorbidities, such as cardiovascular disease, diabetes and hypertension31. Since these comorbidities are more prevalent in people of lower socioeconomic status and racial/ethnic minorities32,33, it is expected that, at equal levels of exposure, these groups will suffer more severe consequences from COVID-19. However other factors may also affect the severity of disease and the case-fatality rates including access to and quality of health care and the role of other factors including co-occurring social factors (e.g. stressors) and environmental factors (e.g. air pollution). In fact, a study with 17 million records in the UK has shown that, even after adjusting for a number of comorbidities, racial/ethnic minorities and people living in socioeconomically deprived areas had a higher risk of death after infection31.
We also found that inequities in incidence became stronger over time. It is possible that the social patterning of infection has been changing over time as the pandemic progressed, beginning in wealthier areas (possibly linked to business travel34) and subsequently shifting to more deprived areas. The greater testing in less deprived areas in all three cities early in the epidemic could in part reflect this, given that testing was initially strongly linked to symptoms. However, the strong association of positivity with disadvantage even early in the pandemic suggest that access to testing was, at least initially, lower in more deprived areas. As a result, incidence rates in more deprived neighborhoods early in the pandemic could be underestimated.
An important limitation of our study is the likely underestimation of inequities in incidence due to the lack of systematic widespread testing. In addition, zip codes are very imperfect proxies for neighborhoods. Heterogeneity in the sociodemographic composition within zip codes likely led to underestimation of inequities in our analyses, leading to a lower power to detect associations and spatial clusters. However, zip codes they represent easy-to-collect data in the middle of a public health emergency when more detailed geocoding is less available.
Conclusion
We found wide spatial inequities in COVID-19 outcomes in three large metropolitan areas of the US. Communities of color and of low socioeconomic status have long borne the burden of adverse health linked to discrimination, structural racism, xenophobia and systematic disinvestment leading to a lack of material resources. In health crises, such as this one, all these social problems become magnified, reflecting a longstanding history of racial and economic injustice.
Funding
UB was supported by the Office of the Director of the National Institutes of Health under award number DP5OD26429. The funding sources had no role in the analysis, writing or decision to submit the manuscript.
Conflicts of interest
The authors declare no conflict of interest.
Acknowledgements
The authors want to acknowledge help by Alyssa Furukawa on data collection, Ran Li on designing some of the visualizations, and Dr. Rene Najera for useful code to calculate spatial clustering.


