
Abstract and Findings
In our previous work, we analyze, in near-real time, evolution of Covid-19 epidemic in China for the first 22 days of reliable data (up to February 6, 2020). In this work, we used the data for the whole 87 days (up to March 13, 2020) in China and the US data available till March 31 (day 70) for systematic evaluation of the logistic model to predict epidemic growth. We sequentially estimated sets of model parameters (maximum number of cases K, growth rate r, and half-time t0) and the epidemic “end time” t95 (defined as the time when the number of cases, predicted or actual, reached 95% of the maximum). The estimates of these parameters were done for sequences of reported cases growing daily (back-casting for China and forecasting for the US). In both countries, the estimates of K grew very much in time during the exponential and nearly exponential phases making longer term forecasting not reliable. For the US, the current estimate of the maximum number of cases K is about 265,000 but it is very likely that it will grow in the future. However, running estimates of the “end time” t95 were in a much smaller interval for China (60 – 70 days vs. the actual value of 67). For the US, the values estimated from the data sequences going back two weeks from now range from 70 to 80 days. If the behavior of the US epidemic is similar to the previous Chinese development, the number of reported cases could reach a maximum around April 10 to 14.
Introduction
In our previous recent work (Hermanowicz 2020), we used a simple logistic model to analyze the evolution of data on Covid-19 cases as reported in mainland China by the National Health Commission of the People’s Republic of China (NHC 2020). This initial analysis was done in three phases in near-real time (up to Jan. 30, Feb. 3, and Feb 6). The analysis resulted in a sequence of continually updated forecasts of the epidemic dynamics. Although the predicted maximum numbers of cases increased as new data became available, they systematically underestimated final reported numbers (even without accounting for a major change in reporting criteria in China on February 12 resulting in a large surge of new reported cases). However, the successive predicted dynamics of the epidemic were remarkably close to the final real-world outcome. We explore this issue further in this work where we use the full reported dataset for mainland China for systematic back-casting of the epidemic.
At the same time, when this work is being conducted, in the US we are experiencing a fast developing Covid-19 epidemic that in some aspects is similar to China but with a delay. We use the experience from our analysis of the situation in China to forecast further evolution of coronavirus cases in the United States. Obviously, our predictions are based on the data currently available. These predictions do not account for any possible other secondary sources of infection, changes of diagnostics or reporting, or virus mutation.
Modelling the epidemics and infection dynamics is very important and numerous results have been recently reported for worldwide Covid-19 outbreak (Chen, Rui et al. 2020, Chen, Cheng et al. 2020, Hong, He et al. 2020, Hui, Azhar et al. 2020, Imai, Cori et al. 2020, Imai, Dorigatti et al. 2020, Li, Guan et al. 2020, Linton, Kobayashi et al. 2020, Liu, Hu et al. 2020, Liu, Hewings et al. 2020, Roosa, Lee et al. 2020, Shen, Peng et al. 2020, Wu, Leung et al. 2020, Zhang and Wang 2020, Zhao, Lin et al. 2020, Zhou, Hong et al. 2020, Ziff and Ziff 2020). Many reported models are complicated, incorporate tentative assumptions and need parameters estimates that are not reliable as underscored by Fong and coworkers (Fong, Li et al. 2020).
In this work, we present the results of fitting a very simple logistic model to the available data and a forecast of new infections. In contrast to other models, the logistic model does not include any external assumptions and is derived completely from available data.
Logistic Model and its Application
The logistic model is one of the simplest used in population dynamics and has been used specifically for epidemics for a long time (Bailey 1950, Cockburn 1960, Mansfield and Hensley 1960, Jowett, Browning et al. 1974, Waggoner and Aylor 2000, Koopman 2004, Bangert, Molyneux et al. 2017). In our earlier analysis of the developing epidemic in China, we used a discrete version of the model due to its uncomplicated structure and easy calculations.
In discrete time, more appropriate to daily reported infection cases, the logistic model becomes
 where P(t) and P(t+1) are populations (cases) on consecutive days, R0* is the growth rate (basic reproduction number in epidemiology) at the beginning of the logistic growth, and K is the limiting population (maximum cases).
However, expressing the growth of population P in continuous time t allows to formulate the model as an ordinary first-order differential equation describing dynamic evolution of the population P (in our case the number of infected individuals) being controlled by the growth rate r and maximum cases K due to limited growth. In continuous time t, the change of P is

Initially, the growth of P is close to exponential since the term (1− P/K)is almost one. When P becomes larger (commensurate with K) the growth rate slows down with
 becoming an effective instantaneous growth rate.
The solution to Eq. (2) is the well-known sigmoidal function (logistic function)
 where t0 is the time when the population reaches one-half of the maximum value P(t0) = 1/2 K. Using a differential version of the model is more convenient since a closed-form solution exists and allows for direct estimation of three model parameters: K, r, and t0. The logistic model may be adequate for the analysis of mainland China and the US as a whole since at this time each country can be treated as a unit where a vast majority of cases occurred without any significant “import” or “export” of cases.
Data Analysis
For China, we used data reported daily by the National Health Commission of the People’s Republic of China (NHC 2020) up to March 13, 2020 (day 87 from the outbreak) when only 11 new cases were reported – less than 2·10−4 of total case number, effectively ending the epidemic on the national level. There is a considerable controversy as to the exact date of the outbreak with most reports pointing to mid-December (Li, Guan et al. 2020, Wang, Horby et al. 2020) while one analysis suggest multiple sources of original infection (Nishiura, Jung et al. 2020). Initially, the outbreak was not recognized and number of confirmed cases is not fully known (Wu, Hao et al. 2020). In our analysis, we adopted December 17, 2019 as the best estimate of the outbreak following the work of Zhang and co-workers (Zhang and Wang 2020, Zhang and Wang 2020). In addition, in the initial stages of the epidemic the reported numbers of cases may severely underestimate the actual numbers due to asymptomatic carriers (Zhao, Musa et al. 2020). More accurate numbers can be only estimated after the epidemic (Wu and McGoogan 2020).
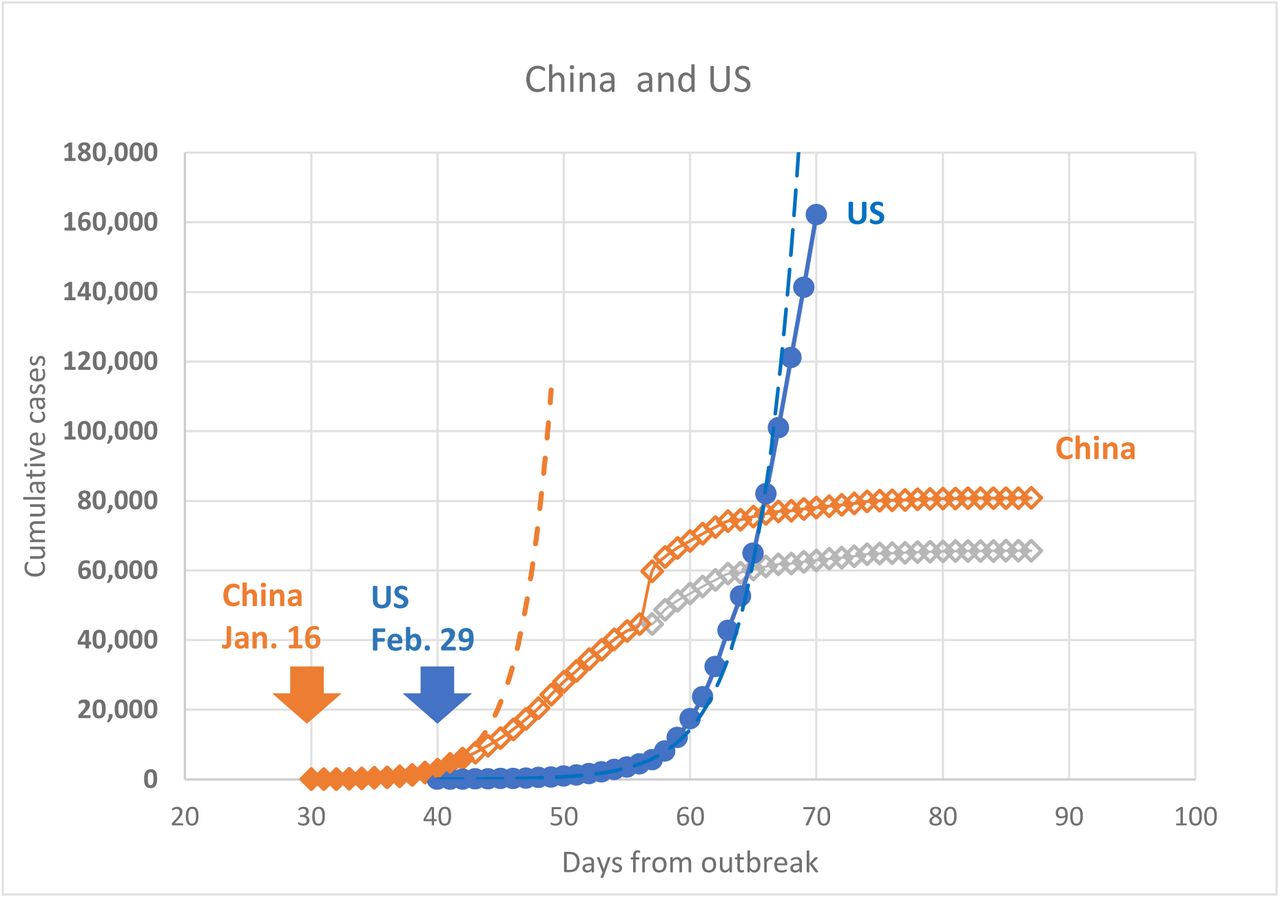
The data from China are show in Figure 1 and in the Appendix. As seen in this figure, the cumulative number of cases grew in a sigmoidal fashion. On February 12, 2020 (day 57) the reporting criteria were changed resulting in a one-day increase of about 15,000 cases. We analyzed the subsequent data with this jump and also ignoring it. The logistic model turned out to be quite robust. While the numerical estimates of the maximum number of cases K was significantly affected by the inclusion or exclusion the jump, the dynamics of the model was much less impacted (see further discussion). In this work, we decided to report the results with the jump as parsing data of new and cumulative cases past day 57 is very unreliable.

Evolution of reported cases in China and the US. (Solid points show data used to fit exponential functions – dashed lines)
In the US, there are numerous agencies tracking the Covid-19 cases at different administrative levels in accordance with multi-tiered structure of the US government. For this reason, we relied on web-based data aggregators (mostly at state level) following daily updates (Covid-19 2020).
We used January 21, 2020 as the start of the epidemic in the US (day 1) since on that day the first non-repatriated Covid-19 case was reported. It should be noted that like in China the number of cases in the initial stages is underreported due to the same factors (asymptomatic carriers, initial administrative confusion, limited testing). Despite these problems, the data used in this work are the best currently available. The current evolution of the epidemic in the US is presented in Figure 1 and in the Appendix. Despite smaller population, the number of cases in the US at the time of writing already exceeds that of China. Reasons for such higher numbers are outside the scope of this analysis.
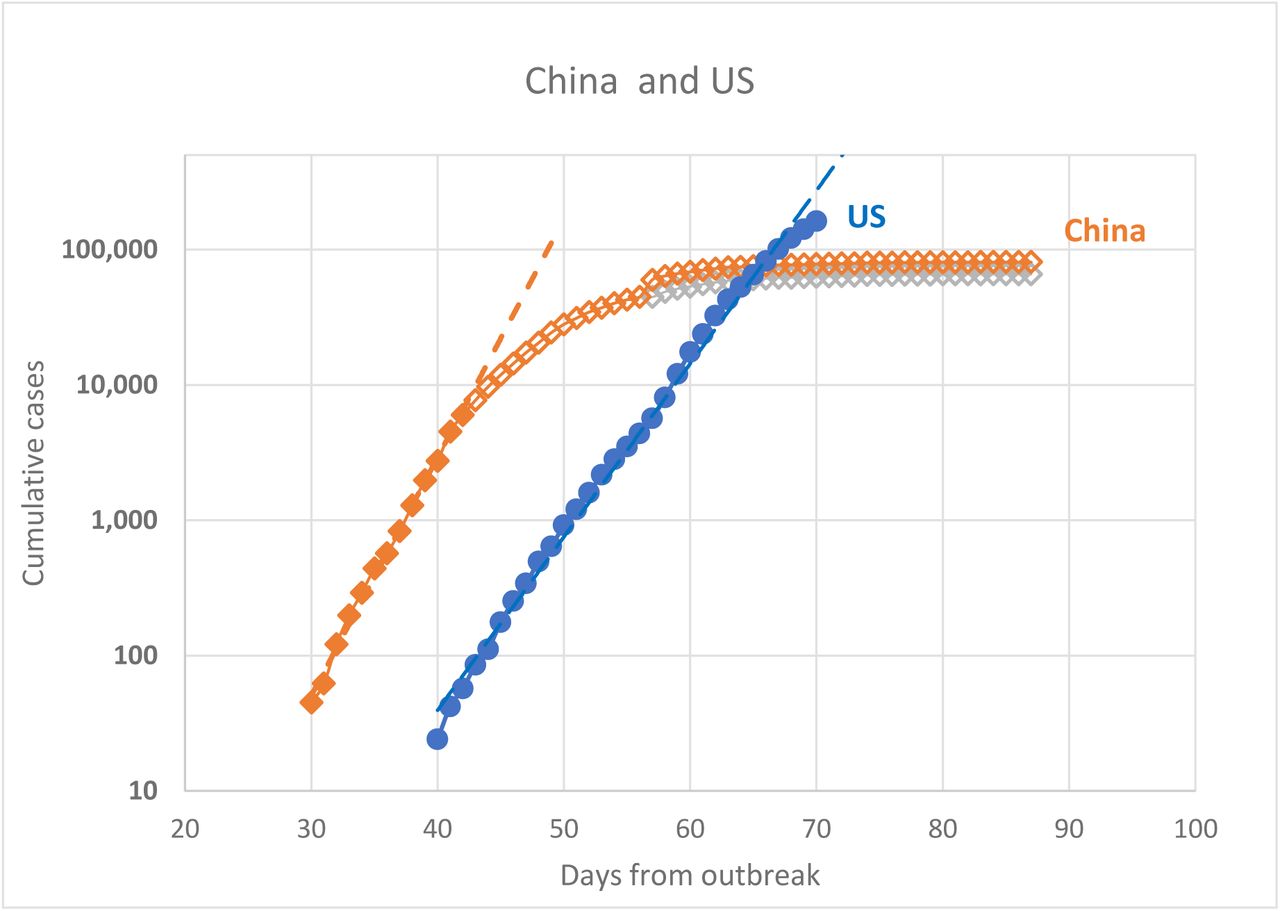
Both, China and the US data are also plotted in the semi-log format (??) to underscore exponential growth of the epidemic in the initial stages – straight line on these plots. In China, exponential growth occurred from day 30 till day 42 as shown in ?? and ?? by the dashed lines. After day 42 (January 28), the number of cases still increased but the rate of growth was becoming lower and the line representing the cumulative cases deviated from the exponential curve. This feature was also clearly recognized in a previous report (Zhao, Lin et al. 2020).
In the US, exponential growth occurred for a longer period and only very recently (March 27 – 30) perhaps starts to deviate from the exponential curve.
Model Estimates and Results
For each dataset of reported cumulative case numbers (China and the US), we estimated three parameters of the logistic model (maximum case number K, growth rate r, half-time t0) fitting model predictions to the data. We use a custom nonlinear curve fitting procedure employing the Levenberg-Marquardt method for minimization of the residual sum of squares. Similarly to our previous work (Hermanowicz 2020), we estimated model parameters sequentially from datasets growing day after day.
For China, the first dataset contained 5 days from day 38 through 42. The next estimate used 6 days from day 38 through 43. This process was repeated until day 87 when the entire China dataset was used. For the US, the first dataset contained also 5 days from day 43 through 47. The last day of the available sequence for the US was day 70 (March 30, 2020). All resulting estimates are show in the Appendix.
In case of China, where the epidemic growth has essentially ended, the sequential estimation process (back-casting) simulated near-real time analysis of the dynamics. In the US, where we are still in the substantial growth phase, the sequential estimates are indeed performed in near-real time. In addition to three model parameters, for each day we also estimated predicted time for the epidemic to end. For this purpose. we chose arbitrarily time when the predicted number of cases reach 95% of the predicted maximum K. This time, t95 was calculated from Eq. (4) by setting P(t) = 0.95 K and is also shown in the Appendix.
China
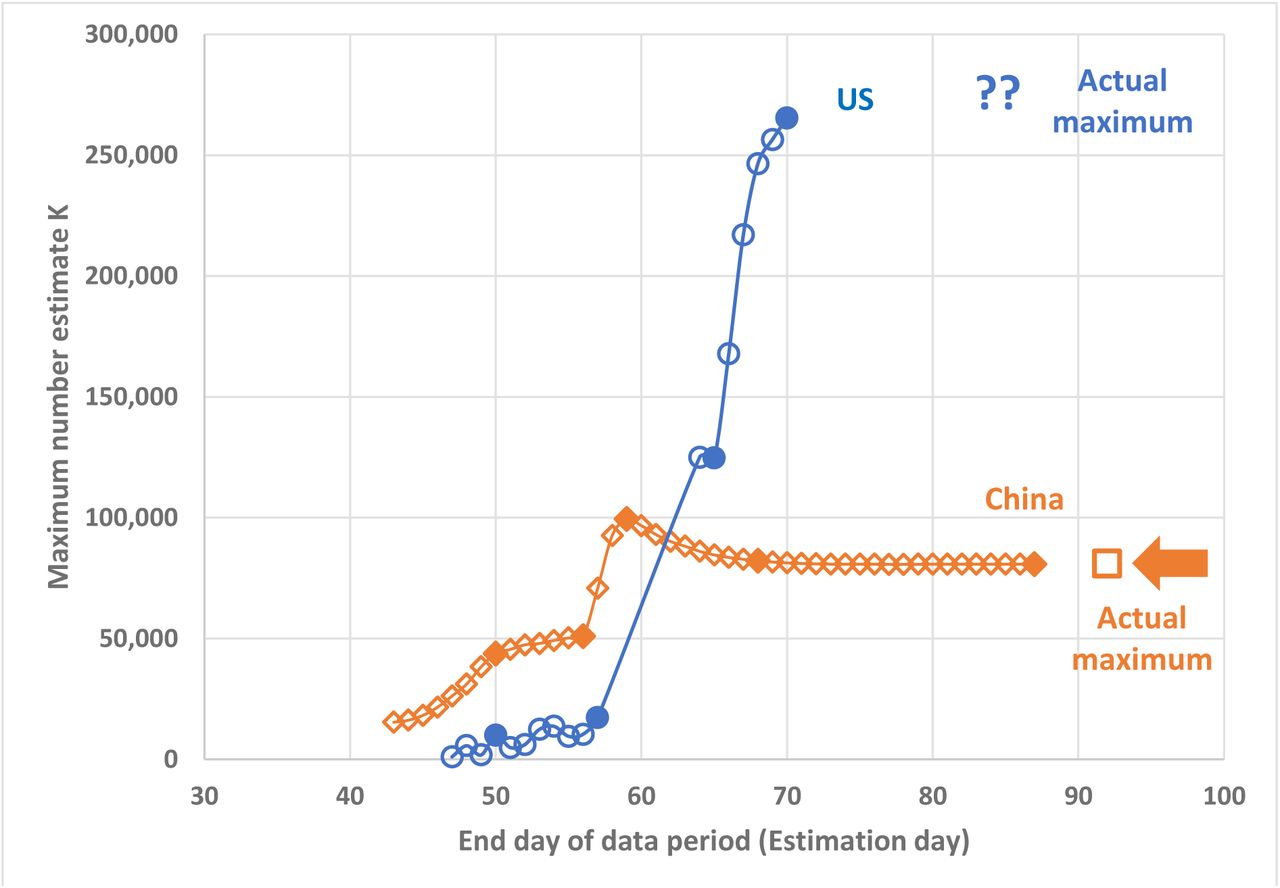
Figure 3 shows the development of sequential estimates of the maximum predicted cases K for China and Figure 4 presents the corresponding “ending times” t95. As reported earlier (Hermanowicz 2020) for actual near-real time analysis, estimates of predicted maximum cases K depended very heavily on the length of the dataset used for estimation. As examples, Figure 5 shows a few logistic curves corresponding to selected model parameter estimates on specific days for China. As seen in this figure, the initial estimates (close to the exponential phase) were below 20,000 but they grew to about 100,000 as more data became available and was used for estimate refinement. Obviously, the estimate of K obtained from the full dataset (up to day 87) matches closely the actual reported number of cases (80,780 vs. 80,807) but it should be noted that the estimates of K from day 65 (more than 20 days in advance) converged very closely to the actual maximum.

Exponential growth of epidemics (see Figure 1 for notes)


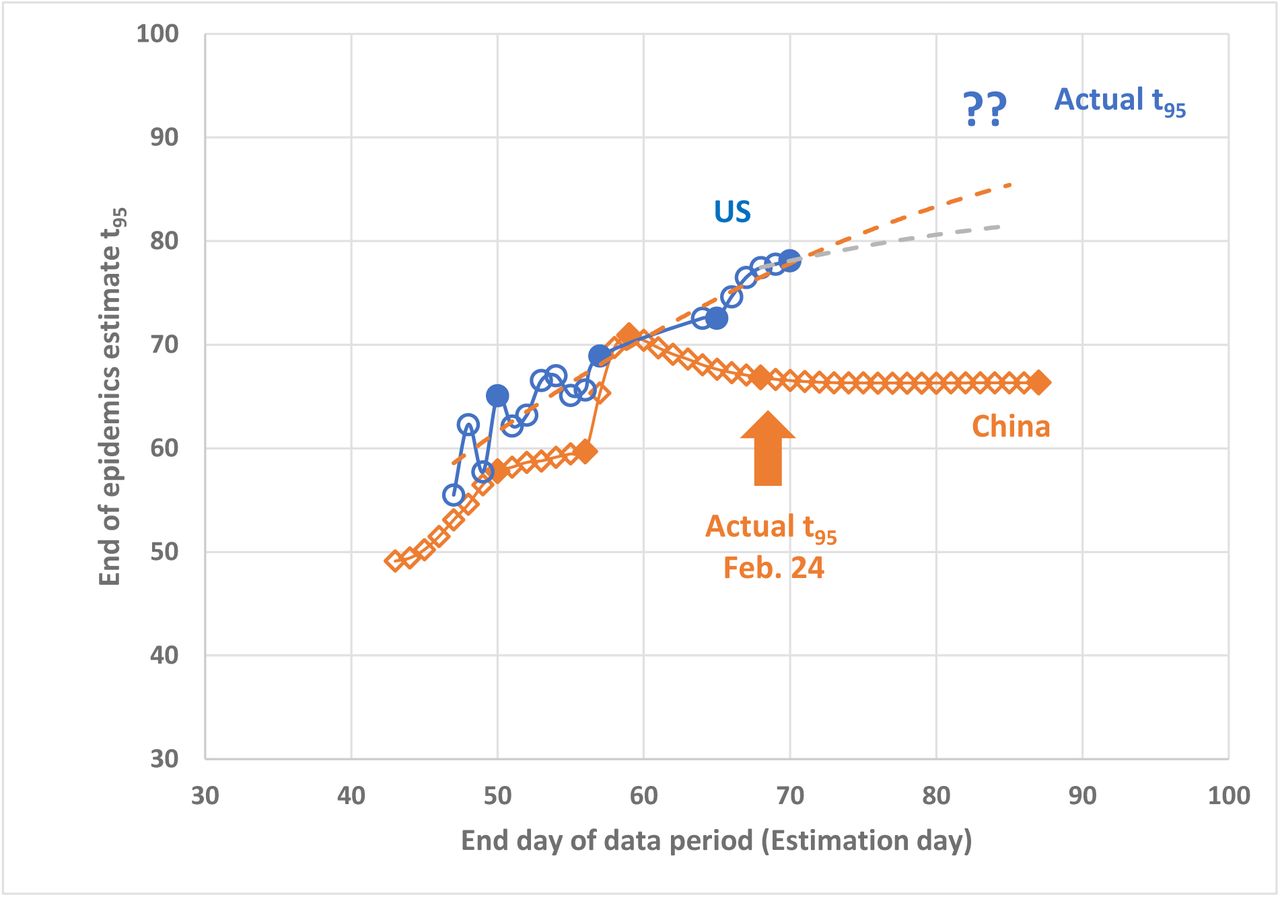
Sequential estimates of “end time” t95 (see notes in Figure 3)

Examples of model predictions for China for selected parameter estimates on specific days
Due to a change in reporting criteria in China on day 57 (February 12), there was a major increase in the number of reported cases that could not be incorporated in the model. As mentioned before, we decided to use all data (with the jump) in any subsequent analysis. The immediate result was a very large increase in the estimated maximum cases K (Figure 3), approximately doubling it from about 50,000 on day 56 to about 99,400 on day 59. This big increase underscores again the sensitivity of the logistic model to data quality. However, the model is also robust in a longer term as the K estimates quickly converged toward their ultimate values.
Similarly, there was also a significant jump in the estimates of t95 (see Figure 4) due to the jump in the case numbers. However, it is remarkable that the estimates of the “end time” t95 were much more constrained and much closer to the actual value. Even as early as three weeks before the end of the epidemic the estimates of the “end time” were between 60 and 70 days, very close to the final value of 67 days.
United States
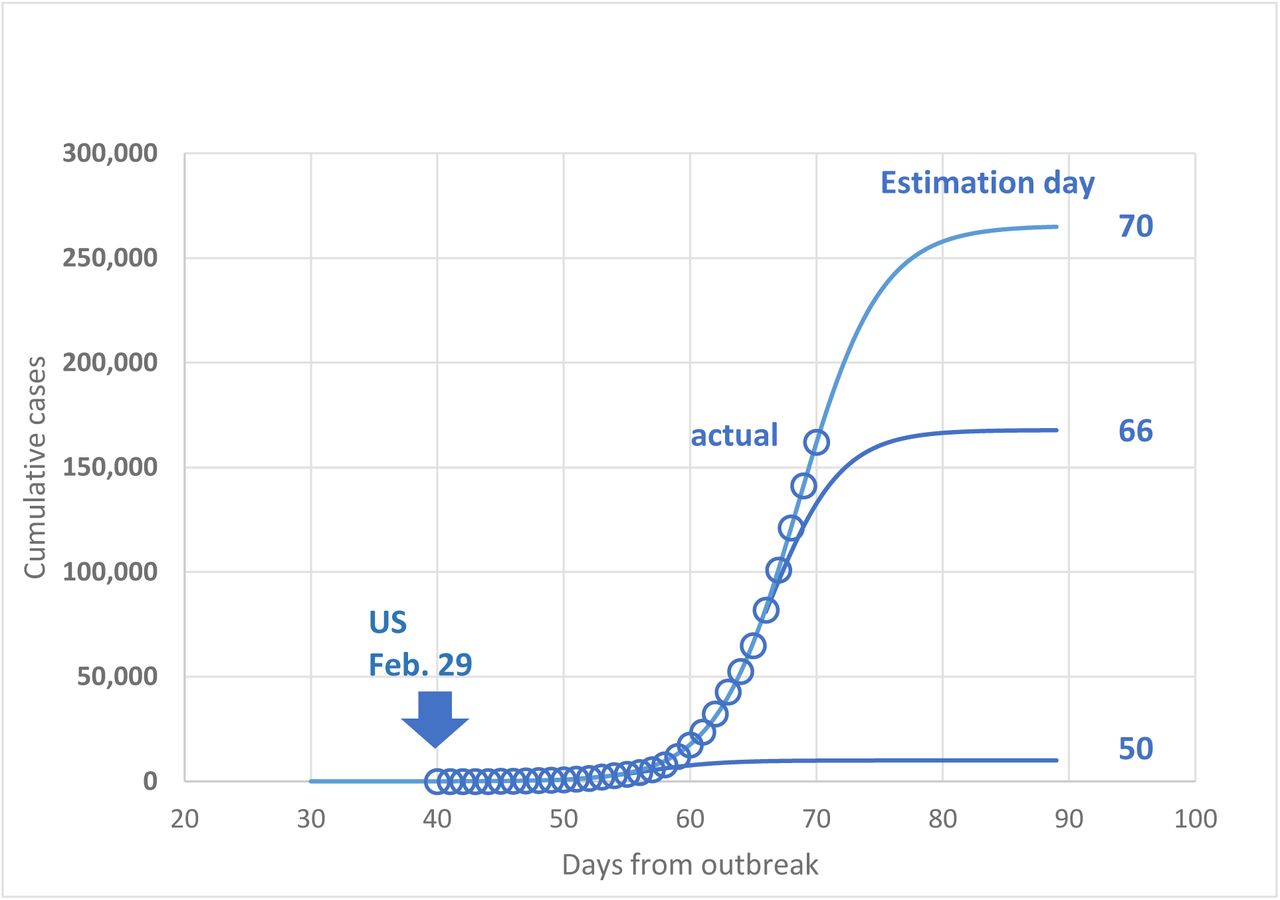
Unlike China, the epidemic in the US is still at the growth phase, perhaps deviating slightly from the exponential growth. Thus, the available dataset is much smaller and the logistic model estimates are burdened with much larger uncertainty. Currently available estimates of the maximum cases K are also shown in Figure 3. They exhibit very large variations increasing from approximately 1,100 on day 47 to approximately 265,000 on day 70 without any sign of leveling off. This large variation is not unexpected since the nearly exponential growth does not contain sufficient information on the actual maximum. In other words, the derivative dP/dt in Eq. (2) is dominated by the term r P while (1-P/K) ≈ 1. This behavior is also seen in the examples of predicted logistic curves for selected sets of estimated parameters K, r, t0 (Figure 6).

Examples of model predictions for the US for selected parameter estimates on specific days
The sequential estimates of the “end time” t95 are plotted in Figure 4. They also tend to increase in time with the increasing number of reported cases but unlike the estimates of K (and similarly to the Chinese case) it varies in a much smaller interval – 70 to 80 days in the past two weeks, If the behavior of the US epidemic is similar to the Chinese case, we could expect further leveling off of t95 at slightly above 80 days. If this bold prediction will hold, we could see the end of the epidemic growth around 80 – 85 days after its origin, around April 10 to 14. Of course, the end here is defined as the cessation of new cases and not the complete recovery of the infected patients.
Data Availability
data in the paper
Declarations
Ethics approval and consent to participate
The ethical approval or individual consent was not applicable.
Availability of data and materials
All data and materials used in this work were publicly available.
Consent for publication
Not applicable.
Funding
This work was not funded.
Disclaimer
The funding agencies had no role in the design and conduct of the study; collection, management, analysis, and interpretation of the data; preparation, review, or approval of the manuscript; or decision to submit the manuscript for publication.
Conflict of Interests
The author declared no competing interests.
Appendix
Number of cases in China
Number of cases in the US
Sequential estimates of logistic model for China
Sequential estimates of logistic model for the US
References


