
Abstract
While the outbreak in China is now contained, since mid March 2020, the epicentre of the COVID-19 pandemic is in Europe, with Italy reporting more deaths than China. Various European countries have seen an exponential growth in daily new cases, and unless strong reductions in transmission, the wave is expected to hit all of Europe by the end of March 2020. There is an urgent need to reduce transmission and thus reduce the growth rate of this epidemic, reduce the height of the epidemic peak and the peak demand on healthcare services, as well as reduce the total number of infected persons.
Here we estimate the impact of COVID-19 on the Swedish population at the municipality level, considering demography and human mobility under scenarios of mitigation and suppression. We estimate the timelines of incidence, hospitalization rates, the intensive care (ICU) need, and the mortality in relation to the current Swedish ICU capacity, and costs of care. We further investigate the sensitivity to various degrees of potential underreporting on the estimates.
Introduction
In response to the COVID-19 outbreak, China implemented extraordinary public health measures at great socio-economic cost, moving swiftly and decisively to ensure early identification of cases, prompt laboratory testing, facility-based isolation of all cases, contact tracing and quarantine.1 In the community, social distancing was implemented at a grand scale, all mobility put to an halt, and the city of Wuhan was in lock-down for about 4 weeks. China’s tremendous efforts showed success. Other Asian countries facing a major explosion such as South Korea also managed to curb the epidemic. South Korea employed very liberal testing, hospital-based isolation of all cases (even mild ones), combined with extensive contact tracing enhanced by mobile phone and digital technologies, but did not use a lock-down.2, 3 Despite many importations early on in the outbreak, Singapore has seen a flat rate of daily new cases, by focusing on prompt and aggressive pro-active case detection and attempting to interrupt every chain of transmission and keeping clusters at bay.4
While the outbreak in China is now contained, since mid March 2020, the epicentre of the COVID-19 pandemic is in Europe5, with Italy reporting more deaths than China. Various European countries have seen an exponential growth in daily new cases, and unless strong reductions in transmission, the wave is expected to hit all of Europe by the end of March 2020. There is an urgent need to reduce transmission and thus reduce the growth rate of this epidemic, reduce the height of the epidemic peak and the peak demand on healthcare services, as well as reduce the total number of infected persons.
In the absence of vaccines, a wide range of control measures can be considered to contain or mitigate COVID-19. These include active case finding with prompt isolation of cases, contact tracing with quarantine of contacts, school closures and closures of public places, mobility restrictions, social distancing in the community, social distancing only of the elderly, and a lock-down (also known as cordonaire sanitaire).1 There is currently no consensus about which measures should be considered, in which combination, and at which epidemiological threshold such measures should be implemented for maximum public health impact.6
European policy-makers are currently debating two strategies: (a) containment or suppression, which aims to reverse epidemic growth, thereby reducing case numbers to low levels. And (b) mitigation, which focuses on slowing but not necessarily stopping epidemic spread –reducing peak healthcare demand while protecting those most at risk of severe disease from infection. Each policy has major challenges. Containment aims to reduce the reproduction number, R, to below 1, thus causing case numbers to decline. Mitigation aims to merely slow spread by reducing R, but not to below 1.
It should now be an urgent priority to quantify the effects of these measures and specifically whether they can reduce the effective reproductive number below 1, because this will guide the response strategies.
Here we estimate the impact of COVID-19 on the Swedish population at the municipality level, considering demography and human mobility under scenarios of mitigation and suppression. We estimate the timelines of incidence, hospitalization rates, the intensive care (ICU) need, and the mortality in relation to the current Swedish ICU capacity, and costs of care. We further investigate the sensitivity to various degrees of potential underreporting on the estimates.
Methods
We fitted a compartmental SEIR alike model including compartment for hospitalization and ICU care with age groups of 0-59, 60-79, and 80+ years at the level of municipality in Sweden. We further linked the municipalities to each other using a radiation model with was calibrated using a N1H1 Influenza A model to the influenza incidence in Sweden from 2015-2018. Demographic data was taken at the municipality level of Sweden for year 2018 from Statistics Sweden and all estimates was derived by municipality weighted proportion of populations by age groups of 10 years.
The case fatality ratio (CFR) varies across regions, partly depending on age structure of population, but also potential underreporting. Hospitalization and ICU needs per apparent infections was taken from Ferguson et al.7 We alike Ferguson et al. assumed the infection fatality ratio (IFR) was lower than the CFR adjusting for underreporting, depending on the municipality age structure. We run the base scenario models on the assumption of 50% underreporting, approximately similar to Ferguson et al.7 Under this assumption the IFR was estimated to around 1.0% (high) depending on the exact age structure. We further investigated the sensitivity to these results by allowing the proportion of underreporting due to mild disease to vary up to 80% and 90%, and thus the IFR to fall to around 0.5% (medium) and 0.2% (low) depending on age structure. The lower IFR of 0.2% still is double the IFR associated with influenza A.
We modelled the impact of the SARS-COV-2 virus on the Swedish population using the various counter measures associated with the mitigation versus the suppression strategies. The baseline scenarios include isolation of hospitalized patients and self-quarantine, which is restricting the infectious period of the average population. The infectious period in severely ill hospitalized patients is likely to vary by individual and range from days to weeks. In most cases, viral shedding in respiratory secretion for about seven days is likely a major driver of disease transmission. Due to the self-quarantine advice if symptoms (cough, fever), the actual infectious period can be assumed much shorter for many people, but household member are often still at risk. There are also clear indications for asymptomatic and pre-symptomatic transmission. We thus assumed the average effective infectious period was centered around 5 days, with a β of 0.5, this associates to an R0 of 2.5, which is in the middle of the range of reported basic reproduction rates for COVID-19. In the mitigation versus suppression scenarios we assumed the quarantine and isolation based on symptoms was present from the first day of reported COVID-19 cases in Sweden, February 24, 2020, while the mitigation and suppression strategies was activated first the 20th of March, 2020. The model and parameters are described in the supplement.
The model was initiated to simulate the municipality transmission dynamics and inter-municipality spread across Sweden starting from the 24th of February and ending 6 months later, August 23, 2020. Due to the many arriving travelers carrying SARS-COV-2 arriving from Italy the week of the 24th of February, the model was seeded with 1 case per 50,000 population. Municipalities smaller than 50,000 did not have any index cases. These index cases can either be seen as asymptomatic cases, cases with symptoms but lack of compliance to home quarantine, or cases with late symptom onset not identified early enough.
Scenarios of different countermeasures to COVID-19. Isolation and self-quarantine onset were 24th of February; onset of the social isolation of elderly 13th of March; onset of between municipality mobility 13th of March; onset of all other interventions 20th of March
Results
The epidemic in Sweden as a whole show to be sensitive to some of the NPI’s. Overall, the peak months varies by location, where overall the smaller rural municipalities are predicted to experience a later peak, and the urban municipalities are predicted to peak earlier. Reduced mobility between municipalities (scenario 1 vs 2) do change the timing of the peak, and further delays the outbreak onset in smaller rural municipalities. Municipalities with the oldest population overall experience higher ICU needs and largest health impacts.
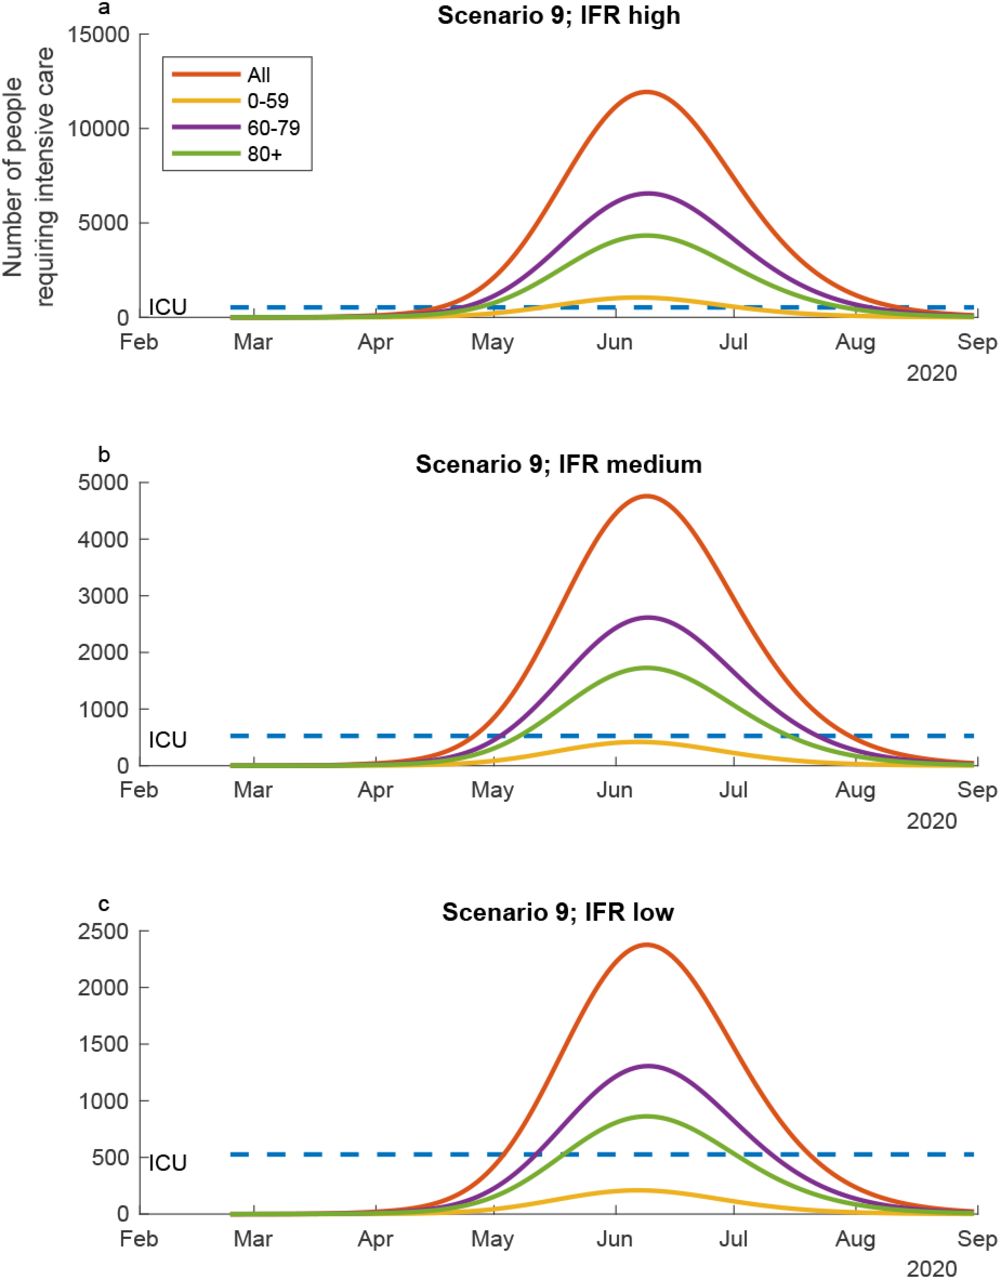
Considering the ICU needs in the age groups studied, the scenarios 1-3 and 5-7 and 9 where contact rates and social distancing are reduced to by 50% independent of between municipality mobility, are resulting in mitigation scenarios. Some of them are flattening the outbreak curve and the ICU need substantially, especially at the 50% reduction of contacts and social distancing. The role of between municipality is still important, but not significantly for the rates demand in the whole of Sweden. For suppression, the contact rates and social distancing need to be reduced by 75%, also here the between municipality mobility is not a key factor when looking at the demand for the whole of Sweden overall. Scenario 9 corresponding to the mitigation scenario by only protecting the ages 60+ by reducing their contact by 50% by increasing social distancing isn’t very sensitive to the between municipality mobility when looking at the ICU demand. The results of these predictions aggregated for all the municipalities in Sweden is presented in Figure 1.

The ICU need for the total population of Sweden ranges from around 6 times to 30 times the ICU capacity of Sweden at the peak of the outbreak in the scenario 1 where only isolation and self-quarantine is practiced (Figure 1) depending on the IFR. In this scenario the age group below 60 year take up a substantial ICU need. In scenario 2 where contact rates are reduced moderately the whole population by social distancing, the demand at the peak of the outbreak is around 20 to 4 times higher than the ICU capacity, and the curve is slightly flattened. At the higher IFR the ages under 60 takes up a significant proportion of ICU capacity. Scenario 3 with strong reduction in contact rates and increases in social distancing the ICU demand curve is substantially flattened. At this level the ICU demand is lower than the capacity at the low IFR, just above at the medium IFR, and substantially above at the high IFR. In scenario 4 where the contact rates and social distancing is very strong, the outbreak is suppressed, but risk to pick up again when the social distancing stops. Overall the scenarios 5-8 show similar patterns to 1-4 respectively but indicate the outbreaks and ICU demand is a bit larger for a longer period overall in Sweden when the between municipality mobility is higher compared to lower. In Figure 2 scenarios 9 is illustrated with 50% reduction in contacts and increased social distancing among ages 60+. In this scenario the under 60 years with take of a large bit of the ICU capacity independent of the IFR. At the peak the ICU demand will be around 30 times the capacity in Sweden at the higher IFR, while around 5 times the capacity at the lower IFR.

Health care demand;
Discussion
The results show a strong demand on health care and potential risks of fatalities in relation to sensitivity of the Swedish impacts from COVID-19. They describe uncertainty in the impacts from the responses in relation to mobility, connectivity, social distancing. The results strongly indicate risks with large demands of in-patient care and intensive care in relation to scenarios with less strong reductions in contact rates and with less social distancing. Those impacts are reduced when we assume the underreporting is more substantial.
Overall, these analyses include uncertainties and with the development of more knowledge of the virus SARS-COV-2 and the disease risks with COVID-19, the implications of the results may need to be revisited.
Sweden is currently (20th of March, 2020) most likely following the scenario 2 and scenario 9 development, which suggest the health care demand and mortalities could be substantially from COVID-19. A change in strategy could reduce the impacts on the health care demand and the public health substantially, but would also need to consider impacts on other sectors in the society.
Supplement
To account for time delays in the spatial spread of SARS-CoC-2 over large geographical ranges (i.e., Sweden) we set up a spatial compartmental model. We accordingly make a distinction between local (municipality) and global (Sweden) processes. The effects of local contact structures were assumed to be well described by the law of mass action; at local scales we can assume a well-mixed contact-structure due to the transmission efficiency at such spatial scales of SARS-CoV-2. The effects of global contact structures were assumed to be well described by the Radiation model1, which introduces time delays to the spatial progression of infections over Sweden.
We can therefore express a compartmental model generally for any municipality. We have developed an age-structured SEIR-based compartmental model extended to account for health-care demand arising from COVID-19 epidemic in Sweden. In any municipality i, we account for all individuals that are susceptible Si; latent (exposed) Ei; infectious Ii; in health care Hi; in critical care Ci; recovering in health care after critical care  dead due to SARS-CoV-2 infection Di; recovered Ri. Respective of these variables are age-structured (i.e., vectors with age-specific component values). We have accounted for three age-classes a = (0 − 59, 60 −79, 80+). The compartmental model can then be written
 where N = Si + Ei + Ii + Ri, and where ⟨TI⟩ij denotes the number of infected individuals from the jth municipality visiting the ith municipality, on average for a day, and ⟨TI⟩ji denotes the number of infected individuals from the ith municipality going the ith municipality, on average for a day. These mobility rates are given by the Radiation model1, where we used the time dependent rate scaling α(t), with 0.001 as the baseline, i.e., the counter-scenario of inter-municipality travel-reductions. Please see table S1 for model parameterization that was based to a large extent on Ferguson et al.2
Parameters in equation system S.1 and their respective values.
Table 2 Severity of age-classes (from Ferguson et al. 2020). Drawing on these age-structured data, we derived the corresponding proportion of infected cases requiring hospitalization for age-classes a = (0 − 59, 60 −79, 80+) by first correcting for underreporting (50%, 80%, 80%), and by taking a weighted average for each age-class in a. We also derived the proportion of hospitalized cases requiring critical care by the weighted averaging, and not correcting for underreporting as there is naturally no underreporting of hospitalized cases.
References


