
ABSTRACT
Within-individual variability of repeatedly-measured exposures may predict later outcomes: e.g. blood pressure (BP) variability (BPV) is an independent cardiovascular risk factor above and beyond mean BP. Since two-stage methods, known to introduce bias, are typically used to investigate such associations, we introduce a joint modelling approach, examining associations of both mean BP and BPV across childhood to left ventricular mass (indexed to height; LVMI) in early adulthood with data from the UK’s Avon Longitudinal Study of Parents and Children (ALSPAC) cohort. Using multilevel models, we allow BPV to vary between individuals (a “random effect”) as well as to depend on covariates (allowing for heteroscedasticity). We further distinguish within-clinic variability (“measurement error”) from visit-to-visit BPV. BPV was predicted to be greater at older ages, at higher bodyweights, and in females, and was positively correlated with mean BP. BPV had a positive association with LVMI (10% increase in SD(BP) was predicted to increase LVMI by mean = 0.42% (95% credible interval: −0.47%, 1.38%)), but this association became negative (mean = −1.56%, 95% credible interval: −5.01%, 0.44%)) once the effect of mean BP on LVMI was adjusted for. This joint modelling approach offers a flexible method of relating repeatedly-measured exposures to later outcomes.
INTRODUCTION
When exposures vary over time – for example systolic blood pressure (BP) as measured over the life course – both the overall mean and the change in the exposure can affect later health outcomes (1). However, within-individual variability – i.e. the extent to which an individual’s measure fluctuates around this trend – may also be a risk factor (2).
Methodological difficulties have meant that within-individual variability in time-varying exposures have been seldom examined, and when they are it is often using two-stage procedures, known to introduce bias (3). An alternative, one-stage, approach is to use joint multilevel models to relate time-varying exposures (4) to a later outcome (5). These models have recently been extended to also examine within-individual variability (3). Such joint models leads to unbiased parameter estimates and correct standard errors: either when relating the mean and trajectory (6), or within-individual variability (3), of an exposure to a later outcome.
We illustrate this approach by examining the association of both mean BP and within-individual blood pressure variability (BPV) with an established biomarker of target organ damage: left ventricular mass indexed to height (LVMI). Whilst BPV can be measured across various time scales (7), here we focus on the longer-term, a.k.a. “visit-to-visit”. In adults, visit-to-visit BPV has been found to be an important predictor of subsequent cardiovascular disease (CVD) over and above mean level (8). Detecting those at risk of CVD early in life is important in order to design and administer preventative measures in a timely and targeted manner (9, 10). Mean systolic BP in childhood is positively associated with early signs of heart damage, such as left ventricular hypertrophy (11-13), and there is evidence from a US cohort of children that higher BPV – as estimated via the standard deviation (SD) of the measurements across all visits (conducted every 2-3 years) for each person – is associated with adult hypertension, independent of mean BP levels (14). However, there has been little investigation of the role of BPV on early target organ damage, despite its potential utility as a predictive factor (15), and only limited analysis of the factors associated with childhood BPV (14, 16).
Our aim was to explore the factors associated with within-individual BPV in a UK cohort of children using multilevel analyses, and to extend these to joint models to investigate the association of both mean BP and BPV with LVMI in early adulthood.
METHODS
Participants
The participants are from the Avon Longitudinal Study of Parents And Children (ALSPAC), an ongoing prospective longitudinal birth cohort study based in SW England (17-19). Pregnant women resident in Avon, UK with expected dates of delivery 4/1/1991 to 12/31/1992 were invited to take part in the study. The initial number of pregnancies enrolled was 14,541 resulting in 13,988 children alive at 1-year of age. When the oldest children were approximately 7 years of age, an attempt was made to bolster the initial sample with eligible cases who had failed to join the study originally, ultimately increasing the number of enrolled pregnancies to 15,454, with 14,901 children alive at 1-year of age. The study website (http://www.bristol.ac.uk/alspac/researchers/our-data/) contains details of all the data that is available through a fully searchable data dictionary and variable search tool.
5,217 of the participants attended an ALSPAC study clinic at mean age 17.7 years, of whom a random subsample of 2,047 (all singletons) had their LVMI (left ventricular mass in grammes, indexed to height in m2.7, i.e. g/m2.7) measured via echocardiography (20, 21) (exclusion criteria included pregnancy and congenital heart disease; see below for a comparison of the subsample modelled with the larger sample enrolled in ALSPAC, and Boyd et al. (17) for a discussion of attrition in ALSPAC). Echocardiography was performed using an HDI 5000 ultrasound machine (Phillips Healthcare, Amsterdam, The Netherlands) equipped with a P4-2 Phased Array ultrasound transducer by one of two experienced echocardiographers using a standard examination protocol (21).
1,988 of these participants had their systolic BP (SBP), height and weight and age recorded, on at least one prior occasion (research clinic). These clinics were at c. 7.5-, 9.5-, 10.5-, 11.5-, 13-, 15.5-years of age. At each clinic, the participant’s SBP (in mmHg) was measured at least twice, using a validated electronic monitoring device and a cuff size appropriate for their upper arm circumference, with the participant sitting and at rest with the arm supported. Each of these measurements was available for our analysis from each clinic, apart from the clinic at c.10.5 years of age, for which only the mean was available.
Statistical analysis
The covariates we included for SBP were age (for further details, see below), sex, an interaction between age and sex, weight, height, and a number of maternal characteristics including parity (the number of previous pregnancies resulting in either livebirth or stillbirth), age at delivery, and highest educational qualification. Sex, age and weight, as measured at the clinic at c.17.7 years of age, were included as exposures for LVMI, but height was not, as LVMI is indexed to height. All continuous covariates were centred around their grand mean prior to analysis. Weight, as measured across childhood, and LVMI were log-transformed prior to analysis.
We used a joint model to relate BPV to subsequent log(LVMI). We describe this modelling approach below, building up model complexity using an example which assumes that SBP increases linearly with age across childhood (we later relax this assumption).
In equation 1, y1ij is the repeatedly-measured exposure (SBP) measured at clinic i (i = 1, …, nj) for individual j (j = 1, …, J), with the covariate tij indicating the individual’s age at that clinic. In the mean function for BP, there are individual-level random effects for the intercept (u0j; mean BP at t = 0) and also for rate of change (u1j; BP slope), with within-individual (between-clinic) error eij. In standard multilevel models, the variance of the within-individual error is assumed to be constant (homoscedastic) across all observations (as  ). Here it is allowed to depend on age (tij), and also on an individual-level random effect u2j (with a log-link ensuring that the within-individual variance remains positive). Within-individual variability in blood pressure, log(BPV), is therefore allowed to change with age (as estimated here via α1). The random effect u2j allows each individual to have their own estimate of log(BPV). This is a mixed-effects location scale model, as described and demonstrated by Hedeker et al. (22, 23); see also Goldstein et al. (24). It is also possible to allow for coefficients of covariates within the within-individual variability function to randomly-vary across individual: for example allowing the coefficient for age (tij) to randomly-vary to investigate whether its association with BPV differs between people (25).
This model can be expanded to include the later individual-level outcome (log(LVMI), measured at c.17.7 years), producing a joint model with shared random effects, as follows:
In equation 2, y2j denotes log(LVMI) for individual j (j = 1, …, J). The random effects for mean BP, BP slope and log(BPV), discussed above, are included as exposures in the linear model for the mean of log(LVMI). (See Appendix 1 for an alternative parameterisation).
The models above have two levels, and assume there is just one measure per person, per clinic. If more than one measurement of SBP is taken for each individual at each clinic session, however, then the model can be expanded as follows:
In equation 3, y1hij denotes SBP as measured at (within-clinic) occasion h (h = 1, …, nij) for clinic i (i = 1, …, Ij), for individual j (j = 1, …, J). εhij refers to the residual within-clinic error in the repeatedly-measured exposure, assumed to have constant variance  . This within-clinic measurement error, which we assume is not related to log(LVMI) (y2j), will incorporate both systematic (e.g. white coat effect / habituation) and random error.
Following previous work modelling SBP across these ALSPAC clinics, we allowed for a non-linear relationship between age and mean SBP by fitting a linear spline with a knot point at 12 years (26, 27). The spline variables were derived as follows (where tij = age in years) (28):
These spline terms were fitted as fixed effects in the mean function for SBP. Since allowing the coefficients of these terms to randomly-vary across individuals lead to convergence problems in some models, a linear term for age fitted across the whole age range was fitted as a random effect. We assumed that BPV had a linear association with age.
Appendix 2 includes estimates from sensitivity analyses designed to (a) investigate the influence of the submodel for log(LVMI) on the random effect estimates; (b) compare a parameterisation modelling clinic mean BP with current models; (c) check whether restricting the analysis sample to those with LVMI measures had any effect on model for change in SBP, examining possible selection bias; (d) investigate sex as the only observed covariate, for comparison with published findings elsewhere (14, 16).
We used Bayesian estimation via MCMC methods in Stan (2.19.1) (29, 30), called from R (31) using the rstan package (32). See Appendix 3 for examples. Appendix 4 provides further details of estimation.
Ethical approval for the study was obtained from the ALSPAC Ethics and Law Committee and the Local Research Ethics Committees. Informed consent for the use of data collected via questionnaires and clinics was obtained from participants following the recommendations of the ALSPAC Ethics and Law Committee at the time.
RESULTS
Two observations at the individual-level, eight at the clinic-level, and one at the measurement-level (36 measurement-level observations in total) were identified as outliers in quantile-quantile plots of residuals from preliminary models and were removed from the dataset prior to further analyses. The resulting dataset comprised 1,986 individuals attending 10,556 clinic sessions with 19,360 recorded BP measurements.
Table 1 compares the participants included in the analysis with those 12,318 ALSPAC children who were not included (but were recruited in an eligible ALSPAC phase, singletons, and otherwise recorded as alive at 1 year of age). There was evidence that the included participants were more likely to be female, had mothers who had had fewer children and were more educated and healthier than those not included.
Comparing Characteristics of Children Later Undergoing Echocardiography, and Included in the Model, to Those not Included in the Model, From the Avon Longitudinal Study of Parents And Children, SW England, 1991-2008.
Figure 1 plots mean SBP against mean age for each clinic for those included in the model, indicating sample sizes for each clinic. The mean number of clinics attended was 5.3.

Mean clinic systolic blood pressure against mean age for clinics attended by those participants later undergoing echocardiography; within-plot annotations indicate sample size (individuals). Avon Longitudinal Study of Parents And Children, SW England, 1991-2008. Bars: 1SD either side of mean.
Table 2 summarises 3-level joint analyses in which both SBP trajectory and log(LVMI) are simultaneously modelled, with age centred around the sample mean of 11.3 years. With just age and sex as observed covariates (in model A), mean SBP was predicted to increase with age. The rate of increase was similar for males and females up to the age of 12 years, with mean BP predicted to increase more steeply for males at older ages. With regard to within-individual variance, with each year of age, BPV was predicted to increase by mean = 15.6% (95% credible interval (CI): 12.9%, 18.4%), or if expressed as the predicted increase in SD(BP): mean = 7.5% (95% CI: 6.2%, 8.8%). Females’ BPV was predicted to be mean = 16.7% (95% CI: 4.5%, 30.4%) greater than that for males (SD(BP): mean = 8.0% (95% CI: 2.2%, 14.2%)). Age at time of echocardiography was estimated to have a modest negative association with LVMI, and females were predicted to have smaller values of LVMI.
Estimates From Joint Models With Shared Random Effects, Analysing SBP and log(LVMI) as Outcomes, Presenting the Posterior Parameter Estimates of the Regression Coefficients (Except Where Indicated), Avon Longitudinal Study of Parents And Children, SW England, 1991-2008.
In model B, with weight and height now added as further covariates, mean SBP was predicted to increase with greater weight and height. With regard to BPV, this was estimated to be larger with greater log(weight): specifically, for a 10% increase in weight, BPV is predicted to increase by mean = 5.8% (95% CI: 2.1%, 9.6%) (SD(BP): mean = 2.6% (95% CI: 0.7%, 4.5%)). The estimated effect of height on log(BPV) was negative, with a substantial portion of the posterior containing positive values as well (BPV predicted to decrease by mean = −0.4% (95% CI: −1.4%, 0.7%) per 1cm increase in height). Otherwise, weight was predicted to have a positive association with LVMI.
Finally, in model C, maternal characteristics were added as covariates in the mean function for SBP (with a slight drop in sample size due to fewer observations for these variables). This predicted a modest positive association of mean SBP with mother’s age at delivery, lower mean SBP with higher parity, and with mean SBP generally predicted to be lower with more advanced highest educational qualifications. The estimated associations between the observed covariates of age, sex, height and weight and mean SBP were substantively similar whether maternal characteristics were included in the model (C) or not (B).
Focusing on Model C, this estimated a small negative correlation (r = −0.09 (95% CI: −0.21, 0.03)) between mean BP and BP slope: i.e. those with higher mean BP at 11.3 years were predicted to have a smaller increase in their mean BP across age. Otherwise, a large positive correlation (r = 0.50 (95% CI: 0.33, 0.71)) was estimated between mean BP and log(BPV): i.e. individuals with higher mean SBP at 11.3 years also tended to have more fluctuation in their SBP, whilst the correlation between BP slope and log(BPV) was estimated as negative, and small (r = −0.05 (95% CI: −0.34, 0.23)).
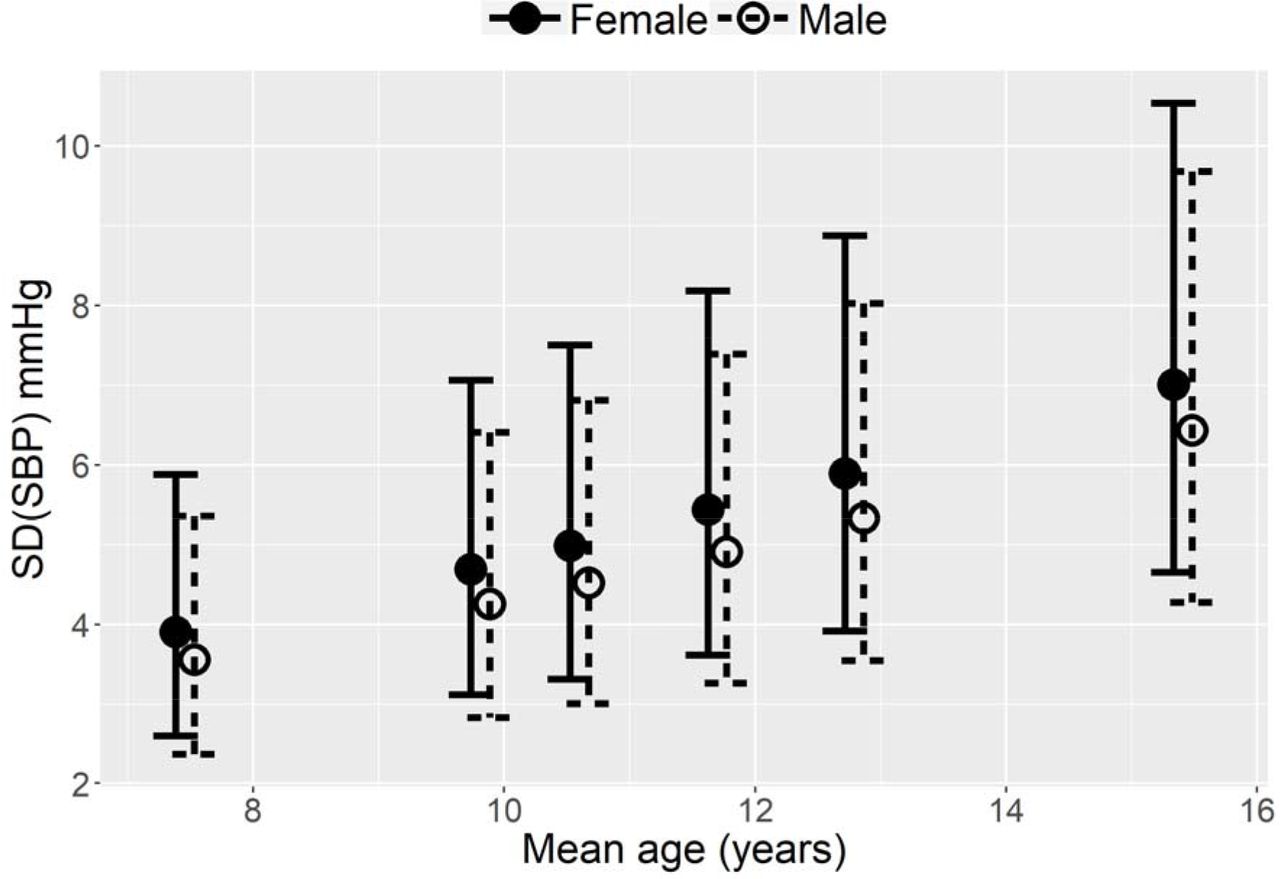
The SD of the BPV random effects on the log scale was estimated to be mean = 0.42 (95% CI: 0.29, 0.53). Figure 2 plots predicted within-individual SDs from this model, by sex, for the sex-specific mean value of the covariates within the within-individual variance function for each clinic. In addition, Figure 3 plots examples from this model of three individuals randomly-drawn from the 25 with the lowest, and 25 with the highest, estimated random effect for log(BPV) (with an added constant on both the x- and y-axis to preserve anonymity), illustrating instances of individual-level patterns of SBP measurements at each end of the observed range of estimated BPV.

Predicted within-individual SD(SBP), by sex, for (sex-specific) mean values of age, height and weight at each research clinic. Mean with 95% confidence intervals. Avon Longitudinal Study of Parents And Children, SW England, 1991-2008. SBP, systolic blood pressure; SD, standard deviation.

Observed data, and predictions, for three randomly-selected individuals with amongst the lowest (A-C), and three individuals with amongst the highest (D-F), random effect estimates for BPV. Note that a constant has been added to each axis to preserve anonymity. Avon Longitudinal Study of Parents And Children, SW England, 1991-2008. BPV, (within-individual) blood pressure variability; SBP, systolic blood pressure.
In the models in Table 2, all random effects have been included as predictors of the individual-level outcome, log(LVMI). Table 3 contrasts the estimates of these random effects from model C to those in which the effect of each set of random effects on log(LVMI) is tested without adjustment for the other random effects on log(LVMI) (but with the remaining structure of the model otherwise remaining the same; see Appendix 2 for full estimates). When mean BP is the only random effect included as a predictor of LVMI, higher mean BP is associated with higher LVMI. The same is true when the random slope and the log(BPV) random effects are alternately added as predictors of LVMI. With regard to the log(BPV) predictor, a 10% increase in BPV is predicted to increase LVMI by mean = 0.21% (95% CI: −0.23%, 0.69%) (or a 10% increase in SD(BP) is predicted to increase LVMI by mean = 0.42% (95% CI: −0.47%, 1.38%)). As Table 3 further indicates, when all three random effects are included as predictors of LVMI, then the estimated association between log(BPV) and LVMI becomes negative; specifically, a 10% increase in BPV is estimated to be associated with a decrease in LVMI by mean = −0.78% (95% CI: −2.54%, 0.22%) (or a 10% increase in SD(BP) is associated with a decrease in LVMI by mean = −1.56% (95% CI: −5.01%, 0.44%)). This model also estimated a positive association of mean BP with LVMI (a 1mmHg increase in BP at the sample mean age was predicted to increase LVMI by mean = 0.59% (95% CI: 0.12%, 1.37%)) and of change in mean BP with LVMI (a 1mmHg increase in the slope was predicted to increase LVMI by mean = 3.56% (95% CI: 0.01%, 7.92%)). Table 4 details mean LVMI for individuals grouped into tertiles of the random effect estimates for mean BP and log(BPV). It demonstrates that within strata of mean BP, higher values of BPV are generally associated with lower mean LVMI.
Posterior Parameter Estimates From Joint Models in Which Mean BP, BP Slope, and log(BPV) are Alternately Included as Exposures for log(LVMI).a Avon Longitudinal Study of Parents And Children, SW England, 1991-2008.
Mean LVMI (95% Confidence Interval), g/m2.7, for individuals grouped by tertiles of the random effect estimates for mean BP and log(BPV), Avon Longitudinal Study of Parents And Children, SW England, 1991-2008.
As Appendix 2 further discusses, a range of sensitivity analyses yielded substantively similar estimates to the models presented here.
DISCUSSION
Using data from a prospective longitudinal birth cohort study cohort study based in the UK, we used a joint modelling approach to examine the factors associated with visit-to-visit BPV across childhood, and the association of both mean BP and BPV with an established biomarker of target organ damage, LVMI, in early adulthood. BPV was estimated to be larger – i.e. individuals’ SBP was estimated to fluctuate more greatly – at older ages, in females, and at greater bodyweights. BPV also had a large, positive correlation with mean BP (at the sample mean age of 11.3 years), but only a very small correlation with the rate of change in BP (slope) across age. In a model which did not adjust for the effect of mean BP and its slope on LVMI, BPV was estimated to be positively associated with LVMI. When mean BP and its slope were introduced as exposures of LVMI, however, the direction of association between BPV and LVMI changed to a negative one. These models further estimated a positive association of mean BP with LVMI and of change in mean BP with LVMI.
Whilst we are not aware of other studies in this age range which have reported on the effect of weight and height on BPV, the effect of age, sex and race have been examined. Investigating BPV in children aged 8-18 years in Massachusetts, Rosner et al. fitted variance components models to BP measurements taken within- and across-visits (up to a maximum of 16 visits over four years), and subsequently examined the effect of age, sex and BP level on these two variance components in three-way ANOVAs (16). They found “no meaningful effects” of these covariates on variability of SBP (the effect of BP level was significant, but judged to be small; correlation coefficient not reported). More recently, in an analysis of the Bogalusa Heart Study in the USA, Chen et al. measured visit-to-visit BPV in children aged 4-19 years by taking the SD of 4-8 measurements of clinic mean SBP from visits scheduled every 2-3 years (14). Males were estimated to have significantly higher SD(SBP) than females, and SD(SBP) was estimated to be significantly greater for blacks than for whites. Our supplementary analyses (Appendix 2) also indicated that females were estimated to have lower BPV than males, but not once the effect of time-varying covariates were adjusted for. In addition, and in keeping with our findings, Chen et al. found a positive correlation (r = 0.15) between mean childhood BP level and SD(SBP) (14). Such a positive correlation has been characterised in studies of adults too (8, 33).
Whilst several studies have found a positive relationship between adult BPV, independent of mean BP, and later cardiovascular events such as stroke (8) and all-cause mortality (33), evidence for the relationship between BPV and target organ damage (as indicated by left ventricular hypertrophy, for example) is more equivocal (34, 35). In a recent review, Dolan & O’Brien described contrasting results with regard to the association of visit-to-visit BPV and cardiovascular outcomes, suggesting differences between (adult) study populations, such as underlying cardiovascular risk, may be an important determinant of such heterogenous findings (7). With regard to the relationship between childhood BPV and adult biomarkers, Chen et al. found childhood visit-to-visit SD(SBP) to be significantly associated with adult hypertension (14). This remained the case after adjusting for mean childhood SBP, although elevated childhood SBP levels were found to be more predictive of adult hypertension than childhood BPV. We have previously demonstrated that in 17 year-olds, higher body mass index (BMI) is causally related to higher LVMI, suggesting that there is meaningful variation in cardiac structure measures in early adulthood that is likely to track across life and relate to later life cardiovascular health (36). Nevertheless, in the current study the positive association between childhood BPV and LVMI in early adulthood did not persist once childhood mean BP had been adjusted for. In fact, within strata of mean childhood SBP, higher BPV was associated with smaller values of LVMI. Whether it is appropriate to adjust for mean BP when assessing the association of BPV with LVMI somewhat depends on whether one has a causal model in mind which conceptualises mean BP as causing both BPV and LVMI (in which case adjustment for mean BP as a confounder might be appropriate), or whether no causal relationship is proposed between mean BP and BPV (i.e. other, unknown, factors cause mean BP and BPV, and each in turn has a causal relationship with later LVMI), in which case it may not be appropriate to adjust for mean BP. If the purpose is prediction, on the other hand, then by simultaneously estimating the effect of mean BP, its slope, and BPV on the later outcome, we allow for a more complete appraisal of the association of repeatedly-measured BP with LVMI. Note that whether mean BP is adjusted for or not, the association of BPV with LVMI was estimated to be small, with appreciable uncertainty as to whether it was non-zero, or indeed of the opposite sign.
The results also indicated that mean BP (at the sample mean age), and change in mean BP, were both positively associated with LVMI in early adulthood. Analyses of the Georgia Stress and Heart Study and the Bogalusa Heart Study have also found mean BP in childhood (37), and its slope from childhood to young adulthood (38) and in adolescence (39), to be positively associated with left ventricular hypertrophy in adulthood.
If we assume that selection into our analysis only depends on measured variables such as sex of child, education and age of mother, then their inclusion as covariates will result in unbiased models. If, having conditioned on such covariates, inclusion in our models is related to the exposure (SBP) and/or outcome (LVMI), then there will be bias. A priori, this seems relatively unlikely, however: e.g. such biomarkers are not readily-observable in a manner which would typically influence one’s participation in a study. Whilst there were fewer observations for the maternal characteristics (cf. child-based covariates) included in some models, the proportion of missing data was relatively modest (8-9%), and estimates for parameters common to each model were substantively similar.
The general class of model we have used could be employed to examine within-person variability in any repeatedly-measured exposure, relating it to later individual-level outcomes of interest within a joint model: e.g. the association between glycaemic variability and mortality (40), variability in gait and risk of falling in older adults (41), and variation in prostate specific antigen and prostate volume (42). We have focused on within-individual variability, but interest may lie in characterising within-clinic (inter-individual) variability instead. In addition, the models can be readily adapted for binary variables, time-to-event data (3), etc. (with additional adjustments made as appropriate to accommodate e.g. autocorrelation in the case of intensive longitudinal measurements such as ambulatory BP).
We have supplied example code to demonstrate how these models can be fitted using a Bayesian framework (using Stan (30) and BUGS (43): see Appendix 3, which also includes discussion of how many repeated measures are needed to estimate these models. Endeavours to fit such models are being actively extended to other software packages too (44, 45)). Whilst fitting these models involves greater computational burden and complexity compared to a two-stage approach, the latter is known to introduce bias (3). Joint models have been recently employed to examine within-individual variability (3). We further extend these by investigating the association of time-varying covariates with within-individual variability, allowing us to examine residual BPV unexplained by known factors, and also by distinguishing between-clinic from within-clinic variability. As such, the joint modelling approach we have introduced offers a very flexible method of exploring the factors associated with within-individual variability.
Data Availability
Data are available following relevant procedures for data access from Avon Longitudinal Study of Parents and Children (ALSPAC, http://www.bristol.ac.uk/alspac/researchers/access/); computing code to fit models to simulated data is provided in Appendix 3 of the Supplementary Materials.
FUNDING
R.M.A.P. was funded by the UK’s Medical Research Council (MRC) grant MR/N027485/1 awarded to investigator K.T. This work was also supported by the following grants: the MRC and the University of Bristol support the MRC Integrative Epidemiology Unit (MC_UU_00011/3); A.D.H. received support from the Wellcome Trust (086676/7/08/Z) and the British Heart Foundation (PG/06/145 & CS/15/6/31468) and works in a unit that receives support from the MRC (Programme Code MC_UU_12019/1); D.M.P. was funded by MRC grant MR/P015298/1; the UK Medical Research Council and Wellcome (Grant ref: 102215/2/13/2) and the University of Bristol provide core support for ALSPAC. This publication is the work of the authors and they will serve as guarantors for the contents of this paper. A comprehensive list of grants funding is available on the ALSPAC website (http://www.bristol.ac.uk/alspac/external/documents/grant-acknowledgements.pdf).
ACKNOWLEDGEMENTS
We are extremely grateful to all the families who took part in this study, the midwives for their help in recruiting them, and the whole ALSPAC team, which includes interviewers, computer and laboratory technicians, clerical workers, research scientists, volunteers, managers, receptionists and nurses.
ABBREVIATIONS
- BMI
- body mass index
- BPV
- (within-individual) blood pressure variability
- BP
- blood pressure
- CI
- credible interval
- CVD
- cardiovascular disease
- LVMI
- left ventricular mass indexed to height
- SBP
- systolic blood pressure
- SD
- standard deviation
REFERENCES


