
Abstract
Beckwith-Wiedemann Syndrome (BWS, OMIM #130650) is a congenital epigenetic disorder in humans which affects approximately 1 in 10,340 children. The incidence is likely an underestimation as the condition is usually recognized based on observable phenotypes at birth. BWS children have up to a 28% risk of developing tumors and currently, only 80% of patients can be corroborated molecularly (epimutations/variants). It is unknown how the subtypes of this condition are molecularly similar/dissimilar globally, therefore there is a need to deeply characterize the syndrome at the molecular level. Here we characterize the methylome, transcriptome and chromatin configuration of 18 BWS individuals together with the animal model of the condition, the bovine large offspring syndrome (LOS). Sex specific comparisons are performed for a subset of the BWS patients and LOS. Given that this epigenetic overgrowth syndrome has been characterized as a loss-of-imprinting condition, parental allele-specific comparisons were performed using the bovine animal model. In general, the differentially methylated regions (DMRs) detected in BWS and LOS showed significant enrichment for CTCF binding sites. Altered chromosome compartments in BWS and LOS were positively correlated with gene expression changes, and the promoters of differentially expressed genes showed significant enrichment for DMRs, differential topologically associating domains, and differential A/B compartments in some comparisons of BWS subtypes and LOS. We show shared regions of dysregulation between BWS and LOS, including several HOX gene clusters, and also demonstrate that altered DNA methylation differs between the clinically epigenetically identified BWS patients and those identified as having DNA variants (i.e. CDKN1C microdeletion). Lastly, we highlight additional genes and genomic regions that have the potential to serve as targets for biomarker development to improve current molecular methodologies. In summary, our results suggest that genome-wide alternation of chromosome architecture, which is partially caused by DNA methylation changes, also contribute to the development of BWS and LOS.
Introduction
Beckwith-Wiedemann Syndrome (BWS, OMIM #130650) in humans and its bovine counterpart large/abnormal offspring syndrome (LOS/AOS) are well-known congenital epigenetic disorders [1–3]. The incidence of spontaneous BWS has been reported to be approximately 1 in 10,340 live births but the incidence of spontaneous LOS is currently unknown [4–6]. BWS and LOS share a broad spectrum of clinical features including macrosomia, macroglossia, abdominal wall defects (umbilical hernia/omphalocele), lateralized overgrowth, ear malformation, organomegaly, and placentomegaly [2,7–19]. In addition, BWS is also associated with increased embryonal tumor incidence, hyperinsulinism, and facial nevus simplex [2], and LOS often results in dystocia and demise of offspring and dam due to offspring oversize [20]. BWS and LOS share epigenetic defects in the form of loss-of-imprinting at IGF2, KCNQ1, IGF2R, PLAGL1, PEG3, and DLK1 [2,6–8,21–30]. In addition to primary epimutations, subtypes of BWS involve genetic defects which lead to loss of gene function or secondary epimutations that result in loss-of-imprinting [31,32].
The development of the mammalian embryo is a finely regulated process and adverse external insults during this window can have permanent influence on the health of the individual long after the exposure, a phenomenon known as Developmental Origins of Health and Disease [33,34]. Both BWS and LOS have been reported to occur more frequently in offspring conceived using assisted reproductive technologies (ART). Children conceived using ART have over a 10-fold increased risk (1 in 1,126 live births) for developing BWS [35], while in the bovine genetic improvement industry, the incidence of overgrowth was recently reported to be 10% for males and 24% for females [36]. The causal relationship between ART and the increased incidence of these syndromes is considered to be achieved by inducing errors in the epigenome of oocytes and/or embryos since ART manipulations overlap with critical developmental windows for epigenetic reprogramming [37–41].
We and others have shown that alterations in epigenetic mechanisms (i.e. genomic imprinting, DNA methylation, and locus-specific chromosome architecture) and the resultant altered expression of small/long non-coding RNAs are detectable during gestation and after birth in these syndromes [42–44]. However, whether genome wide alteration of chromosome architecture exist in these conditions is not known, nor is how altered genome organization is involved in the observed global alterations in methylome and transcriptome and vice versa. Our hypothesis is that genome-wide alteration of chromosome architecture occurs in the counterpart overgrowth syndromes BWS and LOS that lead to regional and global gene expression changes and that some of these topological aberrations are shared between the two species. In this study, we systematically analyzed the alterations of DNA methylation, chromosome architecture, and gene expression in fibroblast primary cells from human BWS patients and bovine LOS fetuses and explored the association among these changes.
Results and Discussion
For human, five controls (CON_H) and 18 BWS individuals were used for analyses. The BWS group is divided into three subgroups according to molecular subtypes, namely imprinting center 1 gain of methylation (BWS_IC1_GOM, n=3), imprinting center 2 loss of methylation (BWS_IC2_LOM, n=12), and CDKN1C variant (BWS_CDKN1C_Mut, n=3). For bovine, the experimental groups were control (CON_B, n=5) and LOS (LOS, n=5). It should be noted that one of the LOS samples, LOS_#1, is considered an outlier according to all the sequencing results, therefore it is excluded from the results presented in the main document. Data including LOS_#1 is available in the supplement (LOS_All group, n=6). For each statistical test, overall (non-sex-specific) and sex-specific comparisons between groups were conducted for human and bovine.
The sex of human patient BWS_16_Mut shows conflict between all the sequencing results (female) and hospital record (male), so it was excluded from the sex-specific comparisons. Given that BWS and LOS have been characterized as loss-of-imprinting conditions [2,22], parental allele-specific comparisons were performed using the bovine animal model as this type of analysis is not possible with the human samples. A summary of performed comparisons and numbers of statistically significant differences for all the analyses can be found in Table 1 (index 1-36).
DNA methylation profile in BWS and LOS
Whole genome bisulfite sequencing (WGBS) was conducted for human and bovine fibroblast samples to determine CpG methylation status. Read alignment information can be found in Table S1. Differentially methylated regions (DMR) were determined for all the comparisons in Table 1 and the DMR details can be found in Table S1.
Principal component analysis (PCA) clusters the majority of BWS samples while the control samples are more dispersed (Figure S1A), perhaps due to limitations in obtaining age matched healthy human samples. Similarly, hierarchical cluster analysis groups most of the BWS samples irrespective of subtype (Figure 1A). 5,708 DMRs were detected when comparing all the BWS samples together with the control group, and ∼66% of these DMRs were hypermethylated (Figure 1A). A greater number of DMRs were detected between BWS and controls when each subtype was analyzed independently, and hypermethylation was observed in 67% of DMRs in IC2 LOM group, 30% in IC1 GOM group and 96% in the CDKN1C variant group (Figure S2A, B, C). We next compared the methylomes of the three BWS subtypes and identified clear and specific differences between them (Figure S2D, E, F). For bovine samples, 10,860 DMRs were identified in LOS with ∼75% of those being hypermethylated (Figure 1B), as per the overall BWS analysis.

(A) and (B) DMR for human BWS group compared with control group (A), and bovine LOS group compared with control group (B). The left panel is the heatmap with hierarchical clustering and sex annotation which include male (M), female (F), and conflict (C). The right panels are the distribution of genomic contexts at the DMR (centered) and surrounding regions. Genomic contexts include 1kb promoter, exon, intron, CpG island, predicted CTCF binding sites, public CTCF ChIP-seq peaks, and repetitive sequences. The line chart on top of each panel is the average enrichment score for all the DMRs. (C) Number of unique and overlapped DMRs between BWS IC2 LOM subtypes and LOS.
The predominant epimutation in BWS is loss of methylation (LOM) on maternal allele at the imprinting control region (ICR) of KCNQ1OT1, namely imprinting center 2 (IC2; i.e. KvDMR1), which accounts for ∼50% of documented cases [2]. Normal levels of DNA methylation at this ICR should be ∼50%, since only the maternal allele is normally methylated. Average DNA methylation at this locus (i.e. chr11:2719755-2722554) was 17.59% in fibroblasts from IC2 patients and 45.18% in control samples, indicating LOM in this BWS subtype. This LOM at IC2 is not complete (0%), because the epimutations in BWS are mosaic which lead to a mixture of affected and not affected cells [2].
Hierarchical clustering based on these DMRs separated most BWS with IC2 LOM samples away from controls (8/12; Figure S2B). No clustering based on sex was observed. To further investigate whether the other four IC2 LOM samples that intermixed with controls could be considered a novel IC2 subgroup, we subdivided the IC2 LOM group into subgroup 1 (BWS_IC2_LOM_S1, n=8) and 2 (BWS_IC2_LOM_S2, n=4) and compared them with the control group and each other. Subgroup-specific comparisons against controls identified a larger number of DMRs (23,582) in subgroup 1 than in subgroup 2 (1,915). 672 DMRs were identified as shared between the two IC2 LOM subgroups (Figure 1C). We then compared DMRs between LOS and the two IC2 LOM subgroups and found that 2.89% (683) DMRs of subgroup 1 and 1.93% (37) DMRs of subgroup 2 are shared with LOS (Figure 1C and Table S1). In total, 17 DMRs were shared between the two IC2 LOM subgroups and LOS, including at the promoters of KCNQ1OT1 (i.e., KvDMR1) and HOXA-AS2 and gene bodies of the epigenetic modifiers HDAC4 and PRDM8 (Figure 1C and Table S1). Further, one of the shared DMRs is in the gene body of NR2F1-AS1, a gene associated with tumors reported in BWS, namely rhabdomyosarcoma and hepatocellular carcinoma [45].
The second most common epimutation in BWS (∼5% of cases [2]) is gain of methylation (GOM) at the H19/IGF2 imprinted domain (i.e. IC1). Compared to controls, fibroblasts from BWS IC1 samples have 19.09% more DNA methylation at chr11:2015075-2022914, which encompass the IC1 and the entire H19 gene body. This synchronized DNA methylation change in IC1 and H19 gene body has also been reported in recurrent spontaneous abortion patients [46]. Cluster analysis of the DMRs grouped the three BWS samples with IC1 epimutation away from controls (Figure S2A). No clustering based on sex was observed. Heritable genetic mutations (including large-scale chromosomal rearrangement but not uniparental disomy) caused loss-of-imprinting accounts for up to 9% of BWS cases [2]. Specifically, genetic mutations at the CDKN1C gene occur in ∼5% of BWS cases [2]. Figure S2C shows the cluster analysis of DMRs between BWS with CDKN1C variant and controls. Of note, no IC1 or IC2 epimutations were detected in this subgroup.
Sex-specific comparisons of the IC2 LOM subtype identified a larger number of DMRs in males than females when compared to controls (53,488 vs. 26,459, respectively). As per BWS, LOS males have twice the number of methylome epimutations than females (75,370 and 34,270 DMRs, respectively). Interestingly, DMRs in male LOS are mainly hypermethylated while DMRs in female LOS are mainly hypomethylated (Figure S3B and S3C).
Allele-specific methylation analysis in the bovine control group clearly separates the maternal and paternal alleles in the PCA plot (Figure S1C) and identified 10,143 DMRs between the parental alleles, with the majority (>99%) being hypomethylated on the paternal allele (Figure S3D). Some of the identified DMRs overlap with known imprinted genes and exhibit the expected allelic patterns. For example, lower paternal methylation at IGF2R ICR (89.37%; chr9:96222606-96223965), lower paternal methylation at IC2 (89.55%; chr29:48908847-48909926), and higher paternal methylation at IC1 (68.16% and 73.02% at chr29:49504687-49505606 and chr29:49507607-49510366, respectively). Interestingly, there seems to be a spread of DNA methylation on the paternal allele from the IC1 to H19, creating allelic specific methylation over the gene body (chr29:49511527-49512886) with 9.70% methylation on maternal allele and 55.24% on paternal allele. Allele-specific comparisons between LOS and controls, identified that both alleles are mainly hypermethylated in LOS, which is similar to the finding of the overall comparison (Figure S3E and S3F). However, the LOS-associated allele-specific DMRs are, for the most part (>80%), not shared between the parental alleles. As expected, the normally methylated maternal allele of the IGF2R ICR (chr9:96222606-96223885) is hypomethylated in LOS when compared to controls, similar to what has been previously published by us and others [21,24]. We have previously reported maternal LOM at IC2 in some LOS fetuses [7]. In the current study, one LOS fetus (LOS_#3, the heaviest female) shows a 54.36% decrease in DNA methylation at maternal IC2 (chr29:48908887-48909846) than the control group mean (90.98%). However, the group mean difference between LOS and control is 14.7% at maternal IC2 which does not pass the 15% filtering threshold and is not included in the results, although it indeed shows some level of hypomethylation. Similar to our previous findings, maternal hypermethylation at IC1, was not observed in LOS, however, we detected hypermethylation at IC1 (chr29:49504927-49505566, 17.98%) and the H19 gene body (chr29:49512727-49512926, 21.02%) on the paternal allele, which is a novel finding of unknown significance.
Overall, hypomethylated DMRs in BWS and LOS (including overall, sex-specific, and allelic-specific comparisons) are significantly enriched for gene body, exon, intron, CpG island, CpG shore, CpG shelf, predicted CTCF binding sites, and public CTCF ChIP-seq peaks, and depletion for repetitive sequence according to permutation tests (Figure 1, S2, S3, and Table S1). Hypomethylated DMRs also show significant enrichment for gene promoter (1kb) in BWS related comparisons and LOS allele-specific comparisons. For hypermethylated DMRs in most of the LOS and BWS comparisons, there is also enrichment for CpG island, CpG shore, CpG shelf, and CTCF binding sites. However, the pattern is varied for gene promoter, exon, intron, and repetitive sequence based on sex and BWS subtype. For example, BWS with IC2 LOM and BWS with IC1 GOM show enrichment at these elements but BWS with CDKN1C variant shows depletion.
Interestingly, among the top 50 more severely dysregulated regions (both hyper– and hypomethylated) in the BWS with IC2 LOM group, 11 hypomethylated DMRs overlap the gene promoter and/or body of several HOX genes, including HOX A3, A4, A5, A6, A7, B7, B9, C4, C10, and D4 from four HOX clusters located on chromosome 7 (A), 17 (B), 12 (C), and 2 (D) (Figure 2 and Table S1). Most of these genes also had hypomethylated DMRs in the BWS with IC1 GOM group. For example, the gene body of HOXC4 (chr12:54446778-54448977) had a 41.17% decrease in the BWS IC2 LOM group and 58.58% decrease in the BWS IC1 GOM group. Further, the promoter of HOXD4 (chr2:177015615-177017974) also had reduced DNA methylation in these groups (30.26% and 36.05%, respectively). In LOS, HOX A3, A5, A6, B3, C4, C10, D4, and D11, also have modest alterations (15%-20%) in DNA methylation when compared to controls. HOX genes play roles as both oncogenes and tumor suppressors in regulating cell proliferation and differentiation [47]. Both hyper– and hypomethylated HOX genes are frequently observed in cancer, including Wilms tumor, which is the most commonly diagnosed tumor in BWS [47,48]. HOX genes are important transcription factors during embryonic development and exhibit spatial and temporal-specific expression patterns [49]. In human, the number in the name of HOX genes are based on their order of spatial expression pattern with HOX 1 being expressed in the most anterior side (i.e. the head) and HOX 13 is the most posterior side (i.e. the trunk) [47].
HOX 1 to 4, expressed in the head region, are more frequently associated with DMRs in BWS, especially HOX 4. This observation may be partially the result of the source of our BWS fibroblast cells as some samples were collected from the skin behind the ear; further studies with various sources of fibroblasts will be needed to validate this finding. Importantly, hypomethylated DMRs were identified in the top DMR lists in the IC2 LOM and IC1 GOM when compared to BWS with CDKN1C variant. Identified DMRs in BWS reflect altered HOX expression during embryonic development and have the potential to serve as molecular markers to diagnose and distinguish different subtypes.

(A) HOXA cluster. (B) HOXB. (C) HOXC. (D) HOXD. Top panel is human genome and bottom panel is bovine genome for each plot. Additional gene annotation from NCBI RefSeq is added since some HOX genes are not annotated in the R package for UCSC annotation. All the HOX genes from the same cluster are located on the same strand. The order of HOX genes may be opposite for human and bovine.
In summary, the abovementioned findings demonstrate methylome distinctions between the epigenetically– and also the genetically-identified syndrome beyond the signature DMRs or deletions. BWS children have up to a 28% risk of developing tumors and currently, only 80% of patients can be corroborated molecularly, future studies will need to be performed to determine their usefulness in diagnosing these children better and more specifically.
Gene expression profile and alternative splicing events in BWS and LOS
Ribosomal RNA depleted total RNA sequencing was conducted to determine the global transcript profile in human and bovine fibroblast samples. In accordance with the cell-type used here, extracellular matrix genes show high expression level in both species, including collagen (COL1A1/2, COL3A1, COL5A1/2, COL6A1/2/3, and COL12A1), thrombospondin (THBS1), vimentin (VIM), filamin (FLNA), fibronectin (FN1), and tenascin (TNC). Differentially expressed genes (DEGs) were determined for all the comparisons in Table 1 and the DEG details can be found in Table S2.
The transcriptomes of the human fibroblasts are not distinct between them and as a result the samples are intermixed in the PCA (Figure S1D). Twelve DEGs were detected when all BWS samples were compared to controls and were all downregulated in BWS. Those genes were LINGO2, MDGA2, NGFR, MIR92A1, FLG, BMP2, SIGLEC15, SLAMF7, LIPH, and three novel genes. Downregulation of MDGA2, NGFR and BMP2 have been reported in tumorigenesis [50–52]. DEG based hierarchical clustering separates each of the BWS subtypes from the control samples (Figure 3B); however, no obvious clustering based on sex was observed in the IC2 LOM group. Subtype-specific analyses revealed that 23 genes were different from controls in IC1 GOM, 8 in IC2 LOM and 10 in CDKN1C variant (Figure 3A, 3B, and 3C). When the subgroups of IC2 LOM were taken into consideration, 742 transcripts were identified as different from controls in subgroup 1 and two in subgroup 2. Nine DEGs were shared between IC2 LOM subgroup 1 and IC1 GOM (Table S2), making them potential subtype-specific biomarkers. Those were the upregulated GRID1, KCNA4, SESN3, GOLGA8CP, NTRK3, NKD1, and the downregulated PTPRE, GPRC5A, and SERPINB2. The other DEGs were unique to each BWS subtype. Some of the DEGs are associated with tumorigenesis, including downregulation of LOXL4 in BWS with IC1 GOM, upregulation of PECAM1 in BWS with IC2 LOM, and downregulation of TAP2 in BWS with CDKN1C variant [53–55]. In addition, SESN3 is involved in insulin sensitivity and in tumorigenesis [56,57]. There was no significant group difference, however, in transcript abundance for the signature imprinted genes of BWS (e.g. H19, IGF2, CDKN1C, and KCNQ1OT1) in these comparisons. High variations in transcript level were observed for H19 and IGF2 in the control group (more than 70-fold difference between the highest and lowest individual). IGF2 transcript abundance was very high in BWS_#11 (IC2 LOM) and #16 (CDKN1C variant), more than four times higher than the highest control sample, and KCNQ1OT1 level was three-fold higher than controls in BWS_#7 and #11 (IC2 LOM).

DEG for human BWS subtypes compared with control group (A-C), and bovine LOS group compared with control group (D). The left panel is the heatmap with hierarchical clustering and sex annotation which include male (M), female (F), and conflict (C). Gene expression is shown as log2 transformed difference between sample and row average. The right panels are the distribution of genomic contexts at the DEG (centered at 1kb promoter or gene body) and surrounding regions. Genomic contexts include differentially methylated regions (DMR), differential interacting regions (DIR), differential topologically associating domains (diff_TAD), and differential compartments identified in corresponding group comparisons. The line chart on top of each panel is the average enrichment score for all the DEGs.
For bovine, PCA separates the samples based on treatment (Figure S1E) although not by parental allele (Figure S1F) indicating similar expression profiles from both alleles. Transcriptome comparison between LOS and controls identified 112 DEGs and hierarchical clustering clearly separated the two groups (Figure 3D). As expected, the signature imprinted gene of LOS (IGF2R) was found downregulated two-fold in the LOS group. IGF2R is normally highly expressed from the maternal allele and its protein can bind to IGF2 protein with high affinity to mediate the degradation of excess IGF2 [58]. Studies in mice have shown that maternal inheritance of Igf2r null variant causes increase of IGF2 and IGF binding proteins, ∼25%-30% increase of body weight, proportionately increased organ size, and perinatal death [59]. The overgrowth phenotype in LOS could be largely attributed to changes in the IGF2 signaling pathway. In addition, several DEGs in LOS have also been reported in tumor studies in human, such as downregulation of AOX1, CYGB, and TMOD2, and upregulation of BCL11A, AGRN, and LEF1 [60–65]. Four DEGs were shared between LOS and BWS IC2 LOM subgroup 1, namely the upregulated EMID1, and the downregulated SERPINE2, LRRC8D, GPX1. When analyzing the transcriptome in a sex-specific manner, male LOS has 109 DEGs when compared to controls while the number of DEGs is doubled in female LOS (213). Of those DEGs, eight were detected in both male and female LOS, namely FBLN7 (down/down in male/female), CYGB (down/down), LOC112446407 (up/up), ABLIM3 (down/down), IGF2R (down/down), and three novel genes MSTRG.7897 (up/up), MSTRG.13383 (up/down), and MSTRG.22799 (down/up). Downregulation of ABLIM3 has also been reported in hepatocellular carcinoma [66].
Allele-specific comparison in the bovine control group identified 122 genes with significant biased expression from one allele, including IGF2R which has about three-fold higher expression from the maternal allele than the paternal allele. In addition, GSTK1, MAN1B1, GSTZ1, ARSG, SLC25A29, TLDC1, PDIA4, RWDD2A, and NARS have been reported as imprinted genes or to have biased allelic expression in various mammalian species by other researchers[67–75]. The allelic expression pattern of Gstz1 is associated with expression quantitative trait loci (eQTL) in mice [67].
SLC25A29, together with our previously reported BEGAIN [76], show biased paternal expression and are located close to the DLK1-DIO3 imprinted domain, which suggest broader regulatory impacts of this domain in bovine. TLDC1 is associated with gamete-specific promoter methylation patterns in human [77]. Although not possible to determine the imprinting status of the remaining genes in this study, as we only have F1 samples with one parental cross (i.e. B.t. indicus X B.t. taurus), other genes in the list should be further characterized to determine if they are imprinted or rather they behave as eQTL as we have previously shown [78].
Allele-specific DEGs were identified in LOS. IGF2R shows a significant decrease (∼2.4 fold) from the maternal allele making it similar in expression level to the paternal allele. The expression of this gene from the paternal allele in LOS was similar to control. In addition, among the 122 genes with biased allelic expression in controls, ECHDC2 has higher paternal expression in controls and is downregulated on the paternal allele in the LOS group, and IGF1R has lower maternal expression in controls and is upregulated on the maternal allele in LOS group. ECHDC2 is involved in branched chain amino acid metabolism and its lower expression increases cell viability, and IGF1R encodes a membrane receptor for the IGF signaling and is positively correlated with growth [79,80].
Regarding the association between changes in gene expression and DNA methylation, upregulated DEGs in female BWS with IC2 LOM group showed enrichment for hypomethylated DMRs at promoter and gene body, and downregulated DEGs in this group showed enrichment for both hypo– and hypermethylated DMRs at promoter and gene body according to permutation tests (Table S2). In addition, upregulated DEGs in LOS group showed enrichment for both hypo– and hypermethylated DMRs at promoter and hypomethylated DMRs at gene body, and downregulated DEGs in this group showed enrichment for hypermethylated DMRs at promoter and gene body. Given that DMRs overlapping exons can influence alternative splicing, we analyzed the total RNA sequencing data to identify alternative splicing (AS) events in BWS and LOS [81]. For humans, 1,183, 1,292, and 1,151 AS events were identified in BWS with IC1 GOM, IC2 LOM, and CDKN1C variant groups when compared to the control group (Figure 4A, S4A, S4B, and Table S2). For bovine, 746 AS events were detected in the LOS group when compared to the control group (Figure 4B and Table S2). Regardless of species or subtypes, most AS events were skipped exons with an average of 43.5% across pairwise comparisons. AS events appeared to be evenly distributed across chromosomes in BWS and LOS. Few genes shared alternative splicing events between BWS and LOS, however, we did find instances of shared splicing events in pathways relevant to overgrowth. For example, genes involved in the WNT signaling pathway (TCF7L2, HDAC1, PRKC1) had skipped exons in both BWS with CDKN1C variant and LOS groups. WNT signaling pathway regulates cell proliferation and differentiation, and is associated with Hippo pathway to control organ size [82]. YAP1, which is a transcription co-activator in Hippo pathway, has been reported with increased non-phosphorylated (active) protein level in skeletal muscle of LOS fetuses by us [26]. Although none of the exons of the mentioned genes were differentially methylated, these data suggest alternative splicing as a contributor or outcome of the overgrowth phenotype.

(A) and (B) The genomic distribution, numbers, and types of alternative splicing events identified in human BWS IC2 LOM (A) and bovine LOS (B) groups when compared to their control groups. Manhattan plots show alternatively spliced genes aligned along the x-axis by their position on the chromosome and on the y-axis by their log10(false discovery rate). The horizontal dashed black line represents a significance threshold of 0.05. (C) Correlation between gene expression profile in 15 modules and BWS diagnosis and scores determined by weighted gene co-expression network analysis (WGCNA). Numbers in the heatmap represent correlation coefficient. Significance is shown as * (<0.05), ** (<0.01), and ns (≥0.05) in parentheses. (D) Gene interaction network within purple module and hub genes were highlighted.
To understand the correlation between transcriptional regulation and phenotypic characteristics of human BWS features, weighted correlation network analysis (WGCNA) was performed to determine gene clusters with high correlation in BWS. As a result, genes were grouped into 15 modules based on similarity of expression. The grey and purple modules showed a positive correlation (p-value < 0.05) with macroglossia and omphalocele (Figure S4C) suggesting that genes with high expression in these modules may serve as biomarkers of these BWS pathologies. Other suggestive features such as a birthweight greater than two standard deviations (Birthweight_2SDs), facial nevus simplex, and ear creases or pits also showed higher correlation with purple modules (Figure S4D). Based on the standard of BWS scoring from Wang’s study [83], a comprehensive BWS score was generated for each individual and expressional trends of purple module showed a significantly positive correlation with BWS score compared to other modules (Figure 4C). The 94 genes in this module showed enriched functions in RNA processing and regulation of immune system process (Table S2). Among the genes within the purple module, 21 hub genes with high BWS score correlation (BWS correlation ≥ 0.5) and module membership score (MM_purple ≥ 0.8) were identified (Figure 4D and Table S2), and one of these genes, Myb-Like, SWIRM And MPN Domain-Containing Protein 1 (MYSM1) is a transcription coactivator and participates in chromatin remodeling and repression of innate immunity and autoimmunity [84].
KCNQ1OT1, a long-noncoding RNA implicated in BWS, was also enriched [83]. In addition, MIR145 which encodes has-miR-145-5p was enriched in this module, which has been reported to be differentially expressed in BWS patients with macroglossia by us [26].
Characterization of chromosome architecture in human and bovine
Hi-C sequencing was performed to determine genome-wide chromosome architecture and its relationship with the methylome and transcriptome in human and bovine fibroblasts. Read alignment information can be found in Table S3.
We first characterized the two fundamental elements of chromosome architecture, namely chromosome compartments and topologically associating domains (TAD), in the human and bovine control groups (Table S3). For chromosome compartment, the A (positive eigenvalue, enriched in euchromatin) and B (negative eigenvalue, heterochromatin) compartments each roughly occupies half of the sequenceable autosomal genome in human (49.4% for A and 50.6% for B) and bovine (47.3% and 52.7%). Sex-specific and allele-specific analyses show a similar ratio (Table S3). 13,912 and 12,699 TADs (including sub-TADs) were found in the autosomes of human and bovine control groups, respectively, with similar TAD length distributions (Figure 5A, 6A, and Table S3). BWS, LOS, and sex-specific groups have similar TAD length distribution as their corresponding control group. For bovine allele-specific groups, the TAD length is decreased likely due to largely reduced read coverage after filtering for the parental alleles. The TAD boundaries in both species and all groups show enrichment for predicted CTCF binding sites, public CTCF ChIP-seq peaks, transcription start sites, and CpG islands, and depletion for repetitive sequences (Figure 5B and 6B).

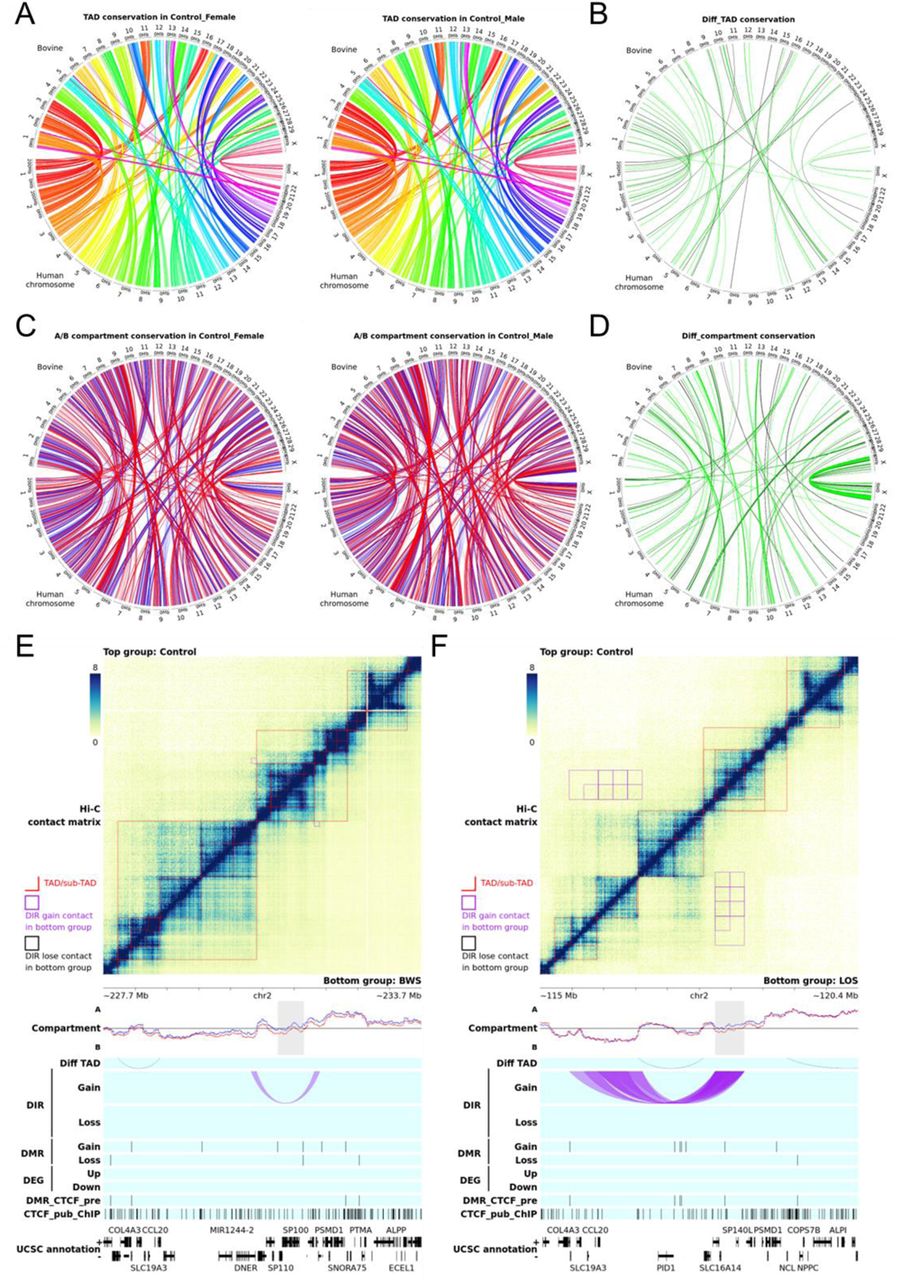
(A) Length distribution of topologically associating domains (TAD) detected in control group. Level 1 TAD refers to the outmost TADs. The red line marks the median length. (B) Genomic context enrichment at control group TAD and subTAD boundaries (centered) and flanking regions. Genomic contexts include predicted CTCF binding sites, CTCF public ChIP-seq peaks, transcription start sites (TSS), CpG island, and repetitive sequences. The line chart on top of each panel is the average enrichment score for all the boundaries. (C) Genome-wide distribution of differentially methylated regions (DMR), differential compartments (diff_compartment), differential TAD (diff_TAD), differential interacting regions (DIR) frequency, and differentially expressed genes (DEG) identified when comparing BWS group with control group. Red dots indicate an increase in CpG methylation, eigenvalue (towards A compartment), and expression level, and black dots indicate decrease. The vertical location of dots indicates the level of changes. Mb = megabases. (D) Correlation between chromosome compartment changes (measured by eigenvalue) at gene promoters and log2 transformed fold change (logFC) of protein-coding genes and lncRNA. The left panel shows genome-wide correlations, and the right panel shows correlation at regions of differential compartment. (E) Examples of alterations of chromosome architecture associated with gene expression changes in BWS patients. The top matrix plot shows the Hi-C contacts at 10kb resolution. A deeper blue color indicates higher physical contact frequency. Red lines mark the TADs. All the statistical analyses are conducted by comparing the bottom right group with the top left group. Tracks below the matrix show the location of different elements along this genomic region. The compartment track shows the A/B compartment represented by eigenvalue. The blue and red lines indicate the top left and bottom right group, respectively. The grey area marks significantly differential compartments between groups detected at different resolutions which may overlap and show deeper color. The diff_TAD tracks show the differential TADs in the bottom right group. The DIR tracks show the DIRs that gain or lose contact. The DIRs are also marked in the matrix with purple or black squares. The DMR tracks show DMRs that gain or lose CpG methylation. The DEG tracks show up– or down-regulated DEGs. The DMR_CTCF_pre track shows predicted CTCF binding sites that overlap with DMRs. The CTCF_pub_ChIP track shows the public CTCF ChIP-seq peaks. The UCSC annotation tracks show the UCSC gene annotation. (F) Contact frequency changes between DEG SESN3 and super-enhancers on Chromosome 11 (position denoted on the X axis) in BWS IC1 GOM group. Two genes (not DEG) surrounding SESN3 are also plotted for comparisons.
Chromosome architecture disruption in BWS and LOS
Differential chromosome compartments were detected between groups at 1 mb, 500 kb, 250 kb, 100 kb, 50 kb, and 25 kb resolutions for all the comparisons in Table 1 (Table S4). Differential TADs were detected between groups at 25kb resolution for all the comparisons in Table 1 (Table S5). The group mean Hi-C contact matrix was used for the differential TAD analysis instead of all individual samples in each group, due to software limitations. Types of differential TAD between groups are categorized as loss, strength change, merge, split, zoom, and complex (for description refer to Methods). In addition, differentially interacting regions (DIR) were detected for binned genomic regions between groups at 1 mb, 500 kb, 250 kb, 100 kb, and 50 kb resolutions for all the comparisons in Table 1 (Table S6), and changes are shown as gain and loss in contact frequency. Changes in chromosome architecture were associated with DEGs according to permutation tests. For example, upregulated DEGs in BWS with IC1 GOM group showed enrichment for differential compartment with increased eigenvalue (change towards A compartment) at promoters, downregulated DEGs in female BWS with IC1 GOM group showed enrichment for differential TAD at promoters, and downregulated DEGs in LOS group showed enrichment for differential compartment with decreased eigenvalue at promoters (Table S2). Together with the previously mentioned association between DEGs and DMRs, these observations indicate that the causes of gene misregulation in BWS and LOS are diverse and there is not a single dominant mechanism.
For human BWS subtypes, BWS with IC1 GOM group has higher number of unique differential compartments with longer length (50 and 500 kb for 25th and 75th percentile, same format below) than BWS with IC2 LOM (50 and 300 kb) and BWS with CDKN1C variant (50 and 400 kb) groups when compared to the control group (Table 1 and S4). Increased number and decreased length of unique differential compartments were found in sex-specific comparisons, including male BWS with IC2 LOM (25 and 200 kb), female BWS with IC1 GOM (25 and 250 kb), female BWS with IC2 LOM (25 and 125 kb), and female BWS with CDKN1C variant (25 and 250 kb). For bovine, the lengths of unique differential compartments in the LOS group (250 kb and 1 mb) are longer than any of the human BWS subtypes. Unique differential compartments in male LOS (100 kb and 1 mb) are lower in number but longer in length than female LOS (25 and 250 kb), and in LOS maternal allele (25 and 500 kb) are also lower in number but longer in length than LOS paternal allele (25 and 75 kb).
Given the prevalence of differential compartments in BWS and LOS, Pearson correlation tests were performed between eigenvalue changes at gene promoters, which reflect A/B compartment changes, and expression changes of all protein-coding genes and lncRNA (not just DEGs). Small RNA genes were not included in the test due to the uncertainty of their promoter locations. For genome-wide test, a very weak positive correlation was observed for both BWS (correlation coefficient equals to 0.078) and LOS (0.13; Figure 5D and 6D). The positive correlation increased in BWS (0.32) and LOS (0.29) when only considering the differential compartment regions, which indicates that the compartment changes have impacts on gene expression regulation in the differential compartment regions (Figure 5D and 6D). The same trend was detected in most other BWS and LOS involved comparisons excluding BWS with IC2 LOM, female LOS, and female LOS paternal allele (figure not shown). These exceptions have similar weak correlation at differential compartment regions as their genome-wide correlation, which indicates the compartment changes have less impact on gene expression in these groups. Interestingly, the differential compartments in these exceptions have a relatively shorter length as mentioned before. The Pearson correlations between eigenvalue changes and methylation changes at DMRs are generally very low (correlation coefficient absolute values are less than 0.05) in BWS and LOS involved comparisons (figure not shown).
BWS with CDKN1C variant group had the highest number (286) of differential TAD among BWS subtypes, while in LOS there were 369 differential TADs when compared to the control group (Table 1 and S5). For sex-specific comparisons, both female BWS with IC2 LOM (695) and female LOS (526) showed a higher differential TAD number than male BWS with IC2 LOM (239) and male LOS (231) respectively, when compared to their controls. This pattern could be related to the genome-wide sex-specific DNA methylation changes. As previously mentioned in bovine, DMRs are mainly hypermethylated in male LOS and occur at regions that have intermediate to high DNA methylation level in the control group. Although these regions are enriched for predicted CTCF binding sites, the normally high DNA methylation level is expected to block the CTCF binding [85] which is seen as depletion of public CTCF ChIP-seq peaks in the heatmap (Figure S3B). And further hypermethylation could have minor impact on CTCF binding change in male LOS. In female LOS, DMRs also mainly occur at regions that have high DNA methylation level in the control group, and have enrichment for predicted CTCF binding sites and depletion for public CTCF ChIP-seq peaks (Figure S3C). However, the global loss of methylation could lead to activation of these potential CTCF binding sites and change the CTCF binding profile and TADs, which is reflected by the higher number of differential TAD detected in female LOS than male LOS. Similarly, male BWS with IC2 LOM also has a higher ratio of hypermethylated DMR than female BWS with IC2 LOM. Another interesting observation is that the boundaries for differential compartments are usually also the boundaries for TADs or sub-TADs, which means TAD is the unit for compartment changes. So, the more frequently disrupted TADs in female LOS may explain the observed higher number but shorter length of differential compartments in female LOS than male LOS, and that the potentially increased active CTCF binding sites in female LOS leads to smaller TADs and further causes fragmentation or length decrease of nearby differential compartments. These shortened differential compartments in female LOS have a much lower impact on gene expression change (correlation coefficient = 0.027) than male LOS (0.27).
Vulnerable chromosomes and chromosomal regions in BWS and LOS
The comparative genomic distribution of DMRs, differential compartments, DIRs, and DEGs are summarized in Figure 5C, 6C, S5, and S6. For humans, when ordering chromosomes by the ratio of total differential compartment length to chromosome length, chr2, 3, 6, 9, 10, 11, 12, 13, 17, 18, and 20 are often in the top ten list in BWS (Figure 5C and S5). It is worth noting that the differential compartments detected on chr9 and 18 are mainly around the unmappable region at the centromere. In sex-specific comparisons, chrX and Y also exhibit frequent compartment changes (figure not shown). For bovine, chr27, 21, 4, 10, 28, 8, 1, 14, 23, and 13 are the top ten in LOS group when ordered by the ratio of total differential compartment length to chromosome length (Figure 6C). Sex-specific comparisons show a somewhat different top ten list for male LOS (chr27, X, 26, 21, 28, 8, 1, 13, 4, 14) and female LOS (chr27, 4, 7, 16, 10, 14, 18, 5, 8, 22; Figure S6B and S6C). When comparing paternal allele to maternal allele in the control group, chr27, 9, 4, and 6 are the most different chromosomes regarding compartment (Figure S6D). Chr27 is largely altered in LOS paternal allele (Figure S6F) and male LOS paternal allele group (figure not shown). Compartment changes on chr9 become frequently detected in LOS involved sex-specific and allele-specific comparisons that female LOS paternal allele shows a similar pattern of change as in Figure S6D, and male LOS maternal allele shows an opposite pattern (figure not shown). Chr4 is largely altered in LOS paternal allele (Figure S6F) and female LOS paternal allele group (figure not shown). Interestingly, the differential compartment pattern on chr4 in LOS paternal allele is almost the opposite of the pattern of allelic comparison in control group (Figure S6D), which suggests the paternal allele of chr4 in LOS has a level of maternalization in chromosome compartment. Chr6 is largely altered in LOS maternal allele (Figure S6E), male LOS maternal allele, female LOS maternal allele, and female LOS paternal allele group (figure not shown).

(A) Length distribution of topologically associating domains (TAD) detected in control group. (B) Genomic context enrichment at control group TAD and subTAD boundaries (centered) and surrounding regions. (C) Genome-wide distribution of differentially methylated regions (DMR), differential compartments (diff_compartment), differential TAD (diff_TAD), differential interacting regions (DIR) frequency, and differentially expressed genes (DEG) identified when comparing LOS group with control group. (D) Correlation between chromosome compartment changes (measured by eigenvalue) at gene promoters and log2 transformed fold change (logFC) of protein-coding genes and lncRNA. (E) Examples of alterations of chromosome architecture associated with gene expression changes in LOS fetuses. Detailed descriptions refer to Figure 5.
The maternal and paternal alleles show a similar large scale (chromosome-wide) genomic distribution of allele-specific DMRs in LOS (Figure S6E and S6F). For example, over 61% of DMRs on chr1 are found in the last 30 mb (19%) of this chromosome in LOS maternal allele and LOS paternal allele. This enrichment is not caused by a biased distribution of genomic variants since the methylation differences between control paternal allele and control maternal allele are evenly distributed on this chromosome (Figure S6D). However, as mentioned before, the precise genomic coordinates of the DMRs are largely not shared (>80%) between maternal and paternal alleles. This observation indicates that the two alleles of certain chromosomes or parts of a chromosome are vulnerable for DNA methylation alterations in LOS, but the alterations are largely not driven by the DNA sequence. The chromosome territory, which refers to the special location of chromosomes in the nucleus, could be involved in this vulnerability. According to human and mouse three-dimensional fluorescence in situ hybridization (3D-FISH) images, many chromosomes have their two alleles separated from each other [86,87]. Evidence have also shown that the two alleles of each chromosome have a symmetrical relative location to other chromosomes in mouse [88]. Assuming bovine has the same features, if changes of microenvironment at symmetrical spaces occur, they could have impacts on the same part of the two alleles. Other large scale chromosome markers may also directly or indirectly contribute to this vulnerability, such as histone modifications, which undergo rapid and dynamic reprogramming during early embryo development, and are known to regulate the de novo establishment of DNA methylation [89–91]. Future studies on chromosome territories in bovine will be needed to understand this process.
Given the very low correlation between DMRs and differential compartments and generally similar genomic distribution pattern of DMRs between maternal and paternal alleles in LOS, the distinct distribution pattern of differential compartments between maternal and paternal alleles suggests that other allele-specific alterations exist in LOS and are involved in the regulation of chromosome compartment, such as histone modifications and non-coding RNAs (ncRNAs). Chromosome compartment is considered mainly regulated by phase separation mechanism that chromatin regions with different physicochemical properties form distinct phases; phases with different properties are spatially separated and phases with similar properties are clustered [92,93]. Histone modifications and ncRNAs have been found to attract binding proteins with intrinsically disordered domains that can lead to phase separation and compartment change [94–96]. In addition, studies in mouse have shown that the maternal and paternal alleles exhibit distinct histone modification profiles in early embryo, which may account for possible allele-specific disruptions [89,91]. Future studies on the histone modification profiles and ncRNA nuclear localization in BWS and LOS will help build the connection and improve the understanding of the underlying mechanisms.
Association among DMRs, altered chromosome architectures, and DEGs in BWS and LOS
Several genomic regions are shown to illustrate the possible impact of DNA methylation and chromosome architecture on gene expression changes in BWS and LOS (Figure 5E, 6E, S7, and S8). For humans, gene sestrin 3 (SESN3) is upregulated and located within a differential compartment region that changes toward A compartment in BWS with IC1 GOM group, and no DMR is found within gene body or promoter of SESN3 (Figure 5E). Downregulated gene platelet derived growth factor subunit A (PDGFA) resides in an A compartment region that gains contact with a B compartment region in female BWS with IC2 LOM (Figure S7A). A small change toward B compartment is observed although not significant, and two hypomethylated DMRs overlap the gene body and promoter of PDGFA. Gene IQCJ-SCHIP1 readthrough (IQCJ-SCHIP1) is downregulated but located within a differential compartment region that changes toward A compartment in female BWS with CDKN1C variant group, and the promoter and first exon of IQCJ-SCHIP1 overlap with a hypermethylated DMR (chr3:158785716-158788035, 12.33% increase) which was excluded in Table S1 due to the 15% difference cutoff (Figure S7B). These changes are also shown in female comparison with the other two BWS subtypes (figure not shown), which indicates the alterations around IQCJ-SCHIP1 are specific to this BWS subtype.
For bovine, gene KIT ligand (KITLG) is downregulated and located within a differential compartment region that changes toward B compartment in LOS group, and no DMR is found within gene body or promoter of KITLG (Figure 6E). The 5 mb upstream region of the DLK1-DIO3 imprinted domain shows different patterns of chromosome compartment in male control and female control, with sex-specific changes in male LOS and female LOS (Figure S8). A gigantic TAD (4 mb) is observed mainly belonging to the B compartment in male control but not in female control. The upregulated gene BCL11 transcription factor B (BCL11B) resides in this 4 mb TAD which changes toward A compartment in male LOS group, and overlaps with multiple DMRs (mainly hypomethylation) in the gene body (Figure S8A). In female LOS, the 4 mb TAD is not altered, but a small region that changes toward B compartment overlaps with downregulated gene bradykinin receptor B2 (BDKRB2), and a hypermethylated DMR is found in its gene body (Figure S8B). We have previously reported dysregulation of multiple microRNAs in the DLK1-DIO3 imprinted domain in both BWS and LOS [26], and further investigation will be needed to validate whether this is a consequence of compartment changes.
As mentioned before, DNA methylation at promoters and enhancers have repressive impacts on gene expression through blocking binding sites for transcription factors [97]. Chromosome compartments also have impacts on gene expression. The B compartments are enriched for heterochromatin, mainly localized in the peripheral regions in the nucleus or surrounding the nucleoli, and isolated from areas with enrichment of transcription machineries (such as transcription factories) [98–102].
Oppositely, the A compartments are enriched for euchromatin, mainly localized in the interior of nucleus between the two B compartment regions and associated with transcription factories. The example loci above suggest a model that changes of DNA methylation and chromosome compartment in BWS and LOS can simultaneously affect gene expression in an independent manner. In the DEG examples of human SESN3 and bovine KITLG, BCL11B, and BDKRB2, no DMR was found at the promoters of these DEGs, and their expression changes follow the alterations of their chromosome compartments that changing towards A compartment leads to upregulation and changing towards B compartment leads to downregulation. In the example of human DEG PDGFA, the hypomethylated DMR at its promoter will further open the promoter for transcription factor binding, however, its spatial change towards B compartment will reduce the availability of transcription machineries in its surrounding microenvironment. In the opposite example of human DEG IQCJ-SCHIP1, its spatial change towards A compartment will provide more transcription machineries, but the hypermethylated DMR at its promoter will prevent their binding. So, in these two cases, DNA methylation and chromosome compartment form an antagonistic situation where the one with more severe change or stronger effect might overcome the effect of the other on gene expression regulation. This model could explain some of the conflicts between promoter DNA methylation changes and gene expression changes observed in our BWS and LOS datasets. In addition, alterations in TAD and chromosome compartment in BWS and LOS could change enhancer availability and contacts with gene promoters, and further affect gene expression. To investigate this mechanism, we embarked on the identification of long-range contacts between super-enhancers from dbSUPER database and promoter of the DEG SESN3 in BWS IC1 GOM group as an example. SESN3 showed increased promoter contacts with the super-enhancer region chr11:86430802-86457226, chr11:86168452-86236631, and chr11:85855833-85863446 from the closest upstream broad A compartment (Figure 5F). These super-enhancers could also contribute to the upregulation of SESN3 in BWS.
Conservation between human and bovine
Next, we investigated the conservation of TAD and chromosome compartment between human and bovine genomes. For TAD in the control groups (with both sexes included) a corresponding genomic region of the majority of human TADs can be found in bovine (13,425 out of 13,912). Over these regions, 2,065 (∼15.4%) human TADs were found conserved in bovine with greater than 90% overlapping in both species (Table S7). For sex specific analyses that include chrX, 1,960 (∼13.7%) and 2,032 (∼13.9%) human TADs were conserved in bovine for male and female control group, respectively (Figure 7A and Table S7). For chromosome compartments in the control groups (with both sexes included), continuous 25 kb bins with the same A or B compartment assignment were merged that results in 4,086 regions in human, and a corresponding genomic region can be found in bovine for most of them (3,713). Over these regions, 1,813 (∼48.8%) human compartments were found conserved in bovine with greater than 90% overlapping in any species (Table S7). For sex specific analyses that include chrX, 2,569 (∼47.6%) and 1,989 (∼46.8%) human compartments were conserved in bovine for male and female control group, respectively (Figure 7C and Table S7). For both TAD and chromosome compartment, the conservation pattern is similar between male and female for autosomes but is different for chromosome X, which is expected for inactivated X to show megadomain (lose TADs) and change towards B compartment in female.

(A) Genome-wide conservation of control group topologically associating domains (TAD) between human and bovine. Each line indicates a conserved TAD. Different colors refer to different human chromosomes. Mb = megabases. (B) Overlapped differential TAD identified in some comparisons of Beckwith-Wiedemann Syndrome (BWS) and large offspring syndrome (LOS). Information regarding comparisons used refer to Methods. Each line indicates a shared differential TAD between combined BWS and LOS results with greater than 90% overlapping in both species. Green and black refer to shared differential TAD with same and different type between BWS and LOS, respectively. (C) Genome-wide conservation of control group A/B compartment between human and bovine. Each line indicates a conserved compartment. Red and blue refer to A and B compartment, respectively. (D) Overlapped differential compartments identified in BWS and LOS. Each line indicates an overlapped differential compartment. Green and black refer to differential compartments with same or opposite direction of change between BWS and LOS, respectively. (E) and (F) An example region of conserved chromosome architecture in control group between human and bovine, and shared compartment changes between BWS and LOS. Detailed descriptions refer to Figure 5E.
Similar approaches were used to find shared differential compartments between BWS and LOS. For humans, the lists of differential compartments from BWS involved comparisons (index 1, 2, 3, 4, 8, 9, 10, 11, and 12) were combined, which resulted in 2,117 records (allowing overlap and identical records), and a corresponding genomic region can be found in bovine for 1,689 records. The combined bovine list from LOS involved comparison (index 16, 18, and 19) contains 1,118 records. In total, 772 (∼45.7%) records of differential compartments from human overlap with bovine records without a cutoff for overlap percentage and regardless of direction of change (Figure 7D and Table S7). If the overlap cutoff in both species is set to 20%, 50% or 80%, 193 (∼11.4%), 80 (∼4.7%) or 28 (∼1.7%) records will remain, respectively. Chromosome X, 6, 10, 9, 7, and 2 in human have the highest number of overlapped differential compartments, and in bovine the most frequent chromosomes are X, 8, 4, 23, 13, and 28 (Figure 7D). Similarly for differential TADs, 2,739 and 1,126 records were combined for BWS and LOS involved comparisons, respectively, and 2,635 human records have a corresponding genomic region found in bovine. And the overlapped record number is 153 (5.8%) with a 90% overlap cutoff in both species. Chromosome 1, 5, 3, 2, and 14 in human have the highest number of overlapped differential TADs, and in bovine the most frequent chromosomes are 7, 16, 1, 10, and 2 (Figure 7B). A 6 mb region is shown as an example to illustrate the TAD and compartment conservation and shared compartment changes between human and bovine (Figure 7E and 7F). In control groups, TADs and compartments are largely conserved in the right half of this region, and a 500 kb differential compartment region that changes toward B compartment is shared by BWS (chr2:231000000-231500000) and LOS (chr2:118000000-118500000) groups. These shared changes of chromosome compartment and TAD between BWS and LOS will be worthwhile for further detailed investigation and have the potential to serve as molecular biomarkers for this syndrome.
The differential compartments identified in BWS and LOS show preference for conservation on certain chromosomes, and this preference indicates these chromosomes have some similar features that lead to vulnerabilities. As discussed before, the territories of chromosome could be a source of vulnerability for molecular disruptions. Among the human chromosomes that have the highest number of conserved differential compartments in BWS, chr6, 10, 9, and 7 have relatively close chromosome territories according to the human fibroblast 3D-FISH image [87].
Elucidating whether the corresponding chromosomes in bovine have such spatial closeness requires future studies on bovine chromosome territories.
Conclusion
In summary, our results suggest that genome-wide alternation of chromosome architecture, which is partially caused by DNA methylation changes, also contribute to the development of BWS and LOS. We show shared regions of dysregulation between BWS and LOS, including several HOX gene clusters, and also demonstrate that altered DNA methylation differs between the clinically epigenetically identified BWS patients and those identified as having DNA variants (i.e. CDKN1C microdeletion). Importantly, we demonstrate, for the first time, that subpopulations of IC2 LOM patients exists and can be further separated molecularly into two subpopulations. We also highlight additional genes and genomic regions that have the potential to serve as targets for biomarker development to improve current molecular methodologies. With the advent of personalized medicine, the bovine model of overgrowth will be invaluable to be able to perform animal and in vitro studies, such as CRISPR/Cas9-based epigenetic editing, of regions identified as altered, in order to develop methodologies to ameliorate the clinical features and treat BWS.
EXPERIMENTAL MODEL AND SUBJECT DETAILS
Human patients
Patient skin fibroblast samples and clinical information were collected through the BWS Registry, under the oversight of the Children’s Hospital of Philadelphia (CHOP) Institutional Review Board protocol (IRB 13-010658) and in accordance with the Declaration of Helsinki. In brief, consent was obtained from all patients and/or legal guardians to collect longitudinal clinical information, in addition to samples that became available through clinical care and publish the findings. Patients were identified from the registry cohort and selected based on the availability of skin fibroblasts and their genetic or epigenetic type of BWS. Non-BWS samples (control) were collected for consideration of other growth difference (i.e. have an omphalocele but do not have BWS).
Patient skin fibroblasts were cultured as previously described [43]. Briefly, skin samples collected from regions either behind the ear or abdomen were split to process one chemically and other mechanically. Chemical disruption was performed using collagenase and the other was mechanically minced using a scalpel blade. Both explants were seeded into a T25 flask and supplemented with RPMI skin media (RPMI with fetal bovine serum, penicillin–streptomycin antibiotic, and a final concentration of 2 mM L-glutamine). All flasks were incubated at 37°C for up to one month, with periodic media changes. Successful explant cultures were passaged for sustained growth and trypsinized to freeze and stored in liquid nitrogen. Clinical testing for BWS was performed at the University of Pennsylvania Genetic Diagnostic Laboratory as previously described [103].
The identifier and sex of patient included in this study were as follows; 1) control: CON_H_#1 to #3 (female), CON_H_#4 and #5 (male); 2) BWS with IC2 loss of methylation: BWS_#1_IC2 to BWS_#6_IC2 (female), BWS_#7_IC2 to BWS_#12_IC2 (male); 3) BWS with IC1 gain of methylation: BWS_#13_IC1 to BWS_#15_IC1 (female); 4) BWS with CDKN1C variant: BWS_#16_Mut (male according to record but female according to sequencing results), BWS_#17_Mut and BWS_#18_Mut (female). The age of fibroblast sample collection (in days with gestational age correction) for each group are control (average 139, range 1-505), BWS with IC2 loss of methylation (327, 1-1283), BWS with IC1 gain of methylation (1274, 116-3459), BWS with CDKN1C variant (206, 6-488).
Bovine animals
Day 105 Bos taurus indicus (B. t. indicus; Brahman breed) x Bos taurus taurus (B. t. taurus; Angus breed) F1 hybrid fetuses were generated by our laboratory in 2019 and used as tissue donors [19,44]. This breeding strategy introduced genetic variants between the maternal and paternal alleles in the for allele-specific analyses. The control group was generated using artificial insemination (AI) and the ART group was generated by in vitro production procedures. The LOS group was defined as individuals from the ART group with body weight greater than 97th centile of controls (548g). Conceptuses were collected by caesarean section to maintain nucleic acid integrity. Fetal skin fibroblast primary cell lines were established and maintained as described in our previous study [44]. The identifier, original ID, sex, and body weight of fetuses used in this study were as follows; 1) control fetuses: CON_B_#1 (original ID 533, female, 388g), CON_B_#2 (647, female, 396g), CON_B_#3 (640, male, 448g), CON_B_#4 (648, male, 466g), and CON_B_#5 (527, male, 514g); 2) LOS fetuses: LOS_#1 (616, female, 638g), LOS_#2 (656, female, 704g), LOS_#3 (604B, female, 986g), LOS_#4 (512, male, 648g), LOS_#5 (602, male, 752g), and LOS_#6 (664, male, 1080g).
All the animal procedures were approved by the University of Missouri Animal Care and Use Committee under protocol 9455. Trained personnel and Veterinarians performed all animal handling and surgeries.
METHOD DETAILS
In this manuscript, all the chromosomal coordinates for bovine genome refers to assembly ARS-UCD1.2, and for human genome refers to GRCh37 (hg19) [104].
Genomic DNA extraction
Genomic DNA from human skin fibroblasts was isolated using the AllPrep DNA/RNA Micro Kit (QIAGEN) per the manufacturer’s instructions, as previously described [43]. Briefly, the cells were lysed in the Buffer RLT Plus. The lysate was then homogenized into a QIAshredder spin column. The homogenized lysate was then transferred to an AllPrep DNA spin column, washed with washing buffer and then DNA was eluted using elution buffer. The concentration of DNA was measured by using a NanoDrop® ND-1000 Spectrophotometer (Thermo Fisher Scientific). Genomic DNA samples were stored at –20°C.
Bovine fibroblast cells were lysed in lysis buffer (0.05 M Tris-HCl (pH 8.0), 0.1 M EDTA, and 0.5% (w/v) SDS) with proteinase K (Fisher BioReagents, BP1700) at 55°C for four hours. Genomic DNA was extracted with Phenol:Chloroform:Isoamyl Alcohol (SIGMA, P3803) following the manufacturer’s instructions. The concentration of DNA was measured by using a NanoDrop® ND-1000 Spectrophotometer and DNA integrity was confirmed by electrophoresis on a 0.7% agarose gel. Genomic DNA samples were stored at –20°C.
RNA isolation
Total RNA from human skin fibroblasts was isolated using the AllPrep DNA/RNA Micro Kit (QIAGEN) per the manufacturer’s instructions, as previously described [43].
Briefly, the cells were lysed in the Buffer RLT Plus. The lysate was then homogenized into a QIAshredder spin column. The homogenized lysate was then transferred to an AllPrep DNA spin column, and the flowthrough was used for RNA extraction using 70% ethanol. The concentration of RNA was measured by using a NanoDrop® ND-1000 Spectrophotometer and RNA samples were stored at –80°C.
Total RNA was isolated from bovine fibroblast cells using TRIzol™ Reagent (Invitrogen, 15596026) following the manufacturer’s instructions. The concentration of RNA was measured by using a NanoDrop® ND-1000 Spectrophotometer. RNA samples were stored at –80°C.
CTCF binding site prediction
Potential CTCF binding sites were predicted globally for human and bovine genome using TFBSTools 1.26.0 [105] with database JASPAR2020 [106]. CTCF motifs of ‘vertebrates’ were used for prediction and min.score was set to 81%.
Hi-C sequencing and data analyses
Hi-C sequencing for fibroblast cells was conducted by CD Genomics.
Information on library preparation and sequencing obtained from the company is as follows: Cells were cross-linked with 1% formaldehyde at room temperature and quenched with glycine. The cross-linked cells were subsequently lysed. Endogenous nucleases were inactivated with 0.3% SDS, then chromatin DNA were digested by MboI (NEB), marked with biotin-14-dCTP (Invitrogen), and ligated by T4 DNA ligase (NEB).
After reversing cross-links, the ligated DNA was extracted through QIAamp DNA Mini Kit (Qiagen) according to manufacturers’ instructions. Purified DNA was sheared to 300-500 bp fragments and were further blunt-end repaired, A-tailed and adaptor-added, followed by purification and PCR amplification. Finally, equimolar pooling of libraries was performed based on QC values and sequenced on Novaseq6000 sequencer (Illumina) with a read length configuration of 150 PE for 1,000M PE reads per sample (1,000M in each direction).
The processing of Hi-C raw sequencing reads was based on the ‘Hi-C Processing Pipeline’ from 4D Nucleome Data Portal (https://data.4dnucleome.org/resources/data-analysis/hi_c-processing-pipeline). Briefly, reads were aligned to the corresponding reference genome using bwa 0.7.17 with parameters ‘mem –SP5M’ [107]. Reads with mapping quality (MAPQ) equal or greater than 30 were kept for analyses. Then, pairtools 0.3.0 was used to parse, sort, and deduplicate aligned reads, and pair types ‘UU’, ‘UR’, and ‘RU’ were selected [108].
Cooler and Juicer were used to convert contact matrix to .cool and .hic files [109,110]. Hi-C data was also used to identify genomic variants following the pipeline for 1000 bull genome project [111]. Briefly, Read groups were added using AddOrReplaceReadGroups function of picard 2.25.5 [112] for aligned Hi-C sequencing reads. Duplicated reads were marked using MarkDuplicates function of picard with parameter ‘--OPTICAL_DUPLICATE_PIXEL_DISTANCE 2500’. For human, the dataset of known variants was acquired from GATK resource bundle (https://gatk.broadinstitute.org/hc/en-us/articles/360035890811-Resource-bundle). For bovine, the dataset of known variants was acquired from the 1000 bull genome project, namely ARS1.2PlusY_BQSR_v3.vcf.gz. GATK 4.2.1.0 [113] was used to recalibrate base quality and identify genomic variants in the Hi-C data with the known variant dataset as reference. Parameters used for BaseRecalibrator were ‘–bqsr-baq-gap-open-penalty 45 –-read-filter MappingQualityReadFilter –-minimum-mapping-quality 20’ for bovine. For human, the same settings were used except with default value for –-bqsr-baq-gap-open-penalty. In addition, for bovine, our previously generated genomic sequencing data for semen DNA of the bull used to sire all the fetuses in this study was included for joint genotyping in order to assign alleles for the genomic variants (GEO: GSE197130) [44]. HaplotypeCaller was used with parameter ‘-ERC GVCF’, and GenomicsDBImport and GenotypeGVCFs were used with default settings. For bovine, raw SNP and INDEL were separately scored using VariantRecalibrator with parameter ‘--resource:1000G,known=false,training=true,truth=true,prior=10.0 known_variant –an QD –an MQ –an MQRankSum –an ReadPosRankSum –an FS –an SOR’ was used. For human, parameter ‘--resource:hapmap,known=false,training=true,truth=true,prior=15.0 known_variant1 –-resource:omni,known=false,training=true,truth=true,prior=12.0 known_variant2 –-resource:1000GSNP,known=false,training=true,truth=true,prior=10.0 known_variant3 –-resource:1000GINDEL,known=false,training=true,truth=true,prior=10.0 known_variant4 –-resource:dbsnp,known=true,training=false,truth=false,prior=2.0 known_variant5 –an QD –an MQ –an MQRankSum –an ReadPosRankSum –an FS –an SOR’ was used.
Scored variants were filtered using ApplyVQSR with parameter ‘--truth-sensitivity-filter-level 99.0’.
For bovine, variants used for allele assignment met the following criteria: 1) marked as PASS by ApplyVQSR, 2) GQ>=40 in the bull and the fetus, 3) DP>=10 in the bull, 4) no read supports not assigned alleles in the bull and the fetus, 5) only one allele of the bull is shown in the fetus. In addition, variants on chrX identified in male fetuses were excluded from analyses, since which is likely due to the lack of chrY in the reference genome. Alleles were assigned for bovine Hi-C reads based on qualified variants using custom Perl scripts. For SNP, the nucleotide in the reads at the SNP location was directly used for allele assignment. For INDEL, local maternal and paternal allele pseudo genomes were generated, and the reads were realigned to both pseudo genomes. The reads were assigned to the alleles with more aligned bases, or less mismatches if aligned base numbers were the same. Next, variants with biased allelic ratio of Hi-C reads (one allele is less than 15%) were excluded from analyses. Lastly, reads that cover multiple variants and have conflicting allele assignments were excluded from the analyses.
Statistical analyses for detecting differentially interacting regions (DIR), differential TAD, and differential chromosome compartments were performed. The sex chromosomes were only analyzed in sex-specific comparisons to circumvent confounding created by X chromosome inactivation. R package multiHiCcompare 1.12.0 was used to identify DIR at 1mb, 500kb, 250kb, 100kb, and 50kb resolutions between groups [114]. The make_hicexp function was used with default parameters except ‘remove.regions = NULL’, and cyclic_loess and hic_exactTest functions were used with default settings. False discovery rate (FDR) was controlled at 0.05 for significance.
For visualization and TAD detection for each group, the size of contact matrix was normalized to the first sample in the Control group for both human (CON_H_#1) and bovine (CON_B_#1), and group mean contact matrix was calculated based on normalized matrix of each sample in the group. R package SpectralTAD 1.10.0 was used with parameter ‘qual_filter = TRUE, z_clust = FALSE, levels = level, resolution = 25000, window_size = window_size, gap_thresh = 0.2, min_size = 6’ to identify TAD structure ranging from 150kb to 4mb at 25kb resolution [115]. Level and window_size was initially set to 10 and 120, respectively, and reduced by 1 and 30 each time if error reported. In addition, diffDomain was used with function and parameter ‘dvsd multiple –-min_nbin 1 –-hicnorm NONE’ and ‘adjustment fdr_bh’ to detect differential TAD boundaries at 25kb resolution between groups based on TAD identified by SpectralTAD [116]. Since SpectralTAD and diffDomain only support single sample comparison instead of group comparison, to reduce the impacts of sample variations within each group and obtain more consistent differences between groups, filtering for inconsistent TADs in the control groups was performed for detected differential TADs. Inconsistent TADs were obtained by applying diffDomain between each sample and its group mean contact matrix and merging all the differential results from each sample. It is worth noting that TAD comparisons between BWS subtypes were not filtered and resulted in much larger number of differential TAD since there was no control group involved.
Types of differential TAD include loss, strength change, merge, split, zoom, and complex. Strength change refers to the situation that the same TAD is detected in the two groups for comparing but the chromosomal contact frequency is different within the TAD. TAD with strength change could reflect forming or losing small sub-TADs and loops within it that requires higher resolution and cannot be properly annotated with the sequencing depth in this study. TAD with strength change could also be a result of chromosome compartment change of the sub-TADs within it. Zoom refers to the extension or shrink of a TAD in another group. Complex refers to the situation that cannot be simply categorized into any other type.
dcHiC was used to assign chromosome compartments and identify differential compartments at 1mb, 500kb, 250kb, 100kb, 50kb, and 25kb resolutions between groups [117]. Default settings for cis, select, analyze, and subcomp functions of dcHiC were used, and FDR was controlled at 0.05 for significance during the analyze step.
The quantile normalized principal component (eigenvalue) calculated at 25kb resolution was used for assigning compartments and plotting.
Whole genome bisulfite sequencing (WGBS) and data analyses
WGBS for fibroblast cells was conducted by CD Genomics. Information on library preparation and sequencing obtained from the company is as follows: Genomic DNA was fragmented by sonication to a mean size of approximately 200-400 bp.
Fragmented DNA was end-repaired, 5’-phosphorylated, 3’-dA-tailed and then ligated to methylated adapters. The methylated adapter-ligated DNAs were purified using 0.8× Agencourt AMPure XP magnetic beads and subjected to bisulfite conversion by ZYMO EZ DNA Methylation-Gold Kit (Zymo Research). The converted DNAs then have the addition of 8-bp index primers to create the final cDNA library. Equimolar pooling of libraries was performed based on QC values and sequenced on Novaseq6000 sequencer (Illumina) with a read length configuration of 150 PE for 300M PE reads per sample (300M in each direction). 0.1-1% lambda DNA were added during the library preparation to monitor bisulfite conversion rate.
For WGBS data, raw sequencing reads were deduplicated using the clumpify function of BBMap 38.90 [118] and trimmed for adapter sequences and low quality bases using trimmomatic 0.39 [119] with parameters ‘ILLUMINACLIP:adapter_seq:2:30:10:1:true LEADING:20 TRAILING:20 AVGQUAL:20 MAXINFO:0:0.5’. Trimmed reads were aligned to the corresponding reference genome using BSBolt 1.5.0 [120] with default setting. Trimmed reads were also aligned to lambda phage genome to determine bisulfite conversion rates. Samtools 1.13 [121] was used to convert, sort, filter, and index bam files. MarkDuplicates function of picard 2.25.5 [112] was used with parameter ‘--OPTICAL_DUPLICATE_PIXEL_DISTANCE 2500’ to further remove duplicated reads after alignment. CpG methylation information was extracted from the bam files using the function CallMethylation of BSBolt with parameter ‘-CG –min 1 –BQ 20’. For both human and bovine samples, CpG methylation at C/T SNPs detected in their corresponding Hi-C data were excluded for sense strand reads, and CpG methylation at G/A SNPs were excluded for antisense strand reads. For bovine samples, SNPs identified from Hi-C dataset were also used to assign alleles for WGBS reads using custom Perl scripts. C/T SNPs (based on sense strand sequence) were only applied for antisense strand reads, and G/A SNPs were only applied for sense strand reads. Other types of SNP were applied for both strands. Reads that cover multiple SNPs and have conflicting allele assignments were excluded. For both overall and allele-specific comparisons, statistical analyses were conducted using R package hummingbird [122] with parameter ‘minCpGs = 10, minLength = 100, maxGap = 300’ to identify differentially methylated regions (DMRs) between groups. DMRs with at least 15% difference in methylation level (both gain and loss of methylation) and at least 4 mean read coverage at CpG sites in all the samples were reported. For allele-specific analyses, the read coverage filtering was not applied since only about 20% of the usable SNPs are shared by all the sample. The sex chromosomes were only analyzed in sex-specific comparisons to circumvent confounding created by X chromosome inactivation.
Total RNA sequencing (total RNA-seq) and data analyses
Total RNA-seq for fibroblast cells was conducted by CD Genomics. Information on library preparation and sequencing obtained from the company is as follows: The first step involves the removal of ribosomal RNA using RiboZero kit (Illumina).
Subsequently, the RNA is fragmented into small pieces using divalent cations under elevated temperatures. The cleaved RNA fragments are copied into first strand cDNA using reverse transcriptase and random primers, followed by second strand cDNA synthesis. These cDNA fragments then have the addition of a single ‘A’ base and subsequent ligation of the adapter. The products are purified and enriched with PCR to create the final cDNA library. This results in libraries with inserts ranging in size from 120–200 bp with a median size of 150 bp. Equimolar pooling of libraries was performed based on QC values and sequenced on Novaseq6000 sequencer (Illumina) with a read length configuration of 150 PE for 33M PE reads per sample (33M in each direction).
All read data was assessed for quality with FastQC 0.11.7 and low-quality bases (Phred scores ≤ 20) were trimmed using the dynamictrim function of SolexaQA++ 3.1.7.1. Reads less than 60 bases in length were removed using SolexaQA++ LengthSort. Known splice sites were extracted from the gtf file of each reference genome using the Python script hisat2_extract_splice_sites.py. Hisat2 2.1.0 was used to establish a genome index with the hisat2-build and also to align the quality trimmed reads to the reference genome with the following adjusted parameters: –-mp 6,6; – score-min L,0,-0.2; known-splicesite-infile. Sam files were converted to bam files and coordinate-sorted using Samtools 1.8. Then, Stringtie 2.1.4 was used with the sorted bam files to assemble transcriptomes for each sample. Stringtie merge was used to combine the assembled transcripts from all samples into a reference assembly. Assembled transcripts were extracted using the gffread module in cufflinks 2.2.1. An index was built for the merged transcriptome and reads were quantified using Salmon 0.11.1. IsoformSwitchAnalyeR 1.17.04 was used to rescue stringtie annotations and generate a gene count matrix.
For alternative splicing (AS) event analyses, the merged Stringtie annotation file and coordinate-sorted bam files were used, and AS events were called using rMATs 4.0.1 with parameters ‘-t paired –readlength 150 –cstat 0.0001 –libType fr-firststrand’.
FDR was controlled at 0.05 for significance. Manhattan plots of were generated using R package Sushi [123].
To assign allele specificity for total RNA-seq reads in bovine, variants were called from the aligned data according to GATK’s Best Practices for Calling Variants in RNA-seq data. Duplicate reads were removed and read groups were assigned using Picard 2.22.4. A dictionary was created for the reference genome using GATK’s CreateSequenceDictionary. GATK SplitNCigarReads was used to hard clip sequences extending into intronic regions and GATK BaseRecalibrator to recalibrate base quality scores. Then, HaplotypeCaller was run on calibrated data and called variants were filtered with adjusted parameters (AB < 0.2 & MQ0 > 50). Variants that were shared between genomic and RNA-seq data for each sample were kept. Variants that were heterozygous in the fetus and homozygous in the bull were used to assign alleles. A variant annotation file was created using the annotate function of bcftools 1.8 and gene annotations were added using custom scripts. Custom R scripts were used to retrieve maternal and paternal allele depth read counts from VCF files in order to quantify allele-specific expressions.
Statistical analyses were conducted using R package edgeR 3.36.0 [124] to identify differentially expressed genes (DEGs) between groups. Parameters used include ‘method = “TMM”’ for calcNormFactors function and ‘robust = TRUE’ for glmFit function. FDR was controlled at 0.05 for significance.
Functional correlation between gene expression and BWS clinical diagnosis
To determine the co-expressional network that gathered by genes showing similar trends across samples, WGCNA was performed in R [125]. Briefly, gene abundance matrix (normalized expression matrix) from IsoformSwitchAnalyeR was log2 transformed and only genes with high expressional variability values (top 60%, 15304 genes retained) were remained for identification of co-expression network and a soft threshold β value was set as 10 according to the criterion of approximate scale-free topology. BWS specific clinical diagnosis was generated through the evaluated features from Wang et al reported study [83]. Clinical BWS score consists of the combination of cardinal and suggestive features, with one more point (plus two points) was given for each diagnosed cardinal feature, while one point was given for each diagnosed suggestive feature. The correlation between eigengene (a representative of the gene expression profiles in a module) in each module and clinical diagnoses was calculated using Pearson’s correlation method, and only relationships with p-value < 0.05 were considered as significantly positive/negative correlation. Hub genes within BWS-related module were identified with both absolute gene-BWS score significance ≥ 0.5 and absolute module membership ≥ 0.8.
Correlation analyses between gene expression and chromosome compartment
Pearson correlation analyses between gene expression changes and eigenvalue changes at gene promoter were performed using the R base function ‘cor’.
Genomic content overlap and enrichment analyses
Gene annotation information was obtained from NCBI (GCF_002263795.1_ARS-UCD1.2_genomic.gtf and GCF_000001405.25_GRCh37.p13_genomic.gtf) [126]. Repeated and overlapped exons were merged for each gene, and introns were calculated based on merged exons. Promoters (1kb) were calculated based on transcription start sites annotation and only included protein coding genes and long non-coding RNAs. Annotation of CpG islands and repeated sequences were obtained from UCSC Genome Browser [127]. Locations of CpG shores (flanking 2kb from CpG islands) and shelves (flanking 2-4kb from the CpG island) were calculated based on CpG island annotation. Human public CTCF ChIP-seq data of fibroblast primary cells from different tissues were obtained from the ENCODE portal with the following identifiers: ENCFF148VQH (lung), ENCFF337WIE (foreskin), ENCFF344UBE (cardiac), ENCFF438XHB (mammary gland), ENCFF570FLB (lung), ENCFF638OUB (dermis), ENCFF652MLT (foreskin), ENCFF734DZF (lung), ENCFF738CXX (villous mesenchyme), ENCFF859PRV (aortic adventitia), and ENCFF933VBD (pulmonary artery) [128]. Peaks from these files were merged to use as common CTCF sites. Bovine public CTCF ChIP-seq data of different tissues (no fibroblast primary cell data available) were obtained from the Gene Expression Omnibus (GEO) database with the following identifiers: GSE158430 (replicate for adipose, cerebellum, cortex, hypothalamus, liver, lung, muscle, and spleen) and GSE129423 (control rumen epithelial primary cells) [129]. GSE129423 was based on genome build UMD3.1.1 and was converted to ARS-UCD1.2 using liftOver from UCSC Genome Browser with parameter ‘-minMatch=0.1’. Due to lower quality (i.e. occasionally very broad peaks) of these data than the human data, peak regions found in at least four files were kept as common CTCF sites. Bedtools and custom Perl scripts were used to identify overlapped genomic contexts for regions with altered DNA methylation, gene expression, and chromosome architecture, and calculate observed frequencies (Obs) [130]. Permutation tests were performed to determine expected frequencies (Exp) of overlapping by randomly shuffling genomic contexts across the genome for 10,000 times. For each test, the p value was calculated as p = n(|Exp – mean(Exp)| ≥ |Obs – mean(Exp)|)/10,000. EnrichedHeatmap was also used for enrichment visualization in the heatmaps and different flanking distance was chosen based on the length of genomic content examined to best show the background level and enrichment pattern [131].
The genomic coordinates of human super-enhancers were obtained from database dbSUPER and used for finding enhancer-promoter contact for gene SESN3 at 10kb resolution with Python library bioframe [132,133].
Conservation analyses
For TAD/compartment conservation analyses between human and bovine control groups, the genomic coordinates of human TAD/compartment were converted to bovine coordinates using liftOver from UCSC Genome Browser with parameter ‘-minMatch=0.1’. Then, custom Perl scripts were used to identify bovine TAD/compartment overlapping with human TAD/compartment that the overlapped region is greater than 90% in both species for TAD and in any species for compartment.
To identify shared differential compartments between BWS and LOS, for each comparison, bedtools was first used to merge significant results of different resolutions into non-overlapping regions [130]. Merged results of comparisons that compare BWS/LOS to control group were combined for each species. For human, BWS vs Control (index 1 in Table 1), BWS_IC1_GOM vs Control (2), BWS_IC2_LOM vs Control (3), BWS_CDKN1C_Mut vs Control (4), BWS_IC2_LOM_Male vs Control_Male (8), BWS_Female vs Control_Female (9), BWS_IC1_GOM_Female vs Control_Female (10), BWS_IC2_LOM_Female vs Control_Female (11), BWS_CDKN1C_Mut_Female vs Control_Female (12) were used for analyses. For bovine, LOS vs Control (16), LOS_Male vs Control_Male (18), and LOS_Female vs Control_Female (19) were used for analyses. Then human coordinates were converted to bovine using liftOver and regions overlapped with bovine differential compartments were identified using custom Perl scripts.
Data Availability
All the raw sequencing data for human samples, including whole genome bisulfite sequencing, total RNA sequencing, and HiC sequencing, are available in the database of Genotypes and Phenotypes (dbGaP) with accession number (phs001794.v1.p1). All the raw sequencing data for bovine samples, including whole genome bisulfite sequencing, total RNA sequencing, and HiC sequencing, are available in the Gene Expression Omnibus (GEO) database with accession number (pending).
Author contributions
Y.L., J.M.K, D.E.H., J.C., and R.M.R. designed research; Y.L. and S.N. performed research; Y.L., P.X., F.B., A.K.G., analyzed data; Y.L., P.X., F.B., A.K.G., S.N., and R.M.R. wrote the paper; all authors edited the paper.
Declaration of interests
The authors declare no competing interests.
Acknowledgements
We acknowledge the ENCODE Consortium and the John Stamatoyannopoulos (UW) and Bradley Bernstein (Broad) laboratories that generated the human CTCF ChIP-seq datasets. This research was partially funded by the United States Department of Agriculture-Agriculture and Food Research Initiative (USDA-AFRI), grant 2018-67015-27598. This work was partially supported by National Cancer Institute [K08 CA193915], Alex’s Lemonade Stand Foundation, a Damon Runyon Clinical Investigator Award provided by the Damon Runyon Cancer Research Foundation (105–19), the Lorenzo “Turtle” Sartini Jr. Endowed Chair in Beckwith-Wiedemann Syndrome Research, and the Victoria Fertitta Fund through the Lorenzo “Turtle” Sartini Jr. Endowed Chair in Beckwith-Wiedemann Syndrome Research (J.M.K.). The funders had no role in study design, data collection and analysis, decision to publish, or preparation of the manuscript.
Footnotes
Yahan Li, yl5c7{at}mail.missouri.edu; Ping Xiao, ping.xiao{at}okstate.edu; Frimpong Boadu, fbqc9{at}missouri.edu; Anna Goldkamp, anna.goldkamp{at}okstate.edu; Snehal Nirgude, nirgudes{at}chop.edu; Jianlin Cheng, chengji{at}missouri.edu; Darren Hagen, darren.hagen{at}okstate.edu; Jennifer Kalish, kalishj{at}chop.edu; Rocío Melissa Rivera, riverarm{at}missouri.edu
A reader noted a typo in the title and alerted me =(
References
- 1.↵
- 2.↵
- 3.↵
- 4.↵
- 5.
- 6.↵
- 7.↵
- 8.↵
- 9.
- 10.
- 11.
- 12.
- 13.
- 14.
- 15.
- 16.
- 17.
- 18.
- 19.↵
- 20.↵
- 21.↵
- 22.↵
- 23.
- 24.↵
- 25.
- 26.↵
- 27.
- 28.
- 29.
- 30.↵
- 31.↵
- 32.↵
- 33.↵
- 34.↵
- 35.↵
- 36.↵
- 37.↵
- 38.
- 39.
- 40.
- 41.↵
- 42.↵
- 43.↵
- 44.↵
- 45.↵
- 46.↵
- 47.↵
- 48.↵
- 49.↵
- 50.↵
- 51.
- 52.↵
- 53.↵
- 54.
- 55.↵
- 56.↵
- 57.↵
- 58.↵
- 59.↵
- 60.↵
- 61.
- 62.
- 63.
- 64.
- 65.↵
- 66.↵
- 67.↵
- 68.
- 69.
- 70.
- 71.
- 72.
- 73.
- 74.
- 75.↵
- 76.↵
- 77.↵
- 78.↵
- 79.↵
- 80.↵
- 81.↵
- 82.↵
- 83.↵
- 84.↵
- 85.↵
- 86.↵
- 87.↵
- 88.↵
- 89.↵
- 90.
- 91.↵
- 92.↵
- 93.↵
- 94.↵
- 95.
- 96.↵
- 97.↵
- 98.↵
- 99.
- 100.
- 101.
- 102.↵
- 103.↵
- 104.↵
- 105.↵
- 106.↵
- 107.↵
- 108.↵
- 109.↵
- 110.↵
- 111.↵
- 112.↵
- 113.↵
- 114.↵
- 115.↵
- 116.↵
- 117.↵
- 118.↵
- 119.↵
- 120.↵
- 121.↵
- 122.↵
- 123.↵
- 124.↵
- 125.↵
- 126.↵
- 127.↵
- 128.↵
- 129.↵
- 130.↵
- 131.↵
- 132.↵
- 133.↵
- 134.↵
- 135.
- 136.
- 137.
- 138.
- 139.
- 140.
- 141.↵


