
Abstract
Cognitive deficits are present in the majority of psychosis patients. They range across various domains, such as working memory, and executive functioning, and are linked to neurobiological changes, including changes in gray matter volume. In this study, we explored data-driven clustering solutions using behavioural, demographic, psychological and structural brain data, but no clinical data, in a cross-diagnostic sample combining affective (N=51) and non-affective (N=111) psychosis patients as well as healthy controls (N=55). The goal of the study was (1) to test classification sensitivity of diagnostic groups using data without diagnostic information, and (2) to explore identification of potential cognitive phenotypes. We used K-means and spectral clustering, investigating two-, three- and four-cluster solutions, and group-membership matching. We then explored cognitive deficits and symptom expression within the four-cluster solution. Our results revealed best group-cluster matching using PCA-pre-selected only non-brain, mostly cognitive, features. The three groups were clustered with medium sensitivity, correctly identifying between 44% and 78% of individuals per group. More importantly, however, clustering using four clusters allowed the identification of cognitive phenotypes, that significantly varied in clinical and cognitive impairment. We identified one cluster expressing the lowest symptom scores and unimpaired cognition, one other cluster with the highest symptom scores, especially negative symptoms, and global cognitive impairments, across all domains, and two intermediate clusters. In conclusion, these results provide evidence for cognitive phenotypes with specific symptom expressions combining individuals with different overall diagnoses. The clear link between the cognitive deficits and symptoms indicates the need for the development of cognition-based interventions.
1 Introduction
Cognitive alterations are core symptoms of psychosis [1–4]. Deficits are wide ranged and have been described in areas of working memory [5, 6], attention [7, 8], reasoning [9, 10], decision making [11, 12], salience processing [13, 14] and problem solving [15, 16] and across all stages of the disease [17–21]. Cognitive deficits furthermore precede the clinical onset of psychosis [22], and predict functional outcome in later stages of the disease [23, 24], impacting employment status, independent living and social functioning [24, 25]. Although cognitive impairments are present in about 80% of patients suffering from psychotic disorders [26–28], there is great variability between patients, and across different diagnoses, e.g., affective vs non-affective psychosis [29–31]. However, many studies often do not differentiate between affective vs non-affective psychosis when investigating cognitive deficits [32]. In a review, Barch and Sheffield [31] summarised that while the severity of cognitive impairment is stronger in non-affective compared to affective psychosis, the relative impairments across different cognitive domains are very similar. Generally, research has shown that fewer cognitive deficits and higher cognitive reserve during prodromal and first episode psychosis are generally, diagnosis-independently, associated with better functioning and recovery [33, 34]. Therefore, early detection and intervention is crucial, to improve long-term outcome.
Cognitive deficits in psychosis have been linked to alterations in the cortico-cerebellar-thalamic-cortical circuits [35]. Here, dysfunctional GABA (gamma-amino-butyric acid) inter-neurons, the main inhibitory neurons of the central nervous system, may disrupt the balance between excitatory and inhibitory processes in the cortex [36]. These accounts confirm an established hypothesis suggesting that neuronal pruning during adolescence [37] through reorganization of both structural and functional brain networks is dysfunctional in schizophrenia, impacting neural communication and potentially causing cognitive impairments in individuals suffering from the disorder [38]. Further support is provided by imaging studies showing reduced gray matter volume and altered network organisation which correlates with cognitive deficits, at illness onset [39, 40], early psychosis [41] and chronic schizophrenia [42]. Cognitive deficits in psychosis have been described and investigated as intermediate phenotypes [43]. In a recent study, Shafee et al [44] pointed out that cognitive phenotypes may vary grossly depending on specific types of psychosis (e.g. affective vs non-affective), suggesting that certain domains of cognition (e.g., working memory vs face processing) may be more etiologically linked to psychosis than others. Using a K-means clustering approach in a cross-diagnostic sample, Lewandowski et al [45] identified four cognitive subgroups combining different psychosis groups. Importantly, they identified one cognitively intact cluster including healthy controls and patients with different diagnoses, while the other three clusters were dominated by different cognitive impairment profiles [45]. A recent systematic review of data-driven identification of cognitive subtypes [46] highlighted that despite the heterogeneity of clustering methods used and cognitive domains studied, there is some commonality in the identification of a severe cognitive deficit phenotype, which shows deficits across multiple domains. However, it is unclear whether the severe cognitive deficit phenotype also shows the strongest symptom expression.
In the current study, we aimed to explore whether data-driven clustering using behavioural, demographic, psychological and structural brain data, but no clinical data, can be applied successfully (1) to reproduce diagnostic groups, i.e., affective psychosis patients, non-affective psychosis patients and healthy controls; and (2) to explore whether different cluster solutions would yield the identification of cognitive phenotypes. We used data from the ”Human Connectome Project for Early Psychosis” which provides a large battery of behavioural tests and scores assessing cognition, such as working memory, attention, or decision making, as well as psychological data, such as general distress, and brain imaging data, namely grey matter volume. We used a data-driven approach comparing clustering of behavioural, demographic and psychological data, and of brain data separately as well as jointly. Importantly, we first applied component analyses to identify those features that explain the most variance, and subsequently used those features for clustering. In this study, we provide answers to the following questions: (1) Using pre-selected, variance-explaining features, not including diagnostic information, is it possible to reproduce group-membership of affective psychosis patients, non-affective psychosis patients and controls with a three cluster solution; or (2) do clusters form subgroups with specific cognitive profiles (i.e., cognitive phenotypes) using a four cluster solution?
2 Methods
2.1 Participants
In this paper, we analysed data collected by the “Human Connectome Project for Early Psychosis” (HCP-EP) [47]. The HCP-EP 1.1 release (August 2021 HCP-EP Release 1.1 on NDA) contains 251 subjects with 57 affective and 126 non-affective psychotic patients, both within the first three years of the onset of psychotic symptoms, and 68 matched healthy controls with comprehensive demographic (e.g., age, education), psychological (e.g., emotional survey, distress scale), and behavioural (e.g., auditory discrimination task, decision making task). Brain imaging data (e.g., structural data, functional task data) is available for 183 of those subjects with 28 in the affective psychosis group and 93 in the non-affective psychosis group and 57 healthy controls. After selection (Supplement, 1.1 Features Selection) analysis was performed on 217 subjects (55 healthy controls, 51 affective psychosis group, 111 non-affective psychosis group, Tab. 1).
Group demographics and clinical scores of final sample (N=217).
2.2 Analysis
2.2.1 Clustering Strategy and Preprocessing
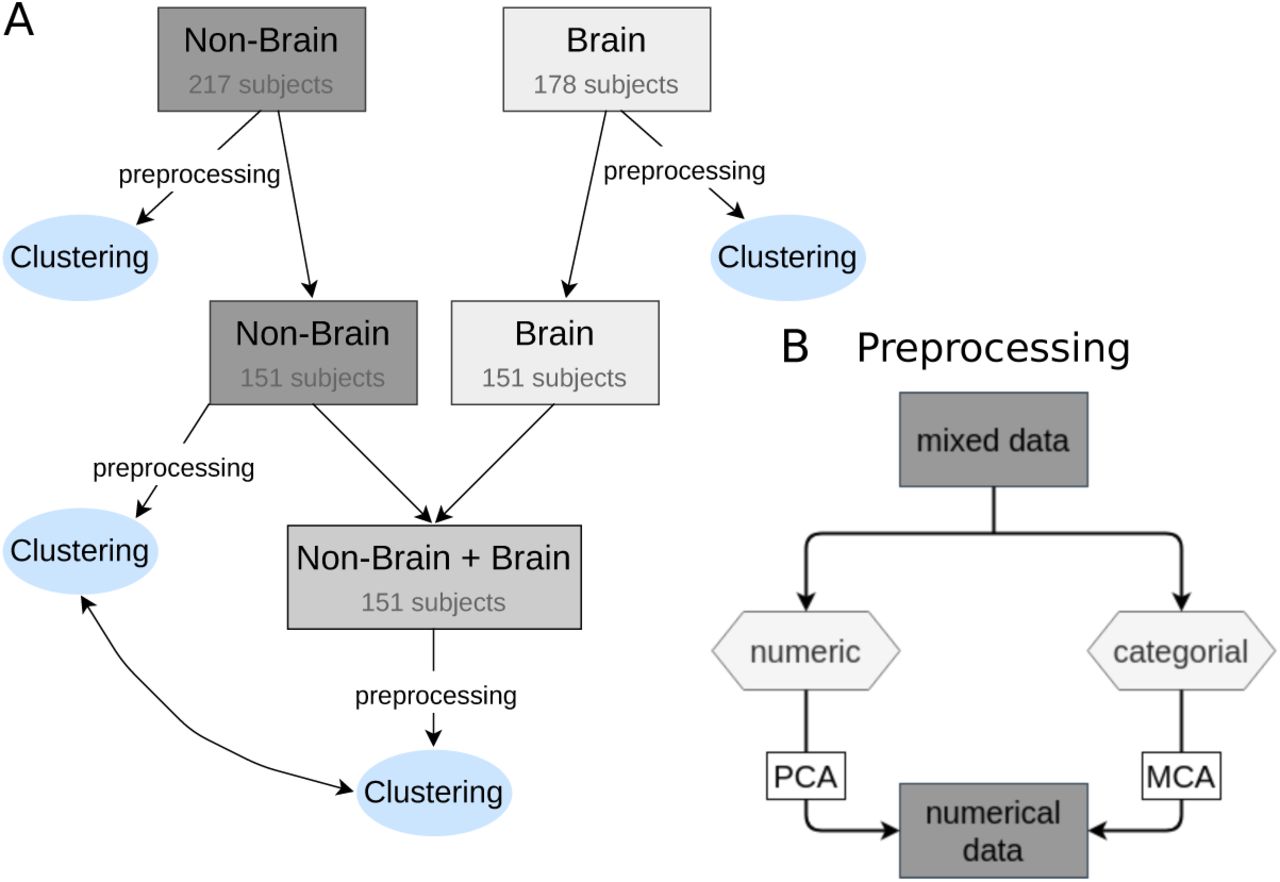
The feature selection strategies are described in detail in the supplementary section 1.1 Feature Selection. Clustering on selected features was performed separately on non-brain and brain data (Fig. 1A). The behavioural, psychological and demographic data consisted of continuous or numeric and categorical features, hence discrete data (Supplement, Tab. 3), while brain data were continuous. We therefore split our dataset according to numerical and discrete data types, normalised the data and performed Multiple Correspondence Analysis (MCA) on the categorical data, that maps the categorical data to a continuous space [48], and a Principle Component Analysis (PCA) to the numeric data (Fig. 1B). See supplementary section 1.2 Clustering of Mixed Data Types and section 1.3-1.5 on preprocessing for details.

(A) Clustering was performed separately on non-brain and brain data. Of 217 subjects in the non-brain data and 178 subjects in the brain data, clustering was performed on the overlap of 151 subjects. To compare clustering on non-brain data and combined non-brain and brain data, clustering was performed on non-brain data with overlapping subjects again. (B) Before performing the clustering analysis, non-brain data had to be transformed to be fully continuous. The data was split into numeric and categorical for performing PCA and MCA, respectively. The significant components resulting from these transformations were joint for clustering analysis.
2.2.2 Correlation and Homogeneity
To describe the association between subjects, we performed a Pearson’s correlation between all subjects across all features. We then tested homogeneity between groups, we used a Levene’s test for equal variances for between groups. Furthermore, we used a Pearson’s correlation to quantify the association between features across all subjects.
2.2.3 K-Means and Spectral Clustering
We performed the clustering analysis three times: (1) on the behavioural, psychological and demographic data only (N=217), (2) on the brain data only (N=178), and (3) on the combined behavioural, psychological and demographic, and brain data (N=151). To account for the large difference in number of subjects in behavioural psychological and demographic data, and the combined data, we performed the clustering with behavioural data only again with a reduced sample, only containing 151 subjects matching between the brain and non-brain data (Fig. 1, B). As a control analysis, we performed clustering of clinical data (i.e. all items of PANSS) in a two-cluster solution, to investigate the overlap with patient group-membership.
K-Means and spectral clustering on behavioural, psychological and demographic data was performed on joint significant components of numerical and categorical data. For brain data, K-Means was performed on the significant components of the PCA. Spectral clustering on brain data was performed with the first 10 components of the PCA to allow for more flexibility in the nonlinear embedding that is performed in the spectral clustering. For the combined data, both clustering analysis was done on the significant components of behavioural, demographic and brain data. For clinical data, K-Means and spectral clustering was also performed on the significant components of the PCA.
Performance of the clustering analysis was determined by the ratio of the subjects of one group (healthy controls, affective psychosis group and non-affective psychosis group) in each cluster. The ratio of subjects in cluster j for group i in {control, affective and non-affective} is defined as:
 To compare ratios between different cluster analyses, e.g. clustering behavioural, psychological, demographic data vs. clustering behavioural, psychological, demographic data combined with brain data, we took the mean of rations over 100 random initialization of the K-Means (spectral) algorithm. This way, we can rule out that possible performance differences were the result of random initialization.
2.3 Group Statistics
In order to test for statistical significance in the differences between the correlations of subjects groups, we used SciPy’s T-test for the means of two independent samples of scores, and Levene’s test for equal variance to test for differences in variance of correlations. For pairwise comparison between the three subject groups, we corrected the p-value for multiple testing with the Bonferroni method.
To compare features across clusters, we used SciPy’s Kruskal-Wallis test for a group comparison and Post hoc pairwise test for pairwise comparisons [49]. We furthermore conducted a partial correlation analysis, correcting for cluster membership, to investigate correlations between cognitive scores and symptom expression across all clusters. We used Pingouin 0.5.2 [50] pairwise correlation with the Holm–Bonferroni method to correct for multiple testing.
3 Results
3.1 Behavioural, Psychological and Demographic Data
Correlations within the control group were stronger than in both the affective (T-test: t5624 = 23.23, p < 0.001) and non-affective (t15344 = 46.81, p < 0.001) group. Non-affective subjects showed higher heterogeneity compared to controls (Levene’s test for equal variance: F1,164 = 93.40, p < 0.001) or affective subjects (F1,160 = 64.16, p < 0.001) (Fig. 2A). There was no significant difference between affective and control group. All p-values were controlled for multiple comparisons.

(A) Subject-based correlation across numeric features (48). Squares on diagonal show correlation within groups, squares off diagonal show correlations between groups. (B) Explained variance by each principal component (PC) in %, with PCA performed on all 48 numeric features across 217 subjects. The first six PCs (blue) survived permutation testing (p<0.05, 5000 permutations) and captured 58.6% of total variance. (C) Ratio of the three subject groups. Of 217 subjects in total, 25.3% were part of control, 23.5% of affective and 51.2% of non-affective group. (D) The first two (left) and first three (right) PCs are used to visualize the data. Data points correspond to subjects and are coloured according to group. (E) Percentage of subjects of a group in each cluster, for K-Means clustering analysis with two, three and four clusters on first six PCs from PCA on numeric data and first two components from MCA on categorical data. (F) Same as E for spectral clustering. (G) Clustering result for K-Means (upper) and spectral (lower) analysis visualized on first two PCs for two, three and four clusters (from left to right).
Correlations of features across subject groups revealed that behavioral features correlated significantly more than psychological features (T-test: t1400 = 4.55, p < 0.001). There was significantly less correlation within features in the affective group compared to control (t2900 = 5.63, p < 0.001) and non-affective group (t2900 =5.27, p < 0.001) (Supplement, Fig. 1).
We performed K-Means clustering on joint components of the PCA on numerical data (six significant components, Fig. 2 B, blue components) and MCA on categorical data (two significant components). Results for all PCAs and MCAs are presented in the supplementary section Results PCA and MCA. Clustering with only two clusters did not successfully separate patients and controls. Using three clusters, resulted in 87% of controls (Note: Percentages are presented in relation to specific group, and in relation to the individuals of the cluster) classified in cluster 1, however, also patients were assigned to this cluster (34% of affective and 19% of non-affective patients). Performing K-Means clustering with four clusters, yielded a cluster that comprised 83% of control subjects, with fewer patients, specifically 28% of affective and 16% of non-affective patients. K-means clustering revealed that separation of affective and non-affective patients was challenging (Fig. 2E,G upper). However, non-affective patients were more clearly separated from controls compared to affective patients: for three (four) clusters 34% (28%) of affective and 19% (16%) of non-affective patients were situated in cluster 1 with 87% (83%) of controls.
Performing spectral clustering on the preprocessed data allowed a more successful separation of patients and control when clustering with two clusters (Fig. 2F,G lower). Although a separation of affective and non-affective patients was still not possible with spectral clustering, clustering with four clusters identified a subgroup containing 32% of the non-affective patients which has minimal overlap with the affective patients (2%) and controls (2%).
3.2 Brain Data
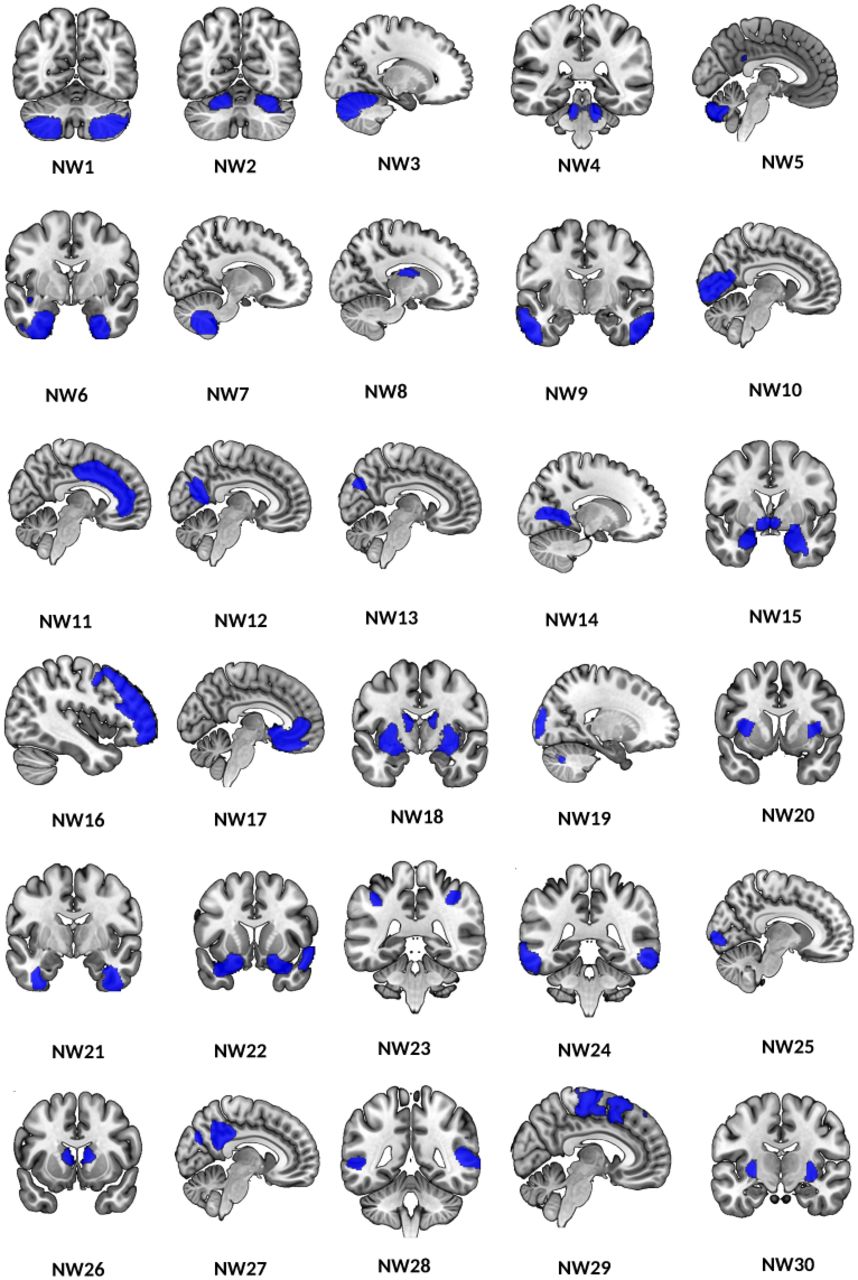
We performed subject-based correlations of the raw grey matter volume and examined the variance of subject-based correlations for each group (Fig. 3, brain regions included in morphometric networks are described in supplementary section 4.2 Brain Data).

This figure shows the 30 anatomically derived morphometric networks from the ICA thresholded at Z>3.5, each network identifies structural grey matter covariance across all subjects.
Fig. 4A indicates that subject groups show a similar homogeneity. Variance between groups did not differ significantly. Mean correlation coefficients were only significantly different between control and affective subjects, with correlations significantly smaller within controls (T-test: t11896 =6.88, p < 0.001). Feature correlations of grey matter values within each group revealed highest correlation within non-affective compared to controls (T-test: t1798 = 22.09, p <0.001) and affective (t1798 =22.09, p < 0.001) and lowest correlations of features within controls (t1798 =11.50, p < 0.001) (Supplement, Fig. 3).

(A) Correlation between subjects on raw grey matter values. Correlations within groups are displayed on diagonal squares and correlations between groups on off-diagonal squares. (B) Variance explained by each of the principal components (PCs) in % of a PCA performed on all 30 corrected gray matter volumes across 178 subjects. The first four PCs (blue) survived permutation testing (p < 0.05, 5000 permutations). Significant components captured 57.1% of all variance. (C) Ratio of the three subject groups. Of 178 subjects in total, 32.0% were part of control, 15.7% of affective and 52.2% of non-affective group. (D) The first two PCs are visualized and colored according to groups. (E) Percentage of subjects of a group in each cluster, for K-Means clustering analysis with two, three and four clusters on significant PCs. (F) Same as E for spectral clustering on first ten PCs, which yielded better results than four. (G) Clustering result for K-Means (upper) and spectral (lower) analysis visualized on first two PCs for two, three and four clusters.
The PCA analysis (supplementary section 2 Results) did not allow a separation of the three groups, which is also reflected in the clustering analysis. K-Means clustering was conducted on the significant principal components (four) and spectral clustering was conducted on the first 10 principal components (see Methods). Neither K-Means clustering nor spectral clustering were able to separate the groups based on the brain data (Fig. 4E-G).
3.3 Brain and Non-Brain Data
Finally, we investigated whether the clustering performance would improve when combining behavioural, psychological, and demographic data with brain data. Grey matter values correlated with cognitive features more strongly compared to psychological features (T-test: t1558 = 10.41, p < 0.001) (Fig. 5A).

(A) Correlations between subjects on combined numerical features of non-brain and raw brain data. Correlations within groups displayed on squares on diagonal, and correlations between groups displayed on off-diagonal squares. (B) Ratio of the three subject groups. Of 151 subjects in total, 35.2% were part of control group, 14.8% of affective and 50.0% of non-affective group. (C) Correlation between 48 numerical non-brain data, and 30 raw grey matter values across all subjects. Squares on diagonal show correlations within a feature group, squares off-diagonal show correlations between feature groups. (D) Plots show results of clustering non-brain data and combined data with matched subjects. Results of K-Means clustering are displayed on the left and results of spectral clustering on the right.
Non-brain data with fewer subjects still showed no significant difference in mean or variance. We studied the subject-based correlations of combined data. Subject correlations of combined data were significantly higher compared to non-brain data only (T-test: t45600 = 62.18, p < 0.001). The correlations are highest within controls compared to affective (T-test: t2690 = 18.55, p < 0.001) and non-affective (t8675 = 26.03, p < 0.001) and lowest in the non-affective group (t7135 = 6.29, p < 0.001) compared to the affective psychosis group (Fig. 5B). The highest inhomogeneity was again found within non-affective subjects, compared to controls (Levene’s test for equal variance: F1,125 = 125.97, p < 0.001) and affective subjects F1,103 = 58.76, p < 0.001).
Because of fewer subjects in the combined data set, we performed the clustering analysis on the behavioural, psychological and demographic data with matching subjects again, to compare the clustering performance based on added features only (Supplement, Fig. 6). Clustering on combined data with K-Means or Spectral clustering showed no improvement of performance (Fig. 5D).

(A) Percentage of group in each cluster, resulting from spectral clustering of behavioural data of all subjects with four clusters, as described in Fig. 2F). (B) Correlation of clinical and cognitive scores across all patients (affective and non-affective) controlled for assigned clusters. Only significant correlation scores are indicated. (C) Clinical scores of patients (affective and non-affective) displayed in boxplots for each cluster.
3.4 Clinical Data
We identified three significant principal components in numerical features, that captured 47.9% of total variance (permutation test p < 0.05, 5000 permutations). We performed K-Means clustering on three significant PCA components. Clustering with two clusters separated affective and non-affective patients with medium sensitivity. One cluster consisted of 63% of non-affective patients, while the other cluster consisted of 78% of the affective psychosis patients (Supplements, Fig 8 D, E). Spectral clustering on significant components did not result in better separation of patients, one cluster comprising 76% of affective and the other one 63% of non-affective patients 10).
3.5 Cluster Exploration with Clinical and Cognitive Scores
To identify possible cognitive subtypes represented in the clusters, we explored clinical and cognitive scores (Tab. 2) for the four clusters of the spectral clustering analysis for the complete data set of 217 subjects for non-brain data (see Fig. 2G lower right). For clinical scores, only patient data were included. See supplementary section 2.5 Cluster Exploration for further detail.
We found clear differences in PANSS scores comparing clusters. Patients in cluster 1, which included the majority of controls, 75%, (N non-affective: 12, N affective: 9, N controls: 41), showed reduced clinical scores in all domains. Cluster 1 was chosen as the clinical reference cluster, revealing lowest overall clinical scores. Cluster 3, which included the same number of affective and non-affective patients (N non-affective: 26, N affective: 26, N controls: 6) showed the greatest distributions in clinical scores, but only showed significantly higher scores in the general psychopathology compared to cluster 1. Patients in cluster 2, which included mainly non-affective subjects (N non-affective: 36, N affective: 1, N controls: 1), showed significantly higher clinical scores in all scores but PANSS positive. However, cluster 2 showed especially high negative symptoms scores. Patients in cluster 0 (N non-affective: 37, N affective: 15, N controls: 7) showed increased scores in all except the negative symptom scores and furthermore showed particularly high scores in the positive scores (Fig. 6C, see Tab. 2 for group comparison).
Cognitive scores were compared across patients in specific clusters and control subjects, see Table 2 for statistical comparisons and for boxplots and description see Supplement (Fig. 11).
Cognitive and clinical scores of patients in clusters of non-brain data compared to cognitive scores of all controls. The table contains the Kruskal-Wallis H statistic and p-values, corrected for multiple comparisons.
We furthermore conducted a partial correlation analysis, correcting for cluster membership, to investigate correlations between cognitive scores and symptom expression across all clusters (Fig. 6B). The results revealed negative correlations between negative symptoms and crystallized cognition, impulsive decision making, oral reading recognition, picture vocabulary test, total IQ, verbal IQ and auditory attention; negative correlations between general psychopathology and fluid cognition, crystallized cognition, executive functioning, selective attention and oral reading recognition; and finally, negative correlations between positive symptoms and fluid cognition and executive functioning.
4 Discussion
This study investigated data-driven clustering in a cross-diagnostic sample combining affective and non-affective psychosis patients as well as healthy controls using behavioural, demographic, psychological and structural brain data, but no information regarding diagnostics. We found that best group-cluster matching was achieved using PCA-pre-selected, mostly behavioural features (i.e., features that describe cognitive functioning and cognition in general) with non-brain data spectral clustering. The results showed that the three groups (i.e., affective psychosis, non-affective psychosis, controls) were clustered according to their group membership with medium sensitivity (i.e., correct identification of group membership), correctly identifying between 44% and 78% of individuals. More importantly, however, clustering using four clusters allowed the identification of cognitive subtypes, which significantly varied in clinical and cognitive impairment. With one cluster expressing the lowest symptom scores across all four categories (i.e., PANSS total, PANSS positive, PANSS negative and general psychopathology) and unimpaired cognition (i.e., similar to controls), and one other cluster with the highest symptom scores, especially negative symptoms, and global cognitive impairments, across all domains.
In this cognitively intact cluster, 13% (21/162) of the total number of patients were included. Interestingly, this cluster held only 10.8% of all non-affective psychosis (12/111) patients, but 17.7% of all affective psychosis patients (9/51). Given the link between reduced overall symptoms and maintained cognition, this might not be surprising, as non-affective psychosis patients in this study showed stronger overall symptoms. Using only cognitive data Lewandowski and colleagues [45] found a four-cluster solution to provide the best fit to their data, with one globally impaired cluster, for which cognitive deficits were associated with symptom severity and poorer functioning [45]. Moreover, in our data, we found one cluster (cluster 2) for which patients showed global cognitive impairment, for all scores except decision impulsivity. This cluster also showed the highest values in the negative symptoms (i.e. negative PANSS), and general psychopathology. Interestingly, for positive symptoms, we did not find a significant difference between cluster 2 and cluster 1, the cognitively intact reference cluster, indicating that the cognitive deficits occur in those subjects with strong negative symptoms [51], but importantly independent of diagnosis (i.e., affective vs. non-affective psychosis). The two remaining clusters showed mixed cognitive and symptom profiles. Cluster 0 was characterized by significant cognitive impairment across all cognitive scores compared to controls, however, patients in this cluster performed significantly better in all categories except for impulsive decision making compared to those in cluster 2. Furthermore, cluster 0 patients performed worse than those in the cognitively preserved cluster 1 in measures of fluid cognition, decision impulsivity, episodic memory and auditory attention. Importantly, however, patients in cluster 0 showed significantly enhanced positive symptom scores compared to cluster 1 and 3. Finally, patients of cluster 3 were similar to the cognitively intact cluster 1, but were significantly different from controls across several domains, especially in fluid cognition, episodic memory, selective attention and auditory attention. Patients of cluster 3 showed similar symptom expressions to the cognitively preserved cluster 1, except for increased general psychopathology. The overall structure of cognitive clusters identified in this study supports findings discussed in a recent meta analysis of data driven identification of cognitive phenotypes in schizophrenia [46]. Characteristic to all cluster solutions is the presence of a cognitively spared, one or multiple intermediate and a deficit subgroup [46]. Our work extends this research by showing (1) that these cognitive phenotypes exist independent from the primary diagnosis (i.e., affective or non-affective psychosis); (2) that different clustering methods (i.e., k-means and spectral clustering) yielded highly similar cluster representations with specific symptoms profiles, also in the intermediate phenotypes. The inclusion of other data types, such as grey matter data, which is also associated with cognitive deficits, did not improve the clustering (see discussion below), confirming that the heterogeneity of cognitive profiles can be reliably captured with cognitive task data. Our results indicate that patient classification and diagnosis solely based on International Statistical Classification of Diseases (ICD)/Diagnostic and Statistical Manual of Mental Disorders (DSM) [52, 53] may provide a description of patients which is too general, potentially ignoring options for interventions and treatment development, such as cognitive remediation.
Our correlation analysis revealed that stronger cognitive deficits are linked to stronger negative symptoms, and symptoms or general psychopathology. Although it has been suggested that negative and cognitive symptoms are separable domains which require independent treatment development [54], many studies show an association between cognitive deficits and negative symptoms across all stages of the disease [27, 55–59]. Interestingly, our correlation analysis also revealed specific links between positive symptoms and cognitive deficits, specifically between fluid cognition and executive functioning. Other studies did not find associations between positive symptoms and cognitive deficits [59, 60], although a common mechanism within the dopaminergic system has been discussed [61]. A recent study by Horwood and colleagues [62] showed that lower IQ was linked to positive psychotic symptoms in adolescents, where hallucinations and delusions were only present in those with significantly reduced IQ. Guillem and colleagues [63] specifically investigated the relationship between positive symptoms and deficits in executive functioning. Their findings showed that increased inference sensitivity was associated with hallucinations potentially revealing deficits in thought monitoring, and that disorganization and lack of inhibition was linked to delusional thinking. These studies in combination with our findings may further emphasize the need for interventions targeted at cognitive deficits, as they in turn may improve positive and negative symptoms, as indicated in single studies on cognitive remediation therapy [64, 65].
Furthermore, our study shows that clustering on behavioural data alone resulted in good separation of patients and controls, as well as subtypes. Incorporating structural brain data into the clustering analysis of behavioural, psychological and demographic data did not improve the performance significantly. This is interesting as alterations in grey matter volume have been associated with an increased risk for psychosis and disease development [66–68], and provided the basis for good classification in a recent multicohort-study [69], as well as in earlier studies [70, 71], although classification results are inconsistent [72] and these previous studies contained different patient groups. Future research should investigate whether functional brain data, either resting state or task, or white matter connectivity data may increase the specificity of the clustering. Additionally, further improvement of clustering and identification of cognitive phenotypes may be achieved through the selection of specific behavioural tasks and cognitive domains. Moreover, advanced analysis strategies, e.g., computational modelling may improve clustering [73, 74], as it provides the opportunity to identify and mathematically differentiate behaviourally parameters, which were found to be reliable and unique across individuals [75].
In conclusion, these results provide evidence for the presence of cognitive phenotypes with specific symptom expressions combining individuals with different overall diagnoses, potentially overcoming traditional diagnoses. Considering the clear link between the cognitive deficits and symptom expression, this study is drawing attention to the need for the development of cognition based treatment and interventions that goes beyond traditional diagnoses classifications.
Data Availability
All data produced in the present study are available upon reasonable request to the authors
Footnotes
Conflict of Interest: None of the authors declares a conflict of interest.
Funding: FK received funding from the European Union’s Horizon 2020 [Grant number 754462].
References
- [1].↵
- [2].
- [3].
- [4].↵
- [5].↵
- [6].↵
- [7].↵
- [8].↵
- [9].↵
- [10].↵
- [11].↵
- [12].↵
- [13].↵
- [14].↵
- [15].↵
- [16].↵
- [17].↵
- [18].
- [19].
- [20].
- [21].↵
- [22].↵
- [23].↵
- [24].↵
- [25].↵
- [26].↵
- [27].↵
- [28].↵
- [29].↵
- [30].
- [31].↵
- [32].↵
- [33].↵
- [34].↵
- [35].↵
- [36].↵
- [37].↵
- [38].↵
- [39].↵
- [40].↵
- [41].↵
- [42].↵
- [43].↵
- [44].↵
- [45].↵
- [46].↵
- [47].↵
- [48].↵
- [49].↵
- [50].↵
- [51].↵
- [52].↵
- [53].↵
- [54].↵
- [55].↵
- [56].
- [57].
- [58].
- [59].↵
- [60].↵
- [61].↵
- [62].↵
- [63].↵
- [64].↵
- [65].↵
- [66].↵
- [67].
- [68].↵
- [69].↵
- [70].↵
- [71].↵
- [72].↵
- [73].↵
- [74].↵
- [75].↵


