
Abstract
The Delta SARS-CoV-2 variant has spread quickly since first being identified. To better understand its epidemiological characteristics and impact, we utilize multiple datasets and comprehensive model-inference methods to reconstruct COVID-19 pandemic dynamics in India, where Delta first emerged. Using model-inference estimates from March 2020 to May 2021, we estimate the Delta variant can escape adaptive immunity induced by prior wildtype infection roughly half of the time and is around 60% more infectious than wildtype SARS-CoV-2. In addition, our analysis suggests that the recent case decline in India was likely due to implemented non-pharmaceutical interventions and weather conditions less conducive for SARS-CoV-2 transmission during March – May, rather than high population immunity. Model projections show infections could resurge as India enters its monsoon season, beginning June, if intervention measures are lifted prematurely.
Main text
The Delta variant (PANGO lineage: B.1.617.2) is a SARS-CoV-2 variant of concern (VOC) as classified by the World Health Organization (WHO) and several governments.1-4 First identified in December 2020 in India, Delta has spread quickly to over 60 countries (GISAID,5 as of June 16, 2021), likely due to its ability to evade immunity from prior wildtype infection and higher transmissibility. Laboratory studies have found varying levels of neutralizing ability for prior convalescent sera and vaccinee sera against Delta, ranging from similar potency6,7 to a 5.0-6.9 fold reduction.8 Field observations have shown a lower vaccine efficacy (VE) for the 1st vaccine dose against Delta (VE = ∼34% vs. ∼51% against Alpha, for the BNT162b2 and ChAdOx1 vaccines) but similar VE after the 2nd vaccine dose.9 In addition, epidemiological studies in the UK found a higher secondary attack rate2 and growth rate10 for Delta than the Alpha variant, explaining its rapid rise and displacement of Alpha in the UK. However, not all places have experienced the same rapid variant displacement (e.g., thus far the Beta variant remains the dominant variant in South Africa during its ongoing 3rd pandemic wave11) and in India, the second pandemic wave caused by Delta has started to decline after several weeks of intense transmission. To better understand the epidemiological characteristics and impact of Delta, here we utilize multiple datasets and comprehensive modeling to reconstruct COVID-19 pandemic dynamics in India during March 2020 – May 2021 and quantify the immune escape potential and transmissibility for Delta. We also use model projections to examine the potential impact of Delta in India over the next 6 months.
The first COVID-19 pandemic wave in India, March 2020 – January 2021
From January 2020 to January 2021 India recorded over 10 M COVID-19 cases (0.77% of its population); however, a nationwide serology survey suggested that ∼24% of its population had been infected by December 2020.12 Accounting for under-detection of infection (Fig S1), implemented non-pharmaceutical interventions (NPIs), seasonality, and vaccination, we used a model-inference system to reconstruct pandemic dynamics in India since March 2020 (Fig 1A). Model-estimated infection rates closely match with measurements from three nationwide serologic surveys conducted during the early, mid, and late phases of the first pandemic wave (Fig 1B). Our analysis indicates that the 2-month long national lockdown (March 24 – May 31, 2020) and the less favorable weather conditions during summer (i.e., March – May) at the time likely contributed to the low infection rates initially. By mid-May 2020, the model-inference system estimates that only 0.32% (95% CrI: 0.07 – 1.2%) of the population had been infected [vs. 0.73% (95% CI: 0.34%, 1.13%) among adults estimated by serosurvey13]. As the country lifted its lockdown in June 2020 and entered the monsoon season (June – September) when conditions are likely more favorable for transmission (Fig 1C), the first pandemic wave began. Nevertheless, continued regional restrictions during June – November 2020 and less favorable weather conditions during the autumn (October – November; see mobility and seasonal trends in Fig 1C) likely mitigated pandemic intensity. The estimated mean of the reproduction number Rt (i.e., average number of secondary infections per primary infection) was above 1 but less than 1.3 from early June to mid-September; in addition, Rt dropped transiently below 1 during October – November (Fig 1D). By the end of January 2021 when case rates reached a minimum following the first wave, the model-inference system estimates that 25.1% (95% CrI: 15.3 – 37.3%) of the population had been infected (Fig 1B).

Estimated infection-detection rate (A) and infection-fatality risk (B) during each week of the study period. For comparison, estimated weekly infection rates are superimposed in each plot (right y-axis). Blue lines and surrounding areas show model estimated mean, 50% and 95% CrIs. Boxes and whiskers show model-estimated weekly infection rates (mean, 50% and 95% CrIs). Grey shaded boxes indicate the timing of lockdowns (darker) or local restrictions (lighter); horizontal arrows indicate the timing of variant identification and vaccination rollout. Note that infection-fatality risk estimates were based on reported COVID-19 deaths and may not reflect the true values due to the likely under-reporting of COVID-19 deaths.
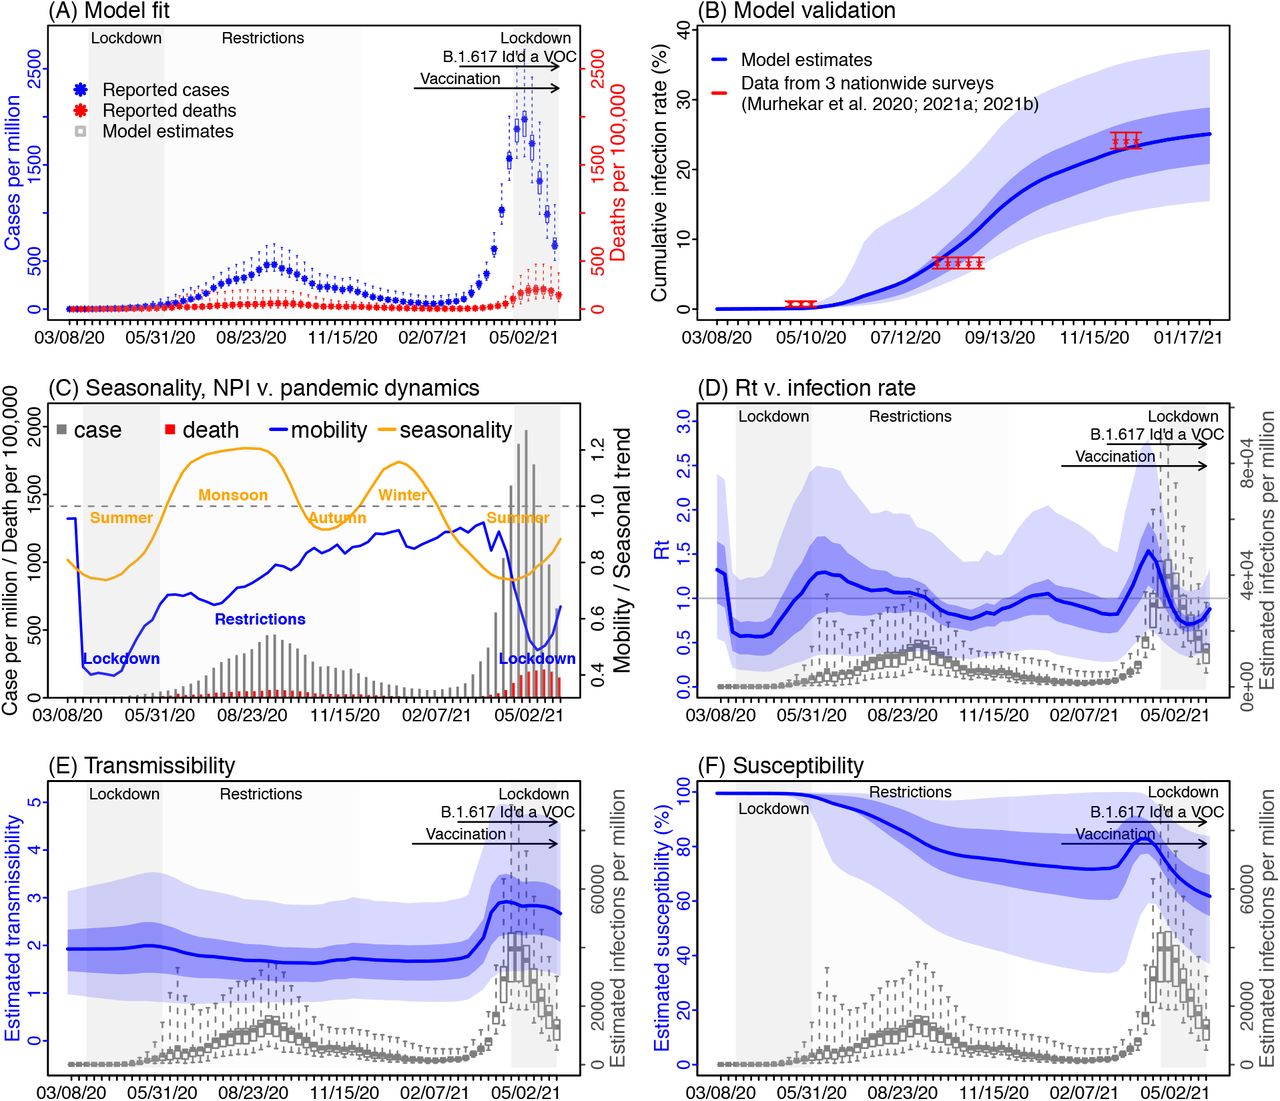
Model-inference estimates and validation. (A) Model fit. (B) Model validation. (C) Observed relative mobility and estimated disease seasonal trend, compared to case and death rates over time. Key model-inference estimates are shown for the real-time reproduction number Rt (D), transmissibility (E), and population susceptibility (F). Blue lines and surrounding areas show the estimated mean, 50% (dark) and 95% (light) CrIs. Boxes and whiskers show the estimated mean, 50% and 95% CrIs for weekly cases and deaths in (A) and infection rates in (D) – (F). Grey shaded areas indicate the timing of national lockdowns (darker) or local restrictions (lighter); horizontal arrows indicate the timing of variant identification and vaccination rollout. In (C), for mobility (blue line; y-axis), values below 1 (dashed horizontal line) indicate reductions due to public health interventions. For the disease seasonal trend (orange line; y-axis), values above 1 indicate weather conditions more conducive for transmission than the yearly average and vice versa. Note that the transmissibility estimates have removed the effects of changing population susceptibility, NPIs, and disease seasonality; thus, the trends are more stable than the reproduction number (Rt; left column) and reflect changes in variant-specific properties.
The second pandemic wave in India and estimated epidemiological characteristics of Delta
Unexpectedly, infections resurged dramatically in late March 2021 largely due to the rise of the Delta variant. Despite a weeks-long second national lockdown implemented beginning April 20, 2021, India reported another 17 million cases during March – May 2021, about twice the number reported during the previous 14 months. Accounting for under-detection (Fig S1), we estimate that 26.3% (95% CrI; 15.6 – 46.2%) of the population were infected during this 3-month period, including reinfections. This intense transmission was likely facilitated by the higher transmissibility as well as immune evasive nature of the Delta variant. Estimated transmissibility increased substantially during the second pandemic wave (Fig 1E). In addition, estimated population susceptibility increased at the start of the second pandemic wave (Fig 1F), suggesting loss of population immunity against Delta. Due to this immune escape, an estimated 61.8% (95% CrI: 36.8 – 83.9%) of the population remained susceptible at the end of May 2021, despite two large pandemic waves and rollout of mass-vaccination (of note, 13% of the population had received at least 1 dose of vaccine by the end of May 2021). These findings along with the seasonal trends described above suggest that the decline of the second wave was largely due to the NPIs implemented and less favorable weather conditions during March – May, rather than high population immunity.
Combining the model-inference estimates during the first and second pandemic waves in India, we estimated that Delta was able to escape immunity from prior wildtype infection 45.8% (95% CI: 0 – 67.6%) of the time and was 60.1% (95% CI: 46.0 – 80.8%) more infectious than wildtype SARS-CoV-2.
Implications for COVID-19 dynamics in India
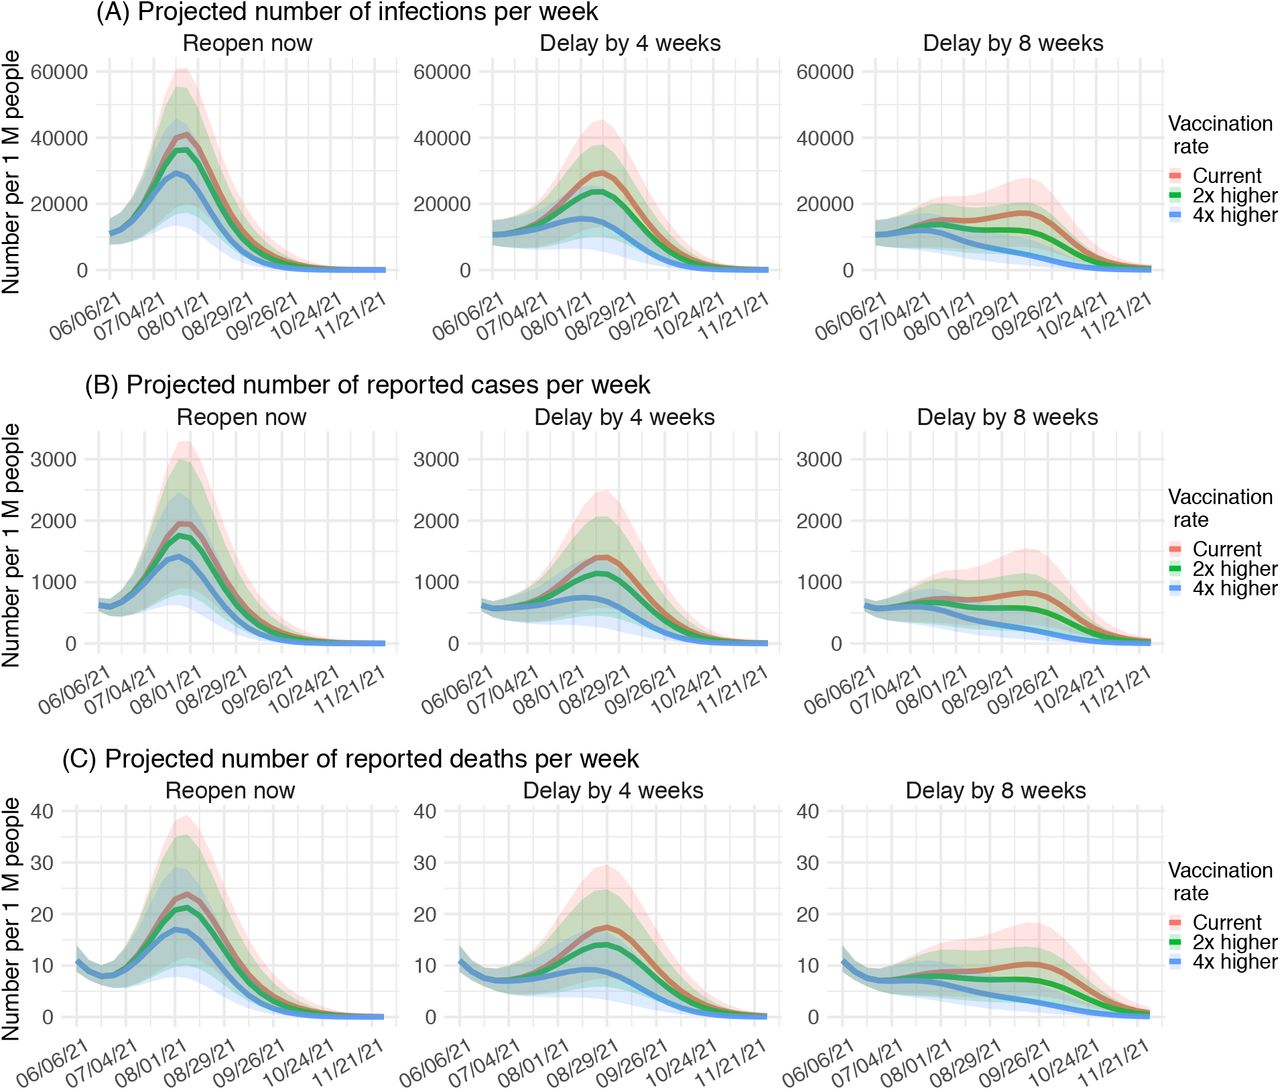
Given the estimated seasonal trends, population susceptibility, and epidemiological characteristics of Delta, we used the calibrated model to project pandemic dynamics in India over the next 6 months (i.e. June – November 2021) under different intervention and vaccination scenarios. We considered 3 NPI scenarios: i) gradual reopening starting June 2021 and resuming all activities by mid-July 2021; ii) delaying the reopening by 4 weeks; and iii) delaying the reopening by 8 weeks. In addition, for each NPI scenario, we considered 3 vaccination scenarios: i) current vaccination rate based on data from May 2021; ii) increasing the vaccination rate to twice the current rate; and iii) increasing the vaccination rate to four times of the current rate. For all vaccination scenarios, we assumed up to 80% of the population would be vaccinated (of note, ∼24% of India’s population is below 12 years of age, an age cut-off for COVID-19 vaccination in some countries at present).
Model projections indicate that, as India enters its monsoon season (June – September) with weather conditions more favorable for transmission, infections could resurge, causing a third wave of magnitude similar to the second wave, if NPIs are lifted starting in June (Fig 2; 1st column); accelerating the rollout of mass-vaccination (up to 4 times the current rate) could temper the peak burden but likely would not be sufficient to prevent this resurgence (comparing the different colored lines in Fig 2; 1st column). In contrast, delaying the easing of NPIs could allow India to mitigate the higher transmission risk during the monsoon season and substantially reduce the peak burden. Combining a delay of 4 weeks with a much faster vaccination rollout (e.g., 4 times the current rate) and very high vaccination coverage could help to keep infection rates at levels similar to those observed during late May 2021 (Fig 2, 2nd column, blue lines). However, without a faster vaccination rollout, a delay of reopening by 8 weeks may be needed to keep infection rates at the current level (Fig 2, 3rd column).

Model projections of weekly number of infections (A), reported cases (B) and reported deaths (C) for India during June – November 2021, under different scenarios of NPIs and vaccination rates. All numbers are scaled per one million people. Lines show the projected median and shaded areas show projected interquartile ranges.
Discussion
Combining epidemiological, behavioral, and weather observational data with a comprehensive model-inference system, we estimate that the Delta SARS-CoV-2 variant can escape immunity from prior wildtype infection roughly half of the time and is around 60% more infectious than wildtype SARS-CoV-2. In addition, our analysis suggests that the recent case decline in India was likely due to the lockdown and weather conditions less conducive for SARS-CoV-2 transmission during March – May. As India enters its monsoon season starting in June, infections could resurge if intervention measures are lifted prematurely.
Previously, we have estimated the changes in transmissibility and immune escape potential for three other major SARS-CoV-2 VOCs: namely, a 46.6% (95% CI: 32.3 – 54.6%) increase in transmissibility but nominal immune escape for Alpha (i.e., B.1.1.7), a 32.4% (95% CI: 14.6 – 48.0%) increase in transmissibility and 61.3% (95% CI: 42.6 – 85.8%) immune escape for Beta (i.e., B.1.351), and a 43.3% (95% CI: 30.3 – 65.3%) increase in transmissibility and 52.5% (95% CI: 0 – 75.8%) immune escape for Gamma (i.e., P.1). Compared with Alpha, the estimated transmissibility for Delta is around 10-20% higher, in addition to a more pronounced ability to evade immunity from wildtype infection. Data from the UK have shown that the secondary attack rate for contacts of cases with Delta was around 1.5 times higher than Alpha (12.4% vs. 8.2%), during March 29 – May 11, 2021.2 In a partially immunized population, the secondary attack rate reflects the combined outcome of the transmissibility of the etiologic agent and population susceptibility to that agent. Our estimates of the relative transmissibility and immune escape potential for Delta and Alpha are thus in line with these reported secondary attack rates (i.e., combining the 10-20% increase in transmissibility with <∼50% increase in susceptibility due to immune evasion for prior natural infection and, to a lesser extent, vaccination). This higher competitiveness of Delta over Alpha thus explains the rapid variant displacement observed in the UK, which may occur in other regions with similar variant prevalence. Compared to Beta and Gamma, the estimated transmissibility for Delta is higher but the estimated immune escape potential is lower. In combination, Delta may be similarly or more competitive than Beta and Gamma. As a result, the future dynamics of Delta in regions with high current Beta/Gamma prevalence are less clear, and continued monitoring of all these variants is warranted.
Our analyses here also point to the important dynamic interactions with disease seasonality. While the model used to estimate COVID-19 seasonal trends was developed for influenza;14 studies have shown a similar impact of humidity and temperature on SARS-CoV-2 transmission as observed for influenza.15,16 In addition, our previous estimates for Beta and South Africa using the same model appear to have been borne out by observations from South Africa – that the decline during the second wave was in part due to less conducive weather conditions during summer and that infections could resurge (which is indeed occurring) during winter. For India, the model estimates two seasons (i.e., the monsoon season during June – September and winter during December – January) would experience higher virus transmission; this seasonality in combination with the implemented NPIs explain much of the COVID-19 pandemic dynamics observed thus far in India. Using this seasonality, our model estimates and projections suggest that, similar to South Africa, a third wave is possible when India enters the more transmission-favorable monsoon season starting in June. To mitigate the risk of this resurgence, continued NPIs would be needed in addition to a fast rollout of mass-vaccination.
Due to a lack of detailed epidemiological data (e.g., age-specific and subnational) and thus model simplification, our estimates have large uncertainties as indicated by the large confidence intervals. Nevertheless, these estimates are in line with independent data from three nationwide serology surveys conducted at three time points during the first pandemic wave in India (Fig 1B), as well as contact tracing data from the UK,2 as discussed above; these consistencies support the accuracy of our estimates. Unlike estimates from the contact tracing data, however, here we are able to separately quantify the changes in transmissibility and immune escape potential of the Delta variant. These estimates could support better understanding of future SARS-CoV-2 variant dynamics given local prior infection rates, variant prevalence, and vaccination coverage. Overall, our findings suggest Delta remains a major public health threat in India, despite the recent intense pandemic wave caused by this variant and the declining trend. Given its high transmissibility and immune escape potential, it is also critical that other regions prepare for the potential impact of Delta in the coming weeks or months.
METHODS
Data sources and processing
We used reported COVID-19 case and mortality data to capture transmission dynamics, weather data to estimate disease seasonality, mobility data to represent concurrent NPIs, and vaccination data to account for changes in population susceptibility due to vaccination in the model-inference system. COVID-19 case and mortality data from the week of March 8, 2020 (the first week COVID-19 deaths were reported in India) to the week of May 30, 2021 came from the COVID-19 Data Repository of the Center for Systems Science and Engineering (CSSE) at Johns Hopkins University.17,18 Surface station temperature and relative humidity were derived from the Integrated Surface Dataset (ISD) maintained by the National Oceanic and Atmospheric Administration (NOAA) and were accessed using the “stationaRy” R package.19,20 We computed specific humidity using temperature and relative humidity per the Clausius-Clapeyron equation.21 We then aggregated these data for all weather stations in India (n = 498 stations) with measurements since 2000 and calculated the average for each week of the year during 2000-2020. Mobility data were derived from Google Community Mobility Reports;22 we aggregated all business-related categories (i.e., retail and recreational, transit stations, and workplaces) in all locations in India to weekly intervals. Vaccination data (1st and 2nd dose) were obtained from Our World in Data.23,24
Model-inference system
The model-inference system was developed and described in detail in our previous study.25 In brief, we computed the disease seasonal trend (i.e., the relative reproduction number for each week of the year; see Fig 1C), based on temperature and specific humidity and parameter estimates from Yuan et al.14 These estimates were then incorporated into a susceptible-exposed-infectious-removed-susceptible-vaccination (SEIRSV) model to account for disease seasonality. The model also used observed mobility data to account for ongoing NPIs and included an infection-detection-rate parameter to account for under-detection. The SEIRSV model was run in conjunction with the ensemble Kalman adjustment filter (EAKF)26 – a Bayesian inference method – and weekly case and mortality data to examine multiple potential combinations of changes in transmissibility and immune escape potential. The most plausible combination was then identified based on model goodness-of-fit and accuracy of one-step-ahead predictions. Importantly, as the model-inference system decouples the effects on transmission dynamics due to changing population susceptibility, NPIs, seasonality, and variant-specific transmissivity, it is able to estimate the variant-specific transmissibility (i.e., after removing the effects of the former three factors; vs. Rt combining all factors; Fig 1 E vs. D) as well as immune escape potential. This model-inference system has been validated using model-generated synthetic datasets where the true parameter values are known, as well as by comparing model estimates for the UK, South Africa, and Brazil – the three countries where the Alpha, Beta, and Gamma variants were first identified – to available independent observations from each country. For details on model validation, the SEIRSV model, and the EAKF filtering process, please see the main text and supplement of Yang and Shaman.25 To account for model stochasticity, we repeated the model-inference process 100 times, each with 500 model realizations and summarized the results from all 50,000 model estimates.
Model validation using independent data
To compare model estimates with independent observations not assimilated into the model-inference system, we identified three measurements of cumulative infection rates from three nationwide serology surveys in India: i) the first national serosurvey conducted during May 11 – June 4, 2020 (n = 28,000 adults 18 years or older);13 ii) the second national serosurvey conducted during August 18 – September 20, 2020 (n = 29,082 individuals 10 years or older);27 and iii) the third national serosurvey conducted during December 18, 2020 – January 6, 2021 (n = 28,598 individuals 10 years or older).28 To account for the delay in antibody generation, we shifted the timing of each serosurvey 14 days when comparing survey results to model-inference system estimates of cumulative infection rates in Fig 1B.
Model projection
Model projections of infections (including asymptomatic and mild cases not reported as cases), reported cases, and reported deaths were generated by integrating the SEIRSV model forward stochastically for 6 months beginning the week of June 6, 2021. Model-inference estimates made at the week of May 30, 2021 (e.g., population susceptibility and the transmissibility of Delta) were used to initialize the model ensemble. For the three NPI scenarios tested, we used the changes in population mobility as a proxy and projected mobility as follows. For the first scenario assuming reopening starting in June 2021, we used mobility data in May 2021 (i.e. the most recent 4 weeks) in a linear regression model to estimate the weekly increase in mobility and then extrapolated this trend to project mobility in future weeks, capping it at the maximum level observed during March 2020 – May 2021. For the NPI scenario assuming a 4 (or 8) week delay of reopening, we kept mobility during the first 4 (or 8) weeks at the same level as the week of May 30, 2021 and projected values for the following weeks as in the first NPIs scenario. For the three vaccination scenarios tested, we averaged the reported vaccination rate (i.e., number of doses given per week) in May 2021 (i.e. the most recent 4 weeks) to compute the baseline vaccination rate; of note, the vaccination rate for the 2nd dose was very low in May; we thus instead set it to one-third of the vaccination rate reported for the 1st vaccine dose. For a vaccination rate of 2 (or 4) times current rates, we multiplied the baseline rates by 2 (or 4). For all vaccination scenarios, we assumed up to 80% of population would be vaccinated. At present the Covaxin and Oxford/AstraZeneca vaccines are used in India, we thus assumed a VE of 33% fourteen days after the 1st dose and 60% seven days after the 2nd dose based on VE data for the AstraZeneca vaccine against Delta.9 As for the model-inference runs, we repeated the projections for each scenario 100 times (each with 500 model realizations) and summarized the projections from all 50,000 runs.
Data Availability
All data used in this study are publicly available as described in the Data sources and processing section.
Data Availability
All data used in this study are publicly available as described in the “Data sources and processing” section.
Code availability
All source code and data necessary for the replication of our results and figures will be made publicly available.
Competing interests
JS and Columbia University disclose partial ownership of SK Analytics. JS discloses consulting for BNI.
Acknowledgements
This study was supported by the National Institute of Allergy and Infectious Diseases (AI145883 and AI163023), the National Science Foundation Rapid Response Research Program (RAPID; DMS-2027369) and a gift from the Morris-Singer Foundation.
References


