
Abstract
The city of Manaus, north Brazil, was stricken by a severe epidemic of SARS-Cov-2 in March 2020, reaching a seroprevalence of 76% by October 2020. Nevertheless, in late November an abrupt increase in hospitalizations and deaths hit Manaus, causing higher number of deaths compared to the first epidemic wave. It has been hypothesized that virus lineages circulating in the second wave, namely the P.1 variant of concern first detected in early December in Manaus, could be better at evading immunity generated in response to previous infection with other lineages.
In order to estimate the reinfection rate during the resurgence of SARS-CoV-2 in Manaus, we tested serial samples from 238 unvaccinated repeat blood donors using a SARS-CoV-2 anti-N IgG chemiluminescence microparticle assay. Blood donors were divided into six groups that reflected the inferred sequence of infection and reinfection with non-P.1 and P.1 variants. We assumed that reinfections induce a recrudescence (or “boosting”) of plasma anti-N IgG antibody levels, yielding a V-shaped time series of antibody reactivity levels.
We infer that 16.9% (95% CI [9.48%, 28.5%]) of all presumed P.1 infections that were observed in 2021 were reinfections. If we also include cases of probable or possible reinfections (defined by considering the time period when the antibody levels are expected to grow after recovery and the range of half-lives for antibody waning after seroconversion), these percentages increase respectively to 25.8% (95% CI [16.7%, 37.4%]), and 31.0% (95% CI [21.4%, 42.5%]). Our data suggest that reinfection due to P.1 is common and more frequent than what has been detected by traditional epidemiologic, molecular and genomic surveillance of clinical cases.
Main Text
Approximately 76% of Manaus’ inhabitants had been infected with SARS-CoV-2 eight months after the first reported case in March 2020 1. Nevertheless, a second epidemic wave occurred in the city, coinciding with the emergence of a new SARS-CoV-2 Variant of Concern (VOC) in November 2020 denoted P.1, corresponding to 87% of all infections in January 20212.
Mutations that are associated with immune escape and could increase the risk of reinfection have been postulated to explain the resurgence COVID-19 in Manaus 2,3. To address this question, we retrieved and tested serial samples from 3,655 repeat donors from Manaus. From these, we selected all unvaccinated donors with three or more donations, which included at least one during the first epidemic wave (before July 1st 2020) and at least one in January-March 2021, and excluded two donors that had their first positive donation in November or December 2020, when it is not possible to determine if the infection was caused by P.1, leading to 238 donors included in this study.
The samples were tested using a SARS-CoV-2 anti-N IgG chemiluminescence microparticle assay (CIMA, Abbott Park, IL, USA). The reactivity on this assay consistently wanes during convalescence 1 and we hypothesized that reinfection would induce a recrudescence (or “boosting”) of plasma anti-N IgG antibody levels, yielding a V-shaped time series of antibody reactivity levels. We partitioned the 238 repeat donors into six groups that reflect the inferred sequence of infection and reinfection with non-P.1 and P.1 variants (Figure 1). See Supplemental Appendix for a detailed description of the classification criteria.

Classification of the repeat blood donors according to their antibody profile using Abbott SARS-CoV-2 IgG CIMA. Blue and red dots represent respectively positive and negative results, and donations from the same donor are connected by a line.
The definitions of probable and possible reinfections depend on the parameters Tmax = 287 days and Δtmin = 87 days (see Supplemental Appendix for a description of how these parameters were estimated). A result is considered positive the signal-to-cutoff (S/C) is greater or equal to 0.49. To define the groups, we assume that all infections in 2021 are caused by P.1. The groups are defined as follows. A. Persistently seronegative – had no positive results; B. Infection by non-P.1 variant – had a positive result before Nov 1st 2020 and antibody levels in 2021 decaying with half-life lower than Tmax. C. Infection by P.1 – had no positive results in 2020 and a positive result in 2021. D. Reinfection by P.1 – had a positive result in 2021 and 2020 and an intermediate result with value below these two readings (V-shaped S/C time series), or three consecutive rising positive results, the last being in 2021. E. Probable reinfection by P.1 – had one positive result in 2020 and a higher positive result in 2021 separated by an interval of at least Δtmin. The last positive result of 2020 must have been followed by an S/C rise. F. Possible reinfection by P.1 – had one positive result in 2020 and a lower positive result in 2021 separated by an interval of at least Δtmin and decaying with half-life of at least Tmax
Of all the 59 presumed P.1 infections that were observed in 2021, we infer that 10 (16.9%, 95% CI [9.48%, 28.5%]) were reinfections. If probable reinfections are also included, these percentages increase to 25.8% (95% CI [16.7%, 37.4%]), or 31.0% (95% CI [21.4%, 42.5%]) if possible reinfections are included. These 10 P.1 reinfections also represent 9.5% (95% CI [5.3%, 16.6%]) of the 105 individuals that had a primary infection in the first wave, increasing to 15.2% (95% CI [9.7%, 23.0%]) and 18.8% (95% CI [12.8%, 26.8%]) if probable and possible reinfections are considered. On the other hand, previously negative individuals had a 40.5% (95% CI [32.2%, 49.4%]) chance of being infected by P.1. As such, previously infected individuals had a relative risk of infection by P.1 of 0.235 (95% CI [0.125, 0.429]) when compared to individuals with no previous antibody reactivity, increasing to 0.375 (95% CI [0.229, 0.601]) or 0.464 (95% CI [0.299, 0.709]), respectively, when probable and possible reinfections are considered.
The main limitation of this study is that donors were not sampled frequently enough to robustly detect cases of reinfection, leading to the possible existence of undetected cases of reinfection. We attempted to resolve this issue by classifying the degree of evidence and identifying probable and possible reinfections. Further, repeat negative donors may not represent truly unexposed individuals, since not all PCR+ individuals produce antibodies to nucleocapsid proteins and because sparse sampling may have resulted in missing the positive interval. Finally, blood donors are biased towards asymptomatic and mild infections; therefore, our rates of reinfection cannot be extrapolated to persons who had more severe primary infection.
Despite these caveats, our data suggest that reinfection due to P.1 is common and more frequent than has been detected by traditional epidemiologic, molecular and genomic surveillance of clinical cases 4,5. This is because few infected persons are tested by PCR in Brazil, thus PCR-positive patients have a small chance of having another positive PCR test, even if the reinfection rate is substantial. These results reinforce concerns over the risk of reinfection particularly as variants continue to evolve and demonstrate that repeat blood donor serosurveillance is valuable for documenting rates and correlates of reinfection.
Data Availability
Data can be shared upon request.
Supplementary Appendix
Materials and Methods
1. Definition of the groups of donors
We divided blood donors into 6 non-overlapping groups. Supplemental Figure 1 shows a flowchart describing the procedure used to classify donors, and Supplemental Figure 2 shows an illustration of a case of reinfection that falls into different groups depending on the sequence of dates of sample collection. From all repeat blood donors, we selected only donors with three or more donations because it is not possible to infer reinfection based on two time points. We also required donors to have one positive donation between March 1st, 2020 and June 30th, 2020, and one positive donation after January 1st, 2021. The objective of this requirement is to avoid selecting donors that had their first sample collected many months after the date of infection, since they may have already seroreverted when their first sample was collected.
To define the groups, we assume that all positive cases in 2021 are due to P.1 because of the high prevalence of P.1 in early January1. We excluded 31 vaccinated donors and two donors that had their first positive result in November and December 2020, when it was not possible to determine if the infection was caused by P.1 due to its low prevalence at that time, leading to 238 selected donors. With this exclusion, no infections observed in 2020 are due to P.1 because P.1 had an insignificant prevalence before November 20201. The definition of the groups also depends on two predefined parameters Δtmin and Tmax used to define the expected behavior of non-reinfected individuals. There parameters are estimated based on donations that occurred before the incidence of P.1 became significant (i.e., donations up to and including October 2020).
1.1. Defining the maximum half-life Tmax and the minimum interval between donations Δtmin
The definition of probable and possible reinfections depends on the maximum half-life of NC antibodies on the CIMA assay (Tmax) and the minimum interval between donations (Δtmin). Donors that tested positive in 2021 and whose S/C curve decayed with half-lives higher than all half-lives measured before November 2020 were treated as possible reinfections because they may have had unobserved (due to sparse sampling) V-shaped curves. The objective of defining Δtmin is to avoid misclassifying donors as reinfected when samples were collected during the seroconversion period – that is, we consider that Δtmin is much greater than the period of seroconversion. Before estimating these parameters, we added to all donors an artificial negative donation with CIMA result 0.01S/C in February 28, 2020, before the beginning of the epidemic in Manaus. This is because SARS-CoV-2 had not yet been introduced to the population, which was presumably completely immunologically naïve at that time.
Let N(Ti, Δti) be the number of donors that have at least one pair of successive positive results before November 2020 separated by an intervalΔt ≥ Δti and decaying with half-life T ≥ Ti. The function N(Ti, Δti) represents the number of possible reinfections observed in 2020. We first estimate Δtmin as the smallest Δti > 0 such that there exists a T ∈ [0,365] such that N(T, Δti)= 0. After estimating Δtmin, Tmax is assigned as the smallest Ti ∈ [0,365] such that N(Ti, Δtmin) = 0. Using this approach, we obtain Δtmin = 87 days and Tmax = 287 days. It is worth noting that even though the choice of the upper bound of 365 days for T is arbitrary, changing the values of Tmax and Δtmin does not substantially change the number of possible and probable reinfections because all cases of possible and probable reinfections have samples separated by a large interval, and all possible reinfections have very high half-lives in 2021. Furthermore, using the obtained value of Δtmin, no cases of possible reinfections are observed in 2020 if the constraint of having a positive donation in 2021 is removed from the definition of probable reinfection.
1.2. Rules used to define the six groups of donors
Given the values of Tmax and Δtmin, six groups of donors are defined as:
Persistently seronegative
Donors that never had a positive donation. It is not possible to say that all persistently seronegative donors were not infected, since some infected donors may have had already seroreverted at the date of sample collection, or not seroconverted at all.
Infection by non-P.1 variant
Two requirements are needed for a donor to be included in this group. First, the donor must have a positive donation before November 1st, 2020. Since donors that had their first positive result in November and December 2020 were excluded, this requirement is equivalent to requiring a positive donation in 2020 and a negative donation in 2021.
Donors must also fill one of the following rules:
All donations in 2021 are negative.
There are positive donations in 2021, but none of them have a rising result and at least one is decaying with half-life T < Tmax, that is, a half-life compatible with the half-lives observed before November 2020.
Infection by P.1
Donors that did not have any positive donation in 2020, but had a positive donation in 2021. Some of these cases may be unobserved reinfections by P.1 in the case of an undetected infection in 2020.
Reinfection by P.1
A donor is classified as a case of reinfection by P.1 if any of the following rules if fulfilled:
Donors with a positive donation in 2020 and another positive donation in 2021 with a V-shaped curve ending in 2021. In other words, these are donors that have a positive donation in 2020, a second donation with lower S/C value (that could be positive or negative), followed by a positive donation in 2021 with an increase in S/C value. These donors were seroreverting and then seroconverted again due to the reinfection.
Donors with three consecutive rising positive results, the last being in 2021. Since the minimum interval between successive donations is 60 days for men and 90 days for women in Brazil, donors with three consecutive rising positive results would apparently be seroconverting for more than 120 days > Δtmin, a possibility that we rule out due to the definition of Δtmin. Donors following this rule have likely had an unobserved S/C decay after the second rising result, but seroconverted again after being reinfected.
Probable reinfection by P.1
Donors with two consecutive rising positive results, the last being in 2021, separated by an interval Δt ≥ Δt min. We hypothesize that donors following this rule have had an unobserved antibody decline after the first positive sample, and then seroconverted again after being reinfected. A minimum interval between donations is required to avoid misclassifying donors sampled during the seroconversion period as probable reinfections.
Possible reinfection by P.1
Donors with two consecutive positive results, the last being in 2021, separated by an interval Δt ≥ Δtmin and decaying with half-life T ≥ Tmax. Donors following this rule may have had an S/C decay with half-life compatible to the half-lives observed in 2020, but may have had an S/C boosting due to reinfection, yielding an apparent half-life higher than Tmax. The constraint Δt ≥ Δtmin is important to avoid overestimating the half-life if the individual is still seroconverting after the first positive sample. Some donors following this rule may not be cases of reinfections, since donors with chronic infection may present a very slow antibody decay rate.
2. Assessing the measurement error of the SARS-Cov-2 anti-N IgG chemiluminescence microparticle assay
We define the CIMA test to be positive if the measured signal-to-cutoff (S/C ratio) is higher or equal to 0.49. This is the lowest value of range defined by the manufacturer (CIMA, Abbott Park, IL, USA) and provides a specificity of 97.6% (95% CI [96.3% - 98.5%]) based on 20 false-positives in 821 pre-pandemic blood donation samples in Manaus, and a peak sensitivity (prior to waning) of 91.7% (95% CI [87.0 – 94.4] based on 177 positive samples out of 193 PCR-positive symptomatic convalescent plasma donors tested 20-50 days following symptom onset2.
Even though the assay has high sensitivity and specificity, it produces results that are subject to measurement error, which results in variation in S/C that does not reflect a biological change, but is simply variation within the limit of precision of the test. If this variation is not small, sequential donations may have a V-shaped curve even if reinfection has not occurred, leading to an overestimation of the reinfection rate. To assess the amount of measurement error, we tested 200 samples in replicate from blood donors that donated in February 2021 in São Paulo.
Supplemental Figure 2 shows the measured S/C for the first and the second test of each sample. The absolute deviation of each pair of measured S/C had a median of 0.00 and a 95% confidence interval of [0.00, 0.09]. If only positive results were considered, the median deviation increases to 0.02% (95% CI [0.00, 0.16]), and the relative deviation obtained by dividing the absolute deviation by the first result has median 1.21% (95% CI [0.00%, 7.3%]) for positive results.
Therefore, the assay employed in this study yields results with a small amount of measurement error. For this reason, a sequence of serial samples is unlikely to be misclassified as a case of reinfection due to measurement noise.
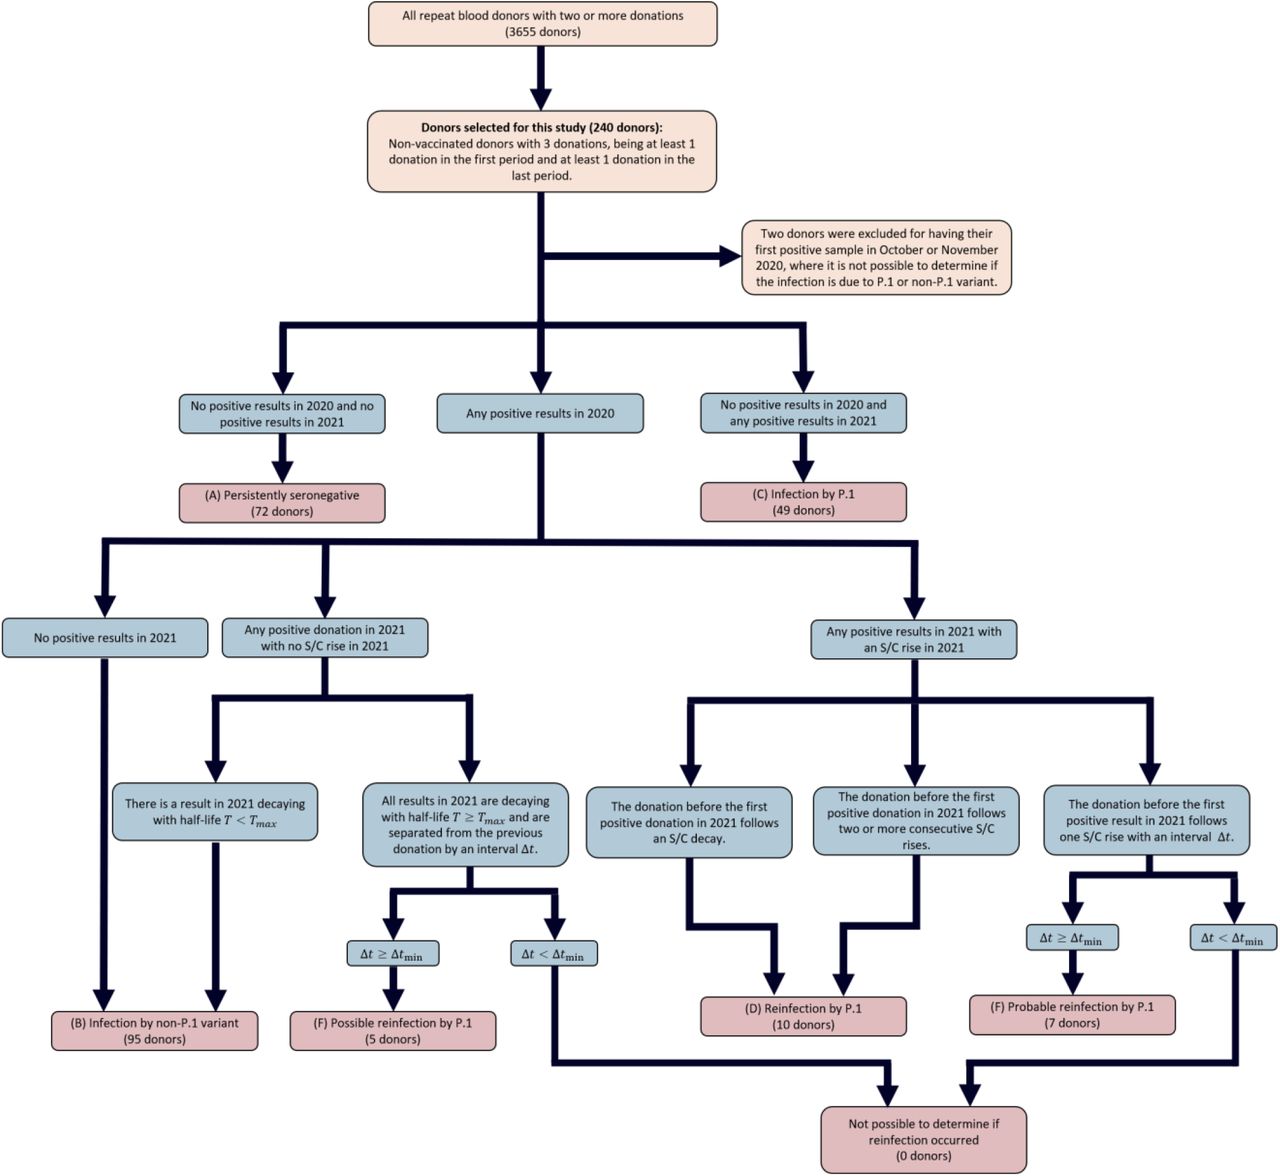
– Flowchart describing how repeat blood donors were classified into the groups shown in Figure 1. We used Δtmin = 87 days and Tmax = 287 days.

Illustration of a signal-to-cutoff (S/C) curve of a reinfected individual. Because sampling is sparse, this donor is classified differently depending on the sequence of dates of sample collection.
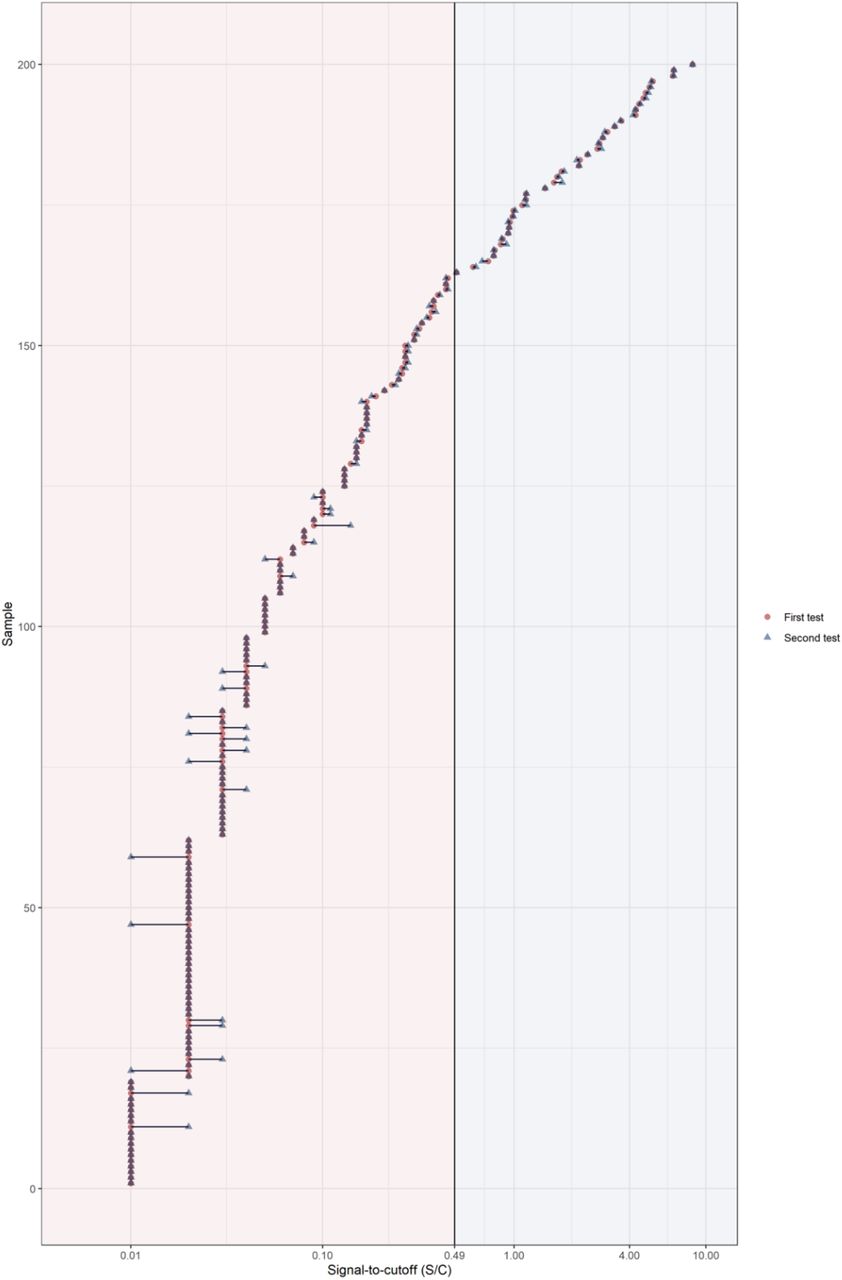
Validation of the noise level of the SARS-Cov-2 anti-N IgG chemiluminescence microparticle assay by testing 200 samples in replicate. Results corresponding to the same sample are connected by a horizontal line. The assay produces consistent results with very little variation.
Funding
This work was supported by the Itaú Unibanco “Todos pela Saúde” program and by a Medical Research Council-São Paulo Research Foundation (FAPESP) CADDE partnership award (MR/S0195/1 and FAPESP 18/14389-0) (caddecentre.org/). Wellcome Trust and Royal Society (N.R.F. Sir Henry Dale Fellowship: 204311/Z/16/Z); the National Heart, Lung, and Blood Institute Recipient Epidemiology and Donor Evaluation Study (REDS, now in its fourth phase, REDS-IV-P) for providing the blood donor demographic data for analysis (grant HHSN268201100007I). CAPJ was supported by FAPESP (2019/21858-0), Fundação Faculdade de Medicina and Coordenação de Aperfeiçoamento de Pessoal de Nível Superior – Brasil (CAPES) – Finance Code 001. VHN was supported by CNPq (304714/2018-6).


