Research article Special Issues

The within-host viral kinetics of SARS-CoV-2

  • In this work, we use a within-host viral dynamic model to describe the SARS-CoV-2 kinetics in the host. Chest radiograph score data are used to estimate the parameters of that model. Our result shows that the basic reproductive number of SARS-CoV-2 in host growth is around 3.79. Using the same method we also estimate the basic reproductive number of MERS virus is 8.16 which is higher than SARS-CoV-2. The PRCC method is used to analyze the sensitivities of model parameters. Moreover, the drug effects on virus growth and immunity effect of patients are also implemented to analyze the model.

    Citation: Chentong Li, Jinhu Xu, Jiawei Liu, Yicang Zhou. The within-host viral kinetics of SARS-CoV-2[J]. Mathematical Biosciences and Engineering, 2020, 17(4): 2853-2861. doi: 10.3934/mbe.2020159

    Related Papers:

    [1] A. D. Al Agha, A. M. Elaiw . Global dynamics of SARS-CoV-2/malaria model with antibody immune response. Mathematical Biosciences and Engineering, 2022, 19(8): 8380-8410. doi: 10.3934/mbe.2022390
    [2] A. M. Elaiw, Raghad S. Alsulami, A. D. Hobiny . Global dynamics of IAV/SARS-CoV-2 coinfection model with eclipse phase and antibody immunity. Mathematical Biosciences and Engineering, 2023, 20(2): 3873-3917. doi: 10.3934/mbe.2023182
    [3] Tahir Khan, Roman Ullah, Gul Zaman, Jehad Alzabut . A mathematical model for the dynamics of SARS-CoV-2 virus using the Caputo-Fabrizio operator. Mathematical Biosciences and Engineering, 2021, 18(5): 6095-6116. doi: 10.3934/mbe.2021305
    [4] Mohanad A. Deif, Ahmed A. A. Solyman, Mehrdad Ahmadi Kamarposhti, Shahab S. Band, Rania E. Hammam . A deep bidirectional recurrent neural network for identification of SARS-CoV-2 from viral genome sequences. Mathematical Biosciences and Engineering, 2021, 18(6): 8933-8950. doi: 10.3934/mbe.2021440
    [5] Junyuan Yang, Guoqiang Wang, Shuo Zhang . Impact of household quarantine on SARS-Cov-2 infection in mainland China: A mean-field modelling approach. Mathematical Biosciences and Engineering, 2020, 17(5): 4500-4512. doi: 10.3934/mbe.2020248
    [6] Wenhan Guo, Yixin Xie, Alan E Lopez-Hernandez, Shengjie Sun, Lin Li . Electrostatic features for nucleocapsid proteins of SARS-CoV and SARS-CoV-2. Mathematical Biosciences and Engineering, 2021, 18(3): 2372-2383. doi: 10.3934/mbe.2021120
    [7] Somayeh Fouladi, Mohammad Kohandel, Brydon Eastman . A comparison and calibration of integer and fractional-order models of COVID-19 with stratified public response. Mathematical Biosciences and Engineering, 2022, 19(12): 12792-12813. doi: 10.3934/mbe.2022597
    [8] Kaushik Dehingia, Anusmita Das, Evren Hincal, Kamyar Hosseini, Sayed M. El Din . Within-host delay differential model for SARS-CoV-2 kinetics with saturated antiviral responses. Mathematical Biosciences and Engineering, 2023, 20(11): 20025-20049. doi: 10.3934/mbe.2023887
    [9] Sumati Kumari Panda, Abdon Atangana, Juan J. Nieto . New insights on novel coronavirus 2019-nCoV/SARS-CoV-2 modelling in the aspect of fractional derivatives and fixed points. Mathematical Biosciences and Engineering, 2021, 18(6): 8683-8726. doi: 10.3934/mbe.2021430
    [10] David Moreno Martos, Benjamin J. Parcell, Raluca Eftimie . Modelling the transmission of infectious diseases inside hospital bays: implications for COVID-19. Mathematical Biosciences and Engineering, 2020, 17(6): 8084-8104. doi: 10.3934/mbe.2020410
  • In this work, we use a within-host viral dynamic model to describe the SARS-CoV-2 kinetics in the host. Chest radiograph score data are used to estimate the parameters of that model. Our result shows that the basic reproductive number of SARS-CoV-2 in host growth is around 3.79. Using the same method we also estimate the basic reproductive number of MERS virus is 8.16 which is higher than SARS-CoV-2. The PRCC method is used to analyze the sensitivities of model parameters. Moreover, the drug effects on virus growth and immunity effect of patients are also implemented to analyze the model.


    At the end of 2019, a new type of coronavirus, severe acute respiratory syndrome coronavirus 2 (SARS-CoV-2), began to threaten the people in China, especially in Hubei province. As of March 14, 2020, 81,026 individuals have been confirmed to be infected by this virus in China, including 3194 deaths. To mitigate the spread of the virus, the Chinese Government has progressively implemented metropolitan-wide quarantine in Wuhan and several nearby cities from Jan 23–24, 2020 [1]. The virus has also spread to several other countries, such as the Republic of Korea, Japan, Italy, and the USA. Around the world, many new deaths are reported every day. The government of many countries, such as Italy and Korea, introduce measures to control traffic flow, block cities, and establish temporary hospitals to slow down the transmission of the virus and treat the patients. Meanwhile, scientists all around the world are trying them best to find methods to analyze the structure of the virus protein[2], the viral phylodynamics[3], and develop the vaccine of that virus[4] to protect us.

    Computed tomography of chest (Chest CT) and chest radiograph are used to assess the severity of lung involvement in coronavirus disease 2019 (COVID-19)[5], which is the name of that new coronavirus caused disease [6]. Before Feb 13, the new cases in China were confirmed by nucleic acid testing. After that day, the diagnostic criterion has been improved, composed of not only the nucleic acid testing but also the CT test. The destructed pulmonary parenchyma and the resulting inflammation can be reflected from the chest radiograph [7]. Chest radiograph score method is a useful way to quantify the destruction of pulmonary parenchyma and in this study, our data set is based on this.

    Several works are [1,8] nowcasting and forecasting the number of confirmed cases of COVID-19. Meanwhile, some works [9,10] overview the characteristics, exposure history, and illness timelines of confirmed cases. All of these work focus on population dynamics of COVID-19, while, the works about the viral dynamics in host are rare. In this work, we use the within-host viral dynamic model [11,12] to describe the SARS-CoV-2 kinetics in host and the parameters of that model are estimated via the chest radiograph score. Moreover, using the CT score data of Middle East respiratory syndrome (MERS) that shown in Oh et al. [7], the paramters of MERS coronavirus are also estimated as a comparision group. All of the results are shown in the third section.

    We use the following ordinary differential equation model to simulate the coronavirus within-lung growth:

    {dEp(t)dt=dE(Ep(0)Ep(t))βEp(t)v(t),dEp(t)dt=βEp(t)v(t)dEEp(t),dv(t)dt=πvEp(t)dvv(t), (2.1)

    where Ep(t), Ep(t) and v(t) are the number of uninfected pulmonary epithelial cells, infected pulmonary epithelial cells and the virus. β is the infection rate of virus, πv is the virus production rate, Ep(0) is the number of uninfected epithelial cells without virus, and the term dEEp(0) assumes a constant regeneration of uninfected epithelial cells. dE, dE and dv are the death rate of uninfected pulmonary epithelial cells, infected pulmonary epithelial cells and the virus, respectively. The death rate of Ep(t) is the natural clearance rate of pulmonary epithelial cells, while, dE and dv are the combination of the natural clearance rate and elimination by the immunity system. This model was also used to describe the within-lung infection process of flu virus [12,13].

    By the definition of generation matrix of basic reproductive number R0 [14], the R0 of model (2.1) can be written as,

    R0=βπvEp(0)dEdv. (2.2)

    This number is an important value to measure whether the epidemic or species could die out or not [15]. In this study, the sensitivity analysis result of R0 is shown in the next section.

    In this study, the chest radiograph score data from serve patients (with high chest radiograph scores) are collected from the work of Pan et al. [5] and Oh et al. [7]. Our estimation is based on these two data sets. We consider the chest radiograph score as a way to reflect the infected pulmonary epithelial cells [5,7], which is also the target attacked by the immune cell [16]. Thus by the Poisson distribution, the likelihood that used to extimate parameters can be written as,

    L=i(Dilog(Ep(ti))Ep(ti)logΓ(Di+1)), (2.3)

    where Di is the smoothed chest radiograph score of the serve patient at time ti, Ep(ti) is the solution of Ep(t) at time ti, and logΓ(x) is log-gamma function, respectively. The prior distributions of the parameters of model (2.1) are based on the previous work [13,17]. Based on that likelihood, the Monte Carlo Markov Chain (MCMC) method, which is a commonly used method in paramter estimation, is used to estimate all of the parameters of model (2.1).

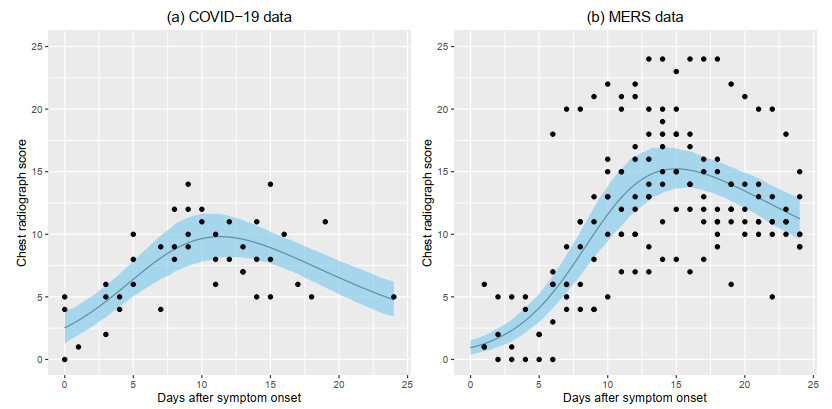
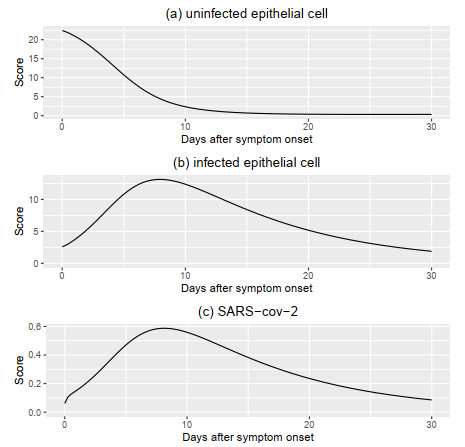
    Figure 1 shows the fitted result of our model. In that figure, the chain of solutions is calculated by the chain of parameters that generated in the MCMC method, and 95% Highest Posterior Density interval is computed by the hdi() function from R package 'HDInterval'. Table 1 summarizes the estimation results of the parameters and R0 of our model (2.1). We estimate that the death rate of these two virus are 5.36 (COVID-19) and 4.64 (MERS) per day, which is larger than the clearance rate of the virus on the outside surface [18]. This result shows the immune system can clear the virus directly. The estimation result also shows that the R0 of SARS-CoV-2 in serve patients is around the mean value 3.79 which is lower than that of MERS virus (8.16). These results illustrate that the immune system can not clear the virus effectively at the beginning time of symptom onset. By these estimated parameters of COVID-19, the solutions of model (2.1) are illustrated in Figure 2.

    Figure 1.  The chest radiograph score data and fitted result of (a) COVID-19, and (b) MERS. The dark line is the mean value of fitted result, while, the 95% Highest Posterior Density interval is shown in blue. The black points are the chest radiograph score data.
    Table 1.  Model parameters.
    Parameter Description (units) Mean value of COVID-19 (std) Mean value of MERS (std) Source
    Ep(t0) The value of uninfected epithelial cells when symptom onset(score) 25Ep(t0) 25Ep(t0) [5,7]
    Ep(t0) The value of infected epithelial cells when symptom onset (score) 2.59 (0.61) 0.89 (0.28) MCMC
    v(t0) The initial value of virus when symptom onset (score) 0.061 (0.0503) 0.0075 (0.0099) MCMC
    πv Virus production rate per infected epithelial cells (day1) 0.24 (0.22) 0.15 (0.16) MCMC
    β Infection rate of epithelial cells by virus (day1score1) 0.55 (0.55) 1.28 (1.37) MCMC
    dE Death rate of epithelial cells (day1) 103 103 [13]
    dE Death rate of infected epithelial cells (day1) 0.11 (0.01) 0.056 (0.0053) MCMC
    dv Death rate of virus (day1) 5.36 (6.42) 4.64 (0.89) MCMC
    R0 basic reproductive number 3.79 (0.54) 8.16 (1.13) MCMC
    a The t0 here is the symptom onset time.

     | Show Table
    DownLoad: CSV
    Figure 2.  The solutions of model (2.1) with the parameters of COVID-19 that shown in Table 1.

    The partial rank correlation coefficient (PRCC) method [19] is used to do the sensitivity analysis of R0. The result (Table 2) shows that the parameters Ep(0), β, πv, dE, and dv have almost the same level of influence on R0. Parameters dE, and dv have negative correlations with R0, while Ep(0), β, πv have positive correlations. The positive correlation of Ep(0) with R0 may give a explanation on why the babys, who have small amount of pulmonary epithelial cells, are not likely to get infected and have lower mortality (see [10], Table 1).

    Table 2.  Sensitivity of R0 with respect to Ep(0), β, πv, dE, and dv.
    Parameter Range PRCC 95% CI
    Ep(0) (20,30) 0.9132 (0.913,0.9134)
    β (0.44,0.66) 0.9132 (0.913,0.9134)
    πv (0.192,0.288) 0.9132 (0.9129,0.9134)
    dE (0.088,0.132) 0.9132 (0.9134,0.9129)
    dv (4.288,6.432) 0.9132 (0.9134,0.9129)

     | Show Table
    DownLoad: CSV

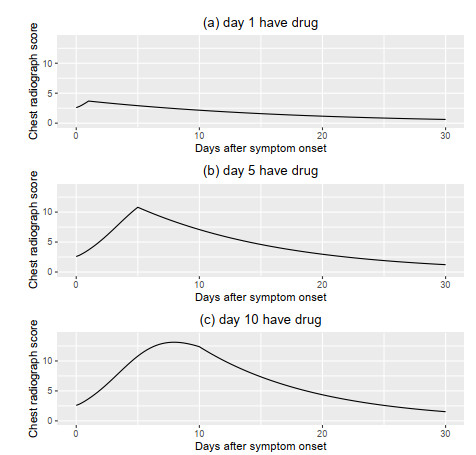
    Drug therapy is also a topic discussed widely on viral dynamics [11]. For the coronavirus there are some drugs that may have a positive influence on decreasing the virus load [20]. The simulation about the drug effect are shown in Figure 3. In this simulation, we take the value of parameters that shown in Table 1 as the baseline parameters, and assume the drug can drop the infection rate β to 0.1β. These results show that the earlier to give an effective drug to a serve patient, the better to relieve symptoms.

    Figure 3.  The simulated result of chest radiograph score of patients with COVID-19 and the beginning time of having drug is (a) the first day, (b) the fifth day, and (c) the tenth day after symptom onset. In this simulation, the drug effect is assumed to decrease the infection rate β to 0.1β.

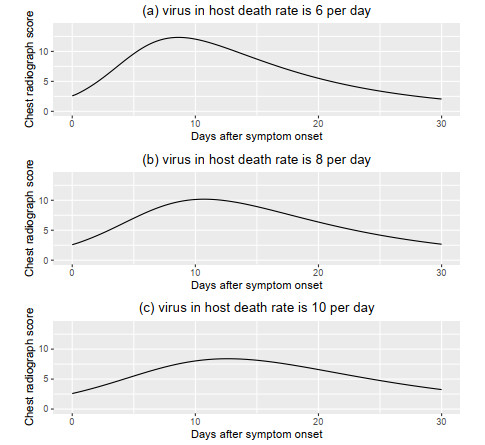
    When the symptom is onset, the immunity system already have worked to clear the virus [16]. But, the patients are at different ages and their immune capacities are different. In Figure 4, the simulation results show that the virus with a higher death rate can relieve the symptom of patients, Patients have a stronger immune system, can clear the virus better, and have milder symptoms. This result may explain why the young are easy to recover from this disease (see [10]).

    Figure 4.  The simulated result of chest radiograph score of patients with COVID-19 and death rate of virus is (a) 6 per day, (b) 8 per day and (c) 10 per day.

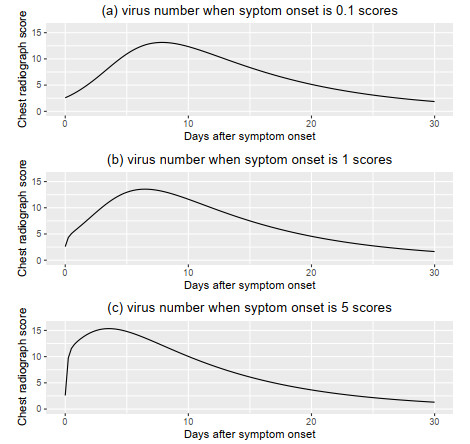
    In Figure 5, the simulation results show that with a higher initial value of the virus, the symptom of patients is more severe. This means the individuals who have more possible to exposure to the virus (such as the doctors fighting with COVID-19 and the workers treating the medical waste of COVID-19 patients) should much more take care of themselves.

    Figure 5.  The simulated result of chest radiograph score of patients with COVID-19 and the number of virus when symptom onset is (a) 0.1 scores, (b) 1 scores and (c) 5 scores.

    Based on the chest radiograph data, we estimate the parameters and basic reproductive number of the model (2.1). The R0 of SARS-CoV-2 in host growth is 3.79, which is higher than hepatitis C virus (mean value as 2.26, [21]), but lower than the flu virus (mean value as 23, [17]). Comparing the estimated parameters of SARS-CoV-2 with MERS coronavirus, the MERS have a higher virulence to infect the pulmonary epithelial cells (larger R0) and with a small value of infected cell when symptom onset. These may esplain why the MERS have a higher mortality and smaller incubation period [7,9]. By the PRCC method, the sensitivity analysis is also done on the R0, and the positive correlation of Ep(0) with R0 may give a possible reason why the baby patients are less likely to die of this virus.

    In this manuscript, three simulations about our model are done to study how the different factors can influence the symptoms of patients. These results illustrate that (1) early medication is effective for treatment, (2) patients with strong immunity have fewer symptoms, and (3) people who are often exposed to the virus are more likely to become severe.

    The methods we used in this study are following the previous works by Miao et al. [12,17]. This is the first time for this methodology to be used in the COVID-19 and our work shows some new results of the within-host properties of this virus. All of the source codes are available at the GitHub (https://github.com/ChentongLi/SARS-CoV-2_viral_kinetic). Anyone could use these codes to estimate and forecast the chest radiograph score of the patients.

    The major limitation of this study is that the chest radiograph score is not the real data of the infected pulmonary epithelial cells but just an approximation. Moreover, we assume that the immunne effect on viruses and infected epithelial cells are constant values. This is because the data of antibody and effective CD8 cells of that virus are rarely known. If we could get more accurate data, the results will be much better.

    We believe this study could give some help to the diagnosis and treatment of the COVID-19. For other disease that infect the lung, this method we believe also could be used to do analysis.

    This work is supported by National Natural Science Foundation of China (11701445), Natural Science Basic Research Plan in Shaanxi Province of China (2018JQ1057), and Young Talent Fund of University Association for Science and Technology in Shaanxi, China (20180504).

    The authors declare there is no conflict of interest.


    [1] J. T. Wu, K. Leung, G. M. Leung, Nowcasting and forecasting the potential domestic and international spread of the 2019-ncov outbreak originating in wuhan, china: a modelling study, Lancet, 2020.
    [2] S. F. Ahmed, A. A. Quadeer, M. R. McKay, Preliminary identification of potential vaccine targets for the covid-19 coronavirus (sars-cov-2) based on sars-cov immunological studies, Viruses, 12 (2020), 254. doi: 10.3390/v12030254
    [3] H. W. Elsland, Y. Wang, Report 5: Phylogenetic analysis of sars-cov-2.
    [4] W. Shang, Y. Yang, Y. Rao, X. Rao, The outbreak of sars-cov-2 pneumonia calls for viral vaccines, npj Vaccines, 5 (2020), 1-3. doi: 10.1038/s41541-019-0151-3
    [5] F. Pan, T. Ye, P. Sun, S. Gui, B. Liang, L. Li, et al., Time course of lung changes on chest ct during recovery from 2019 novel coronavirus (covid-19) pneumonia, Radiology, (2020), 200370.
    [6] WHO, Coronavirus disease (covid-19) outbreak, 2020. Available from: https://www.who.int/emergencies/diseases/novel-coronavirus-2019.
    [7] M. Oh, W. B. Park, P. G. Choe, S. Choi, J. Kim, J. Chae, et al., Viral load kinetics of mers coronavirus infection, N. Engl. J. Med., 375 (2016), 1303-1305. doi: 10.1056/NEJMc1511695
    [8] T. Liu, J. Hu, M. Kang, L. Lin, H. Zhong, J. Xiao, et al., Transmission dynamics of 2019 novel coronavirus (2019-ncov), 2020.
    [9] Q. Li, X. Guan, P. Wu, X. Wang, L. Zhou, Y. Tong, et al., Early transmission dynamics in wuhan, china, of novel coronavirus-infected pneumonia, N. Engl. J. Med., 2020.
    [10] The Novel Coronavirus Pneumonia Emergency Response Epidemiology Team, The epidemiological characteristics of an outbreak of 2019 novel coronavirus diseases (covid-19) in china, Chin. J. Epidemiol., 41 (2020), 145-151.
    [11] S. Bonhoeffer, R. M. May, G. M. Shaw, M. A. Nowak, Virus dynamics and drug therapy, Proc. Natl. Acad. Sci. USA, 94 (1997), 6971-6976. doi: 10.1073/pnas.94.13.6971
    [12] H. Miao, X. Xia, A. S. Perelson, H. Wu, On identifiability of nonlinear ode models and applications in viral dynamics, SIAM Rev., 53 (2011), 3-39. doi: 10.1137/090757009
    [13] H. Y. Lee, D. J. Topham, S. Y. Park, J. Hollenbaugh, J. Treanor, T. R Mosmann, et al., Simulation and prediction of the adaptive immune response to influenza a virus infection, J. Virol., 83 (2009), 7151-7165. doi: 10.1128/JVI.00098-09
    [14] O. Dieckmann, J. P. Heesterbeek, Mathematical epidemiology of infectious diseases, 2000.
    [15] W. Wang, X. Zhao, Threshold dynamics for compartmental epidemic models in periodic environments, J. Dyn. Differ. Equ., 20 (2008), 699-717. doi: 10.1007/s10884-008-9111-8
    [16] NCBI, The innate and adaptive immune systems, 2010. Available from: https://www.ncbi.nlm.nih.gov/books/NBK279396/#_i2255_theadaptiveimmunesys_.
    [17] H. Miao, J. A. Hollenbaugh, M. S. Zand, J. Holden-Wiltse, T. R. Mosmann, A. S. Perelson, et al., Quantifying the early immune response and adaptive immune response kinetics in mice infected with influenza a virus, J. Virol., 84 (2010), 6687-6698. doi: 10.1128/JVI.00266-10
    [18] G. Kampf, D. Todt, S. Pfaender, E. Steinmann, Persistence of coronaviruses on inanimate surfaces and its inactivation with biocidal agents, J. Hosp. Infect., 2020.
    [19] S. Marino, I. B. Hogue, C. J. Ray, D. E. Kirschner, A methodology for performing global uncertainty and sensitivity analysis in systems biology, J. Theor. Biol., 254 (2008), 178-196. doi: 10.1016/j.jtbi.2008.04.011
    [20] H. Lu, Drug treatment options for the 2019-new coronavirus (2019-ncov), BioSci. Trends, 14 (2020), 69-71. doi: 10.5582/bst.2020.01020
    [21] S. DebRoy, B. M. Bolker, M. Martcheva, Bistability and long-term cure in a within-host model of hepatitis c, J. Biol. Syst., 19 (2011), 533-550. doi: 10.1142/S0218339011004135
  • This article has been cited by:

    1. Alexis Erich S. Almocera, Griselda Quiroz, Esteban A. Hernandez-Vargas, Stability analysis in COVID-19 within-host model with immune response, 2021, 95, 10075704, 105584, 10.1016/j.cnsns.2020.105584
    2. Charlotte Kern, Verena Schöning, Carlos Chaccour, Felix Hammann, Modeling of SARS-CoV-2 Treatment Effects for Informed Drug Repurposing, 2021, 12, 1663-9812, 10.3389/fphar.2021.625678
    3. Woochang Hwang, Winnie Lei, Nicholas M Katritsis, Méabh MacMahon, Kathryn Chapman, Namshik Han, Current and prospective computational approaches and challenges for developing COVID-19 vaccines, 2021, 172, 0169409X, 249, 10.1016/j.addr.2021.02.004
    4. Chunxiang Ma, Hu Zhang, COVID-19, a far cry from the influenza, 2020, 3, 2096-5303, 100, 10.1093/pcmedi/pbaa015
    5. Bhagya Jyoti Nath, Kaushik Dehingia, Vishnu Narayan Mishra, Yu-Ming Chu, Hemanta Kumar Sarmah, Mathematical analysis of a within-host model of SARS-CoV-2, 2021, 2021, 1687-1847, 10.1186/s13662-021-03276-1
    6. Yamin Ding, Yuxuan Fu, Yanmei Kang, Stochastic analysis of COVID-19 by a SEIR model with Lévy noise, 2021, 31, 1054-1500, 043132, 10.1063/5.0021108
    7. Ihtisham Ul Haq, Mehmet Yavuz, Nigar Ali, Ali Akgül, A SARS-CoV-2 Fractional-Order Mathematical Model via the Modified Euler Method, 2022, 27, 2297-8747, 82, 10.3390/mca27050082
    8. A. M. Elaiw, A. D. Al Agha, M. A. Alshaikh, Global stability of a within-host SARS-CoV-2/cancer model with immunity and diffusion, 2022, 15, 1793-5245, 10.1142/S1793524521500935
    9. Eugenia Ch. Yiannakopoulou, 2023, 9780323917940, 291, 10.1016/B978-0-323-91794-0.00012-3
    10. Kaushik Dehingia, Ahmed A. Mohsen, Sana Abdulkream Alharbi, Reima Daher Alsemiry, Shahram Rezapour, Dynamical Behavior of a Fractional Order Model for Within-Host SARS-CoV-2, 2022, 10, 2227-7390, 2344, 10.3390/math10132344
    11. A. M. Elaiw, A. S. Shflot, A. D. Hobiny, Stability analysis of SARS-CoV-2/HTLV-I coinfection dynamics model, 2022, 8, 2473-6988, 6136, 10.3934/math.2023310
    12. Ahmed M. Elaiw, Afnan D. Al Agha, Analysis of the In-Host Dynamics of Tuberculosis and SARS-CoV-2 Coinfection, 2023, 11, 2227-7390, 1104, 10.3390/math11051104
    13. Ahmed. M. Elaiw, Abdullah J. Alsaedi, Aatef. D. Hobiny, Shaban. A. Aly, Global Properties of a Diffusive SARS-CoV-2 Infection Model with Antibody and Cytotoxic T-Lymphocyte Immune Responses, 2022, 11, 2227-7390, 190, 10.3390/math11010190
    14. Ahmed M. Elaiw, Abdullah J. Alsaedi, Afnan Diyab Al Agha, Aatef D. Hobiny, Global Stability of a Humoral Immunity COVID-19 Model with Logistic Growth and Delays, 2022, 10, 2227-7390, 1857, 10.3390/math10111857
    15. Lisette dePillis, Rebecca Caffrey, Ge Chen, Mark D. Dela, Leif Eldevik, Joseph McConnell, Shahrokh Shabahang, Stephen A. Varvel, A mathematical model of the within-host kinetics of SARS-CoV-2 neutralizing antibodies following COVID-19 vaccination, 2023, 556, 00225193, 111280, 10.1016/j.jtbi.2022.111280
    16. Indrajit Ghosh, Within Host Dynamics of SARS-CoV-2 in Humans: Modeling Immune Responses and Antiviral Treatments, 2021, 2, 2662-995X, 10.1007/s42979-021-00919-8
    17. Ahmed M. Elaiw, Raghad S. Alsulami, Aatef D. Hobiny, Modeling and Stability Analysis of Within-Host IAV/SARS-CoV-2 Coinfection with Antibody Immunity, 2022, 10, 2227-7390, 4382, 10.3390/math10224382
    18. A.M. Elaiw, A.D. Al Agha, Global dynamics of SARS-CoV-2/cancer model with immune responses, 2021, 408, 00963003, 126364, 10.1016/j.amc.2021.126364
    19. Verena Schöning, Charlotte Kern, Carlos Chaccour, Felix Hammann, Effectiveness of Antiviral Therapy in Highly-Transmissible Variants of SARS-CoV-2: A Modeling and Simulation Study, 2022, 13, 1663-9812, 10.3389/fphar.2022.816429
    20. Dmitry Grebennikov, Ekaterina Kholodareva, Igor Sazonov, Antonina Karsonova, Andreas Meyerhans, Gennady Bocharov, Intracellular Life Cycle Kinetics of SARS-CoV-2 Predicted Using Mathematical Modelling, 2021, 13, 1999-4915, 1735, 10.3390/v13091735
    21. A. D. Al Agha, A. M. Elaiw, Global dynamics of SARS-CoV-2/malaria model with antibody immune response, 2022, 19, 1551-0018, 8380, 10.3934/mbe.2022390
    22. Ahmed M. Elaiw, Raghad S. Alsulami, Aatef D. Hobiny, Dynamic Behaviors of a COVID-19 and Influenza Co-Infection Model with Time Delays and Humoral Immunity, 2023, 12, 2075-1680, 151, 10.3390/axioms12020151
    23. Saswati Pal, Nabiul Islam, Sudip Misra, VIVID: In Vivo End-to-End Molecular Communication Model for COVID-19, 2021, 7, 2372-2061, 142, 10.1109/TMBMC.2021.3071767
    24. Ahmed M. Elaiw, Abdulsalam S. Shflot, Aatef D. Hobiny, Global Stability of Delayed SARS-CoV-2 and HTLV-I Coinfection Models within a Host, 2022, 10, 2227-7390, 4756, 10.3390/math10244756
    25. Behzad Ghanbari, On fractional approaches to the dynamics of a SARS-CoV-2 infection model including singular and non-singular kernels, 2021, 28, 22113797, 104600, 10.1016/j.rinp.2021.104600
    26. Afnan D. Al Agha, Ahmed M. Elaiw, Shaimaa A. Azoz, Esraa Ramadan, Stability analysis of within‐host SARS‐CoV‐2/HIV coinfection model, 2022, 45, 0170-4214, 11403, 10.1002/mma.8457
    27. Ahmed M. Elaiw, Abdulsalam S. Shflot, Aatef D. Hobiny, Shaban A. Aly, Global Dynamics of an HTLV-I and SARS-CoV-2 Co-Infection Model with Diffusion, 2023, 11, 2227-7390, 688, 10.3390/math11030688
    28. S. M. E. K. Chowdhury, J. T. Chowdhury, Shams Forruque Ahmed, Praveen Agarwal, Irfan Anjum Badruddin, Sarfaraz Kamangar, Mathematical modelling of COVID-19 disease dynamics: Interaction between immune system and SARS-CoV-2 within host, 2022, 7, 2473-6988, 2618, 10.3934/math.2022147
    29. Andrew Omame, Mujahid Abbas, Modeling SARS-CoV-2 and HBV co-dynamics with optimal control, 2023, 615, 03784371, 128607, 10.1016/j.physa.2023.128607
    30. Ahmed M. Elaiw, Afnan D. Al Agha, Global Stability of a Reaction–Diffusion Malaria/COVID-19 Coinfection Dynamics Model, 2022, 10, 2227-7390, 4390, 10.3390/math10224390
    31. A.M. Elaiw, A.J. Alsaedi, A.D. Hobiny, S. Aly, Stability of a delayed SARS-CoV-2 reactivation model with logistic growth and adaptive immune response, 2023, 616, 03784371, 128604, 10.1016/j.physa.2023.128604
    32. Afnan Al Agha, Safiya Alshehaiween, Ahmed Elaiw, Matuka Alshaikh, A Global Analysis of Delayed SARS-CoV-2/Cancer Model with Immune Response, 2021, 9, 2227-7390, 1283, 10.3390/math9111283
    33. S. A. Azoz, A. M. Elaiw, E. Ramadan, A. D. Al Agha, Aeshah A. Raezah, Chang Phang, Global Dynamics of a Within-Host COVID-19/AIDS Coinfection Model with Distributed Delays, 2022, 2022, 2314-4785, 1, 10.1155/2022/9129187
    34. A.M. Elaiw, A.J. Alsaedi, A.D. Hobiny, Global stability of a delayed SARS-CoV-2 reactivation model with logistic growth, antibody immunity and general incidence rate, 2022, 61, 11100168, 12475, 10.1016/j.aej.2022.05.034
    35. A. M. Elaiw, A. D. Al Agha, S. A. Azoz, E. Ramadan, Global analysis of within-host SARS-CoV-2/HIV coinfection model with latency, 2022, 137, 2190-5444, 10.1140/epjp/s13360-022-02387-2
    36. Tuersunjiang Keyoumu, Ke Guo, Wanbiao Ma, Periodic oscillation for a class of in-host MERS-CoV infection model with CTL immune response, 2022, 19, 1551-0018, 12247, 10.3934/mbe.2022570
    37. A. Sa’adah, D. A. Kamil, G. E. Setyowisnu, 2022, 2501, 0094-243X, 020004, 10.1063/5.0091002
    38. Antoine Danchin, Oriane Pagani-Azizi, Gabriel Turinici, Ghozlane Yahiaoui, COVID-19 Adaptive Humoral Immunity Models: Weakly Neutralizing Versus Antibody-Disease Enhancement Scenarios, 2022, 70, 0001-5342, 10.1007/s10441-022-09447-1
    39. Douglas Raymond Beahm, Yijie Deng, Thomas M. DeAngelo, Rahul Sarpeshkar, Drug Cocktail Formulation via Circuit Design, 2023, 9, 2372-2061, 28, 10.1109/TMBMC.2023.3246928
    40. Ali Algarni, Afnan D. Al Agha, Aisha Fayomi, Hakim Al Garalleh, Kinetics of a Reaction-Diffusion Mtb/SARS-CoV-2 Coinfection Model with Immunity, 2023, 11, 2227-7390, 1715, 10.3390/math11071715
    41. M.A. Alshaikh, A.K. Aljahdali, Stability of a discrete HTLV-1/SARS-CoV-2 dual infection model, 2024, 10, 24058440, e28178, 10.1016/j.heliyon.2024.e28178
    42. Allison M. Claas, Meelim Lee, Pai‐Hsi Huang, Charles G. Knutson, Domenico Bullara, Birgit Schoeberl, Suzanne Gaudet, Viral Kinetics Model of SARS‐CoV‐2 Infection Informs Drug Discovery, Clinical Dose, and Regimen Selection, 2024, 116, 0009-9236, 757, 10.1002/cpt.3267
    43. Junyuan Yang, Sijin Wu, Xuezhi Li, Xiaoyan Wang, Xue-Song Zhang, Lu Hou, Parameter identifiability of a within-host SARS-CoV-2 epidemic model, 2024, 9, 24680427, 975, 10.1016/j.idm.2024.05.004
    44. Matthew O. Adewole, Taye Samuel Faniran, Farah A. Abdullah, Majid K.M. Ali, COVID-19 dynamics and immune response: Linking within-host and between-host dynamics, 2023, 173, 09600779, 113722, 10.1016/j.chaos.2023.113722
    45. R. Viriyapong, P. Inkhao, Severe acute respiratory syndrome-coronavirus-2 (SARS-COV-2) infection of pneumocytes with vaccination and drug therapy: Mathematical analysis and optimal control, 2024, 17, 1793-5245, 10.1142/S1793524523500213
    46. Afnan Al Agha, Hakim Al Garalleh, Oncolysis by SARS-CoV-2: modeling and analysis, 2024, 9, 2473-6988, 7212, 10.3934/math.2024351
    47. Meng Wang, Yafei Zhao, Chen Zhang, Jie Lou, THE WITHIN-HOST VIRAL KINETICS OF SARS-COV-2, 2023, 13, 2156-907X, 2121, 10.11948/20220389
    48. Ahmed M. Elaiw, Amani S. Alsulami, Aatef D. Hobiny, Global properties of delayed models for SARS-CoV-2 infection mediated by ACE2 receptor with humoral immunity, 2024, 9, 2473-6988, 1046, 10.3934/math.2024052
    49. Ahmed M. Elaiw, Raghad S. Alsulami, Aatef D. Hobiny, Global properties of SARS‐CoV‐2 and IAV coinfection model with distributed‐time delays and humoral immunity, 2024, 47, 0170-4214, 9340, 10.1002/mma.10074
    50. Tin Phan, Carolin Zitzmann, Kara W. Chew, Davey M. Smith, Eric S. Daar, David A. Wohl, Joseph J. Eron, Judith S. Currier, Michael D. Hughes, Manish C. Choudhary, Rinki Deo, Jonathan Z. Li, Ruy M. Ribeiro, Ruian Ke, Alan S. Perelson, Shuo Su, Modeling the emergence of viral resistance for SARS-CoV-2 during treatment with an anti-spike monoclonal antibody, 2024, 20, 1553-7374, e1011680, 10.1371/journal.ppat.1011680
    51. S. Sankaranarayanan, An approach to statistical analysis-using the average transmission model of Covid 19, 2020, 8, 23193786, 2158, 10.26637/MJM0804/0141
    52. Matthew O. Adewole, Farah A. Abdullah, Majid K. M. Ali, 2024, 3203, 0094-243X, 030007, 10.1063/5.0225272
    53. Kaushik Dehingia, Anusmita Das, Evren Hincal, Kamyar Hosseini, Sayed M. El Din, Within-host delay differential model for SARS-CoV-2 kinetics with saturated antiviral responses, 2023, 20, 1551-0018, 20025, 10.3934/mbe.2023887
    54. QING LAN, HUI WU, JIE LOU, JIANQUAN LI, MATHEMATICAL MODELING OF INFECTION MECHANISM BETWEEN MILD AND SEVERE COVID-19 PATIENTS, 2023, 31, 0218-3390, 963, 10.1142/S021833902350033X
    55. Nitesh Kumawat, Mubasher Rashid, Akriti Srivastava, Jai Prakash Tripathi, Hysteresis and Hopf bifurcation: Deciphering the dynamics of an in-host model of SARS-CoV-2 with logistic target cell growth and sigmoidal immune response, 2023, 176, 09600779, 114151, 10.1016/j.chaos.2023.114151
    56. Qigui Yang, Jiabing Huang, A STOCHASTIC MULTI-SCALE COVID-19 MODEL WITH INTERVAL PARAMETERS, 2024, 14, 2156-907X, 515, 10.11948/20230298
    57. Ibrahim Nali, Attila Dénes, Global Dynamics of a Within-Host Model for Usutu Virus, 2023, 11, 2079-3197, 226, 10.3390/computation11110226
    58. Afnan D. Al Agha, Analysis of a reaction-diffusion oncolytic SARS-CoV-2 model, 2024, 10, 2363-6203, 4641, 10.1007/s40808-024-02009-z
    59. Yafei Zhao, Hui Wu, Hua Cheng, Jie Lou, Model selection and identifiability analysis of HIV and SARS-CoV-2 co-infection model with drug therapy, 2023, 126, 10075704, 107501, 10.1016/j.cnsns.2023.107501
    60. Yuhao Shou, Jie Lou, STUDIES ON THE INTERACTION MECHANISM BETWEEN THE MRNA VACCINE AGAINST SARS-COV-2 AND THE IMMUNE SYSTEM, 2024, 14, 2156-907X, 2283, 10.11948/20230365
    61. Ali Ayadi, Claudia Frydman, Quy Thanh Le, 2023, Modeling and Simulation of the SARS-COV-2 Lung Infection and Immune Response with Cell-DEVS, 979-8-3503-6966-3, 1196, 10.1109/WSC60868.2023.10407137
  • Reader Comments
  • © 2020 the Author(s), licensee AIMS Press. This is an open access article distributed under the terms of the Creative Commons Attribution License (http://creativecommons.org/licenses/by/4.0)
通讯作者: 陈斌, bchen63@163.com
  • 1. 

    沈阳化工大学材料科学与工程学院 沈阳 110142

  1. 本站搜索
  2. 百度学术搜索
  3. 万方数据库搜索
  4. CNKI搜索

Metrics

Article views(6784) PDF downloads(865) Cited by(61)

Figures and Tables

Figures(5)  /  Tables(2)

Other Articles By Authors

/

DownLoad:  Full-Size Img  PowerPoint
Return
Return

Catalog