The Proportion of Anemia Associated with Iron Deficiency in Low, Medium, and High Human Development Index Countries: A Systematic Analysis of National Surveys

 ,
,
Abstract
:1. Introduction
2. Materials and Methods
2.1. Search Strategy
2.2. Inclusion and Exclusion Criteria
2.3. Estimating ID and IDA in Presence of Inflammation
2.4. Grouping Countries by Inflammation Exposure
2.5. Data Synthesis
3. Results
3.1. Literature Research
3.2. Country Inflammation Exposure Categorization
3.3. Study Characteristics
3.4. Prevalence of Anemia, IDA, and ID among PSC
3.5. Prevalence of Anemia, IDA, and ID among WRA
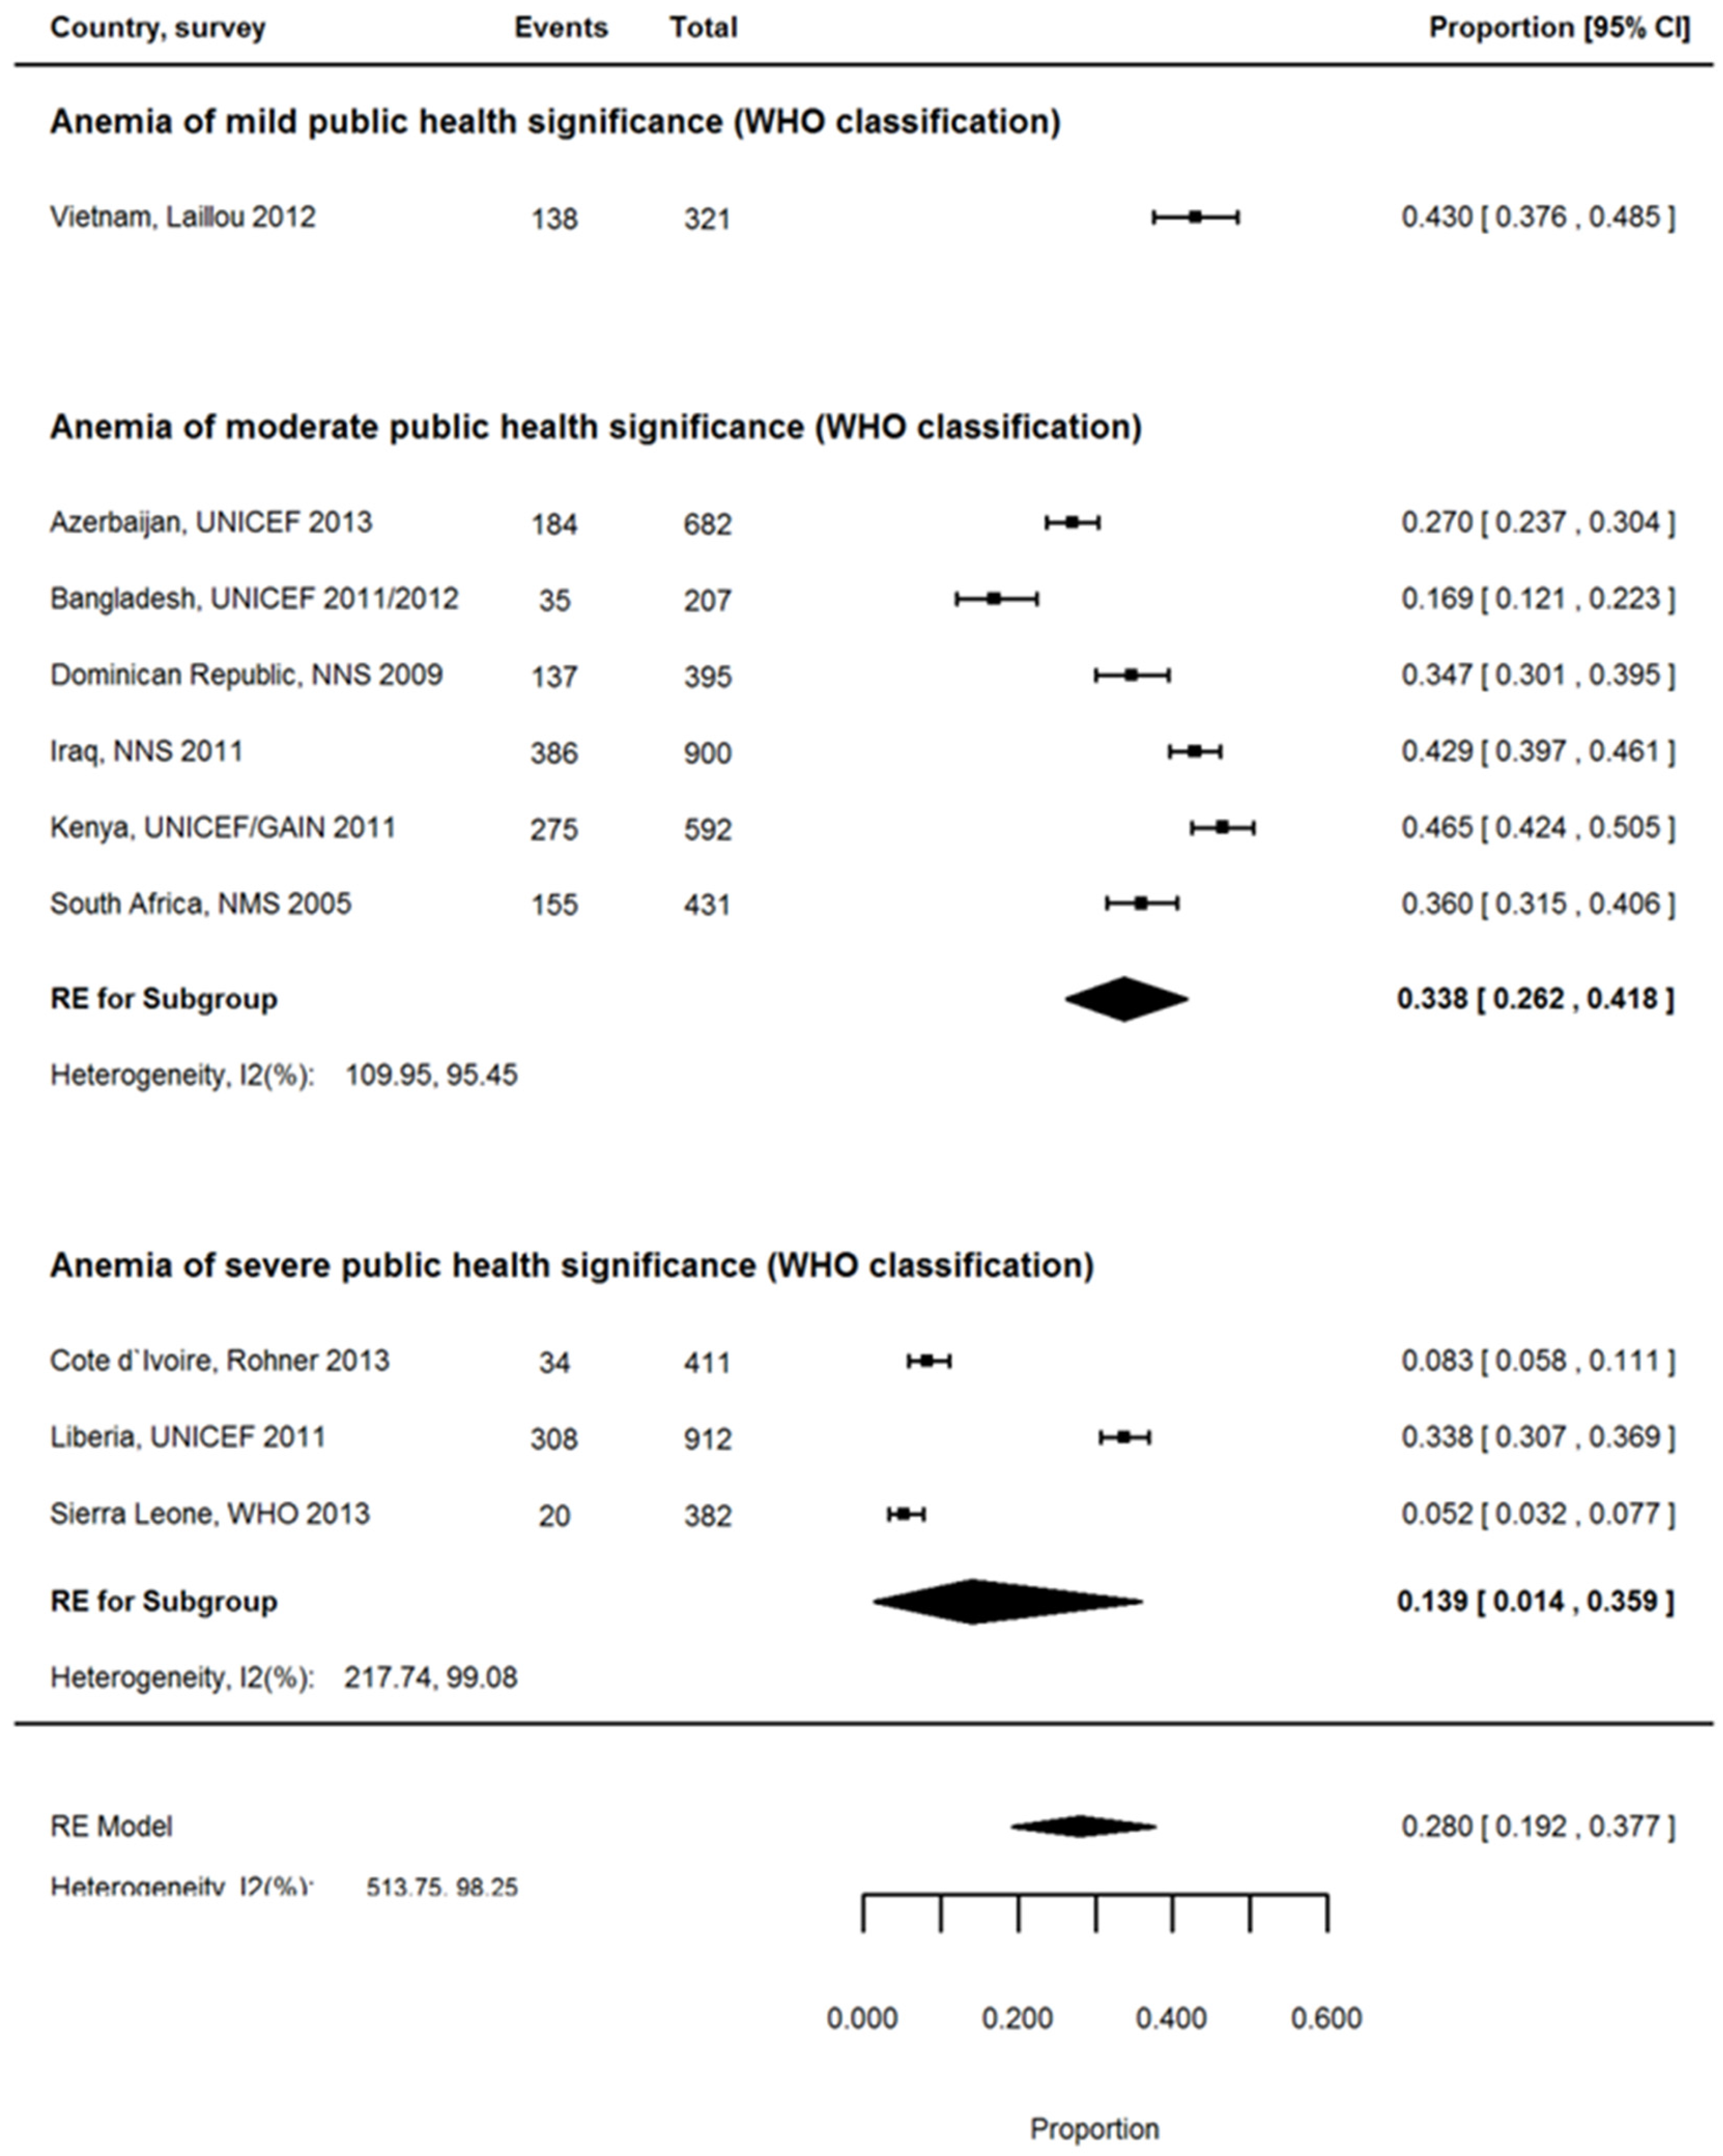
3.6. Proportion of Anemia Associated with ID among PSC
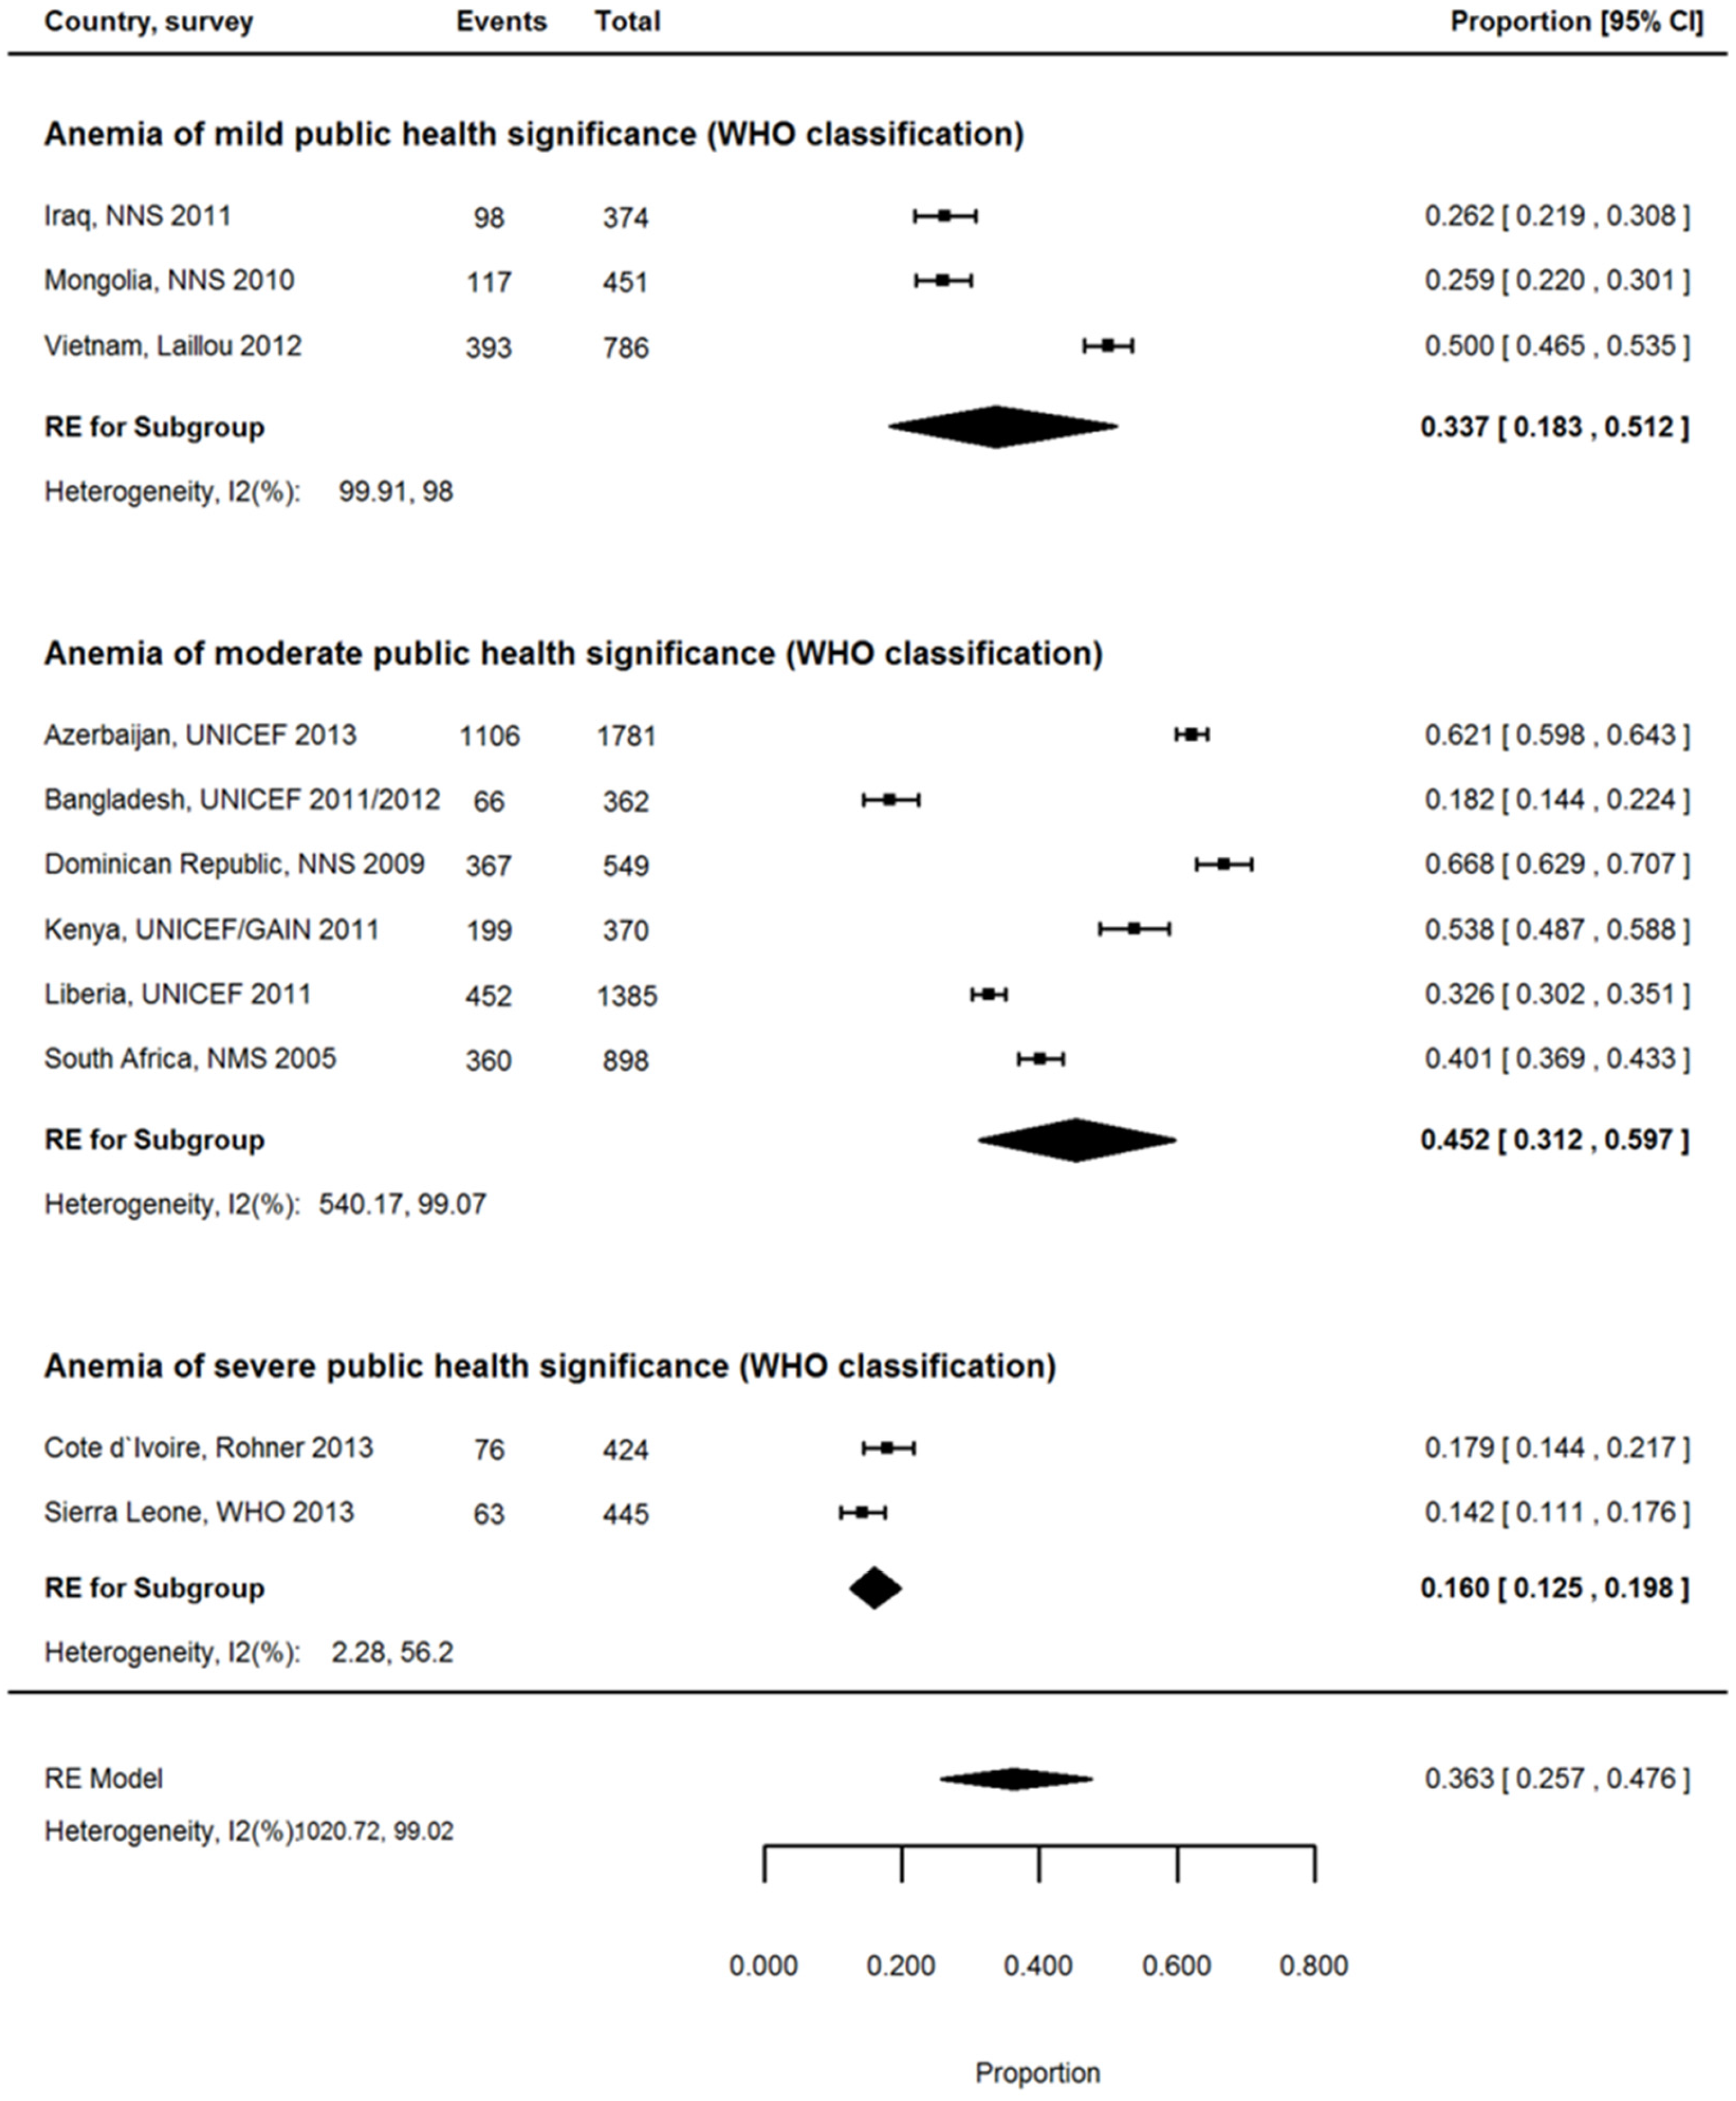
3.7. Proportion of Anemia Associated with ID among WRA
4. Discussion
4.1. Anemia Attributable to ID
4.2. Heterogeneity of Estimates of ID Associated with Anemia
4.3. Limitations of Analysis Methodology
5. Conclusions
Supplementary Materials
Author Contributions
Conflicts of Interest
References
- Benoist, B.; McLean, E.; Egli, I.; Cogswell, M. Worldwide Prevalence of Anemia: Who Global Database on Anemia; World Health Organization: Geneva, Switzerland, 2008. [Google Scholar]
- World Health Organization (WHO). The Global Prevalence of Anemia in 2011; World Health Organization: Geneva, Switzerland, 2015. [Google Scholar]
- Cavill, I.; Auerbach, M.; Bailie, G.R.; Barrett-Lee, P.; Beguin, Y.; Kaltwasser, P.; Littlewood, T.; Macdougall, I.C.; Wilson, K. Iron and the anaemia of chronic disease: A review and strategic recommendations. Curr. Med. Res. Opin. 2006, 22, 731–737. [Google Scholar] [CrossRef] [PubMed]
- Roy, C.N. Anemia of Inflammation; In Hematology: Marrow Responses to Aging and Inflammation. Hematol. Am. Soc. Hematol. Educ. Program. 2010, 2010, 276–280. [Google Scholar]
- Mockenhaupt, F.P.; Rong, B.; Gunther, M.; Beck, S.; Till, H.; Kohne, E.; Thompson, W.N.A.; Bienzle, U. Anaemia in pregnant Ghanaian women: Importance of malaria, iron deficiency, and haemoglobinopathies. Trans. R. Soc. Trop. Med. Hyg. 2000, 94, 477–483. [Google Scholar] [CrossRef]
- Khambalia, A.Z.; Aimone, A.M.; Zlotkin, S.H. Burden of anemia among indigenous populations. Nutr. Rev. 2011, 69, 693–719. [Google Scholar] [CrossRef] [PubMed]
- Camaschella, C. Iron-deficiency anemia. N. Engl. J. Med. 2015, 372, 1832–1843. [Google Scholar] [PubMed]
- Serjeant, G.R.; Serjeant, B.E. Sickle Cell Disease; Oxford University Press: Oxford, UK; New York, NY, USA, 1992. [Google Scholar]
- Kassebaum, N.J.; Jasrasaria, R.; Naghavi, M.; Wulf, S.K.; Johns, N.; Lozano, R.; Regan, M.; Weatherall, D.; Chou, D.P.; Eisele, T.P.; et al. A systematic analysis of global anemia burden from 1990 to 2010. Blood 2014, 123, 615–624. [Google Scholar] [CrossRef] [PubMed]
- Bhutta, Z.A.; Ahmed, T.; Black, R.E.; Cousens, S.; Dewey, K.; Giugliani, E.; Haider, B.A.; Kirkwood, B.; Morris, S.S.; Sachdev, H.P.; et al. What works? Interventions for maternal and child undernutrition and survival. Lancet 2008, 371, 417–440. [Google Scholar] [CrossRef]
- DeMaeyer, E.; Adiels-Tegman, M. The Prevalence of Anaemia in the World. La Prevalence de L’anemie dans le Monde. World Health Stat. Q. 1985, 38, 302–316. [Google Scholar] [PubMed]
- Stevens, G.A.; Finucane, M.M.; De-Regil, L.M.; Paciorek, C.J.; Flaxman, S.R.; Branca, F.; Pena-Rosas, J.P.; Bhutta, Z.A.; Ezzati, M.; Nutrition Impact Model Study Group. Global, regional, and national trends in haemoglobin concentration and prevalence of total and severe anaemia in children and pregnant and non-pregnant women for 1995–2011: A systematic analysis of population-representative data. Lancet Glob. Health 2013, 1, e16–e25. [Google Scholar] [PubMed]
- Beaton, G. Functional outcomes of iron deficiency and iron deficiency in pregnancy and beyond. In Proceedings of the INACG Symposium, Hanoi, Vietnam, 6–12 December 2001.
- Laillou, A.; Pham, T.V.; Tran, N.T.; Le, H.T.; Wieringa, F.; Rohner, F.; Fortin, S.; Le, M.B.; Tran do, T.; Moench-Pfanner, R.; et al. Micronutrient deficits are still public health issues among women and young children in Vietnam. PLoS ONE 2012, 7, e34906. [Google Scholar] [CrossRef] [PubMed]
- Thurnham, D.I.; McCabe, L.D.; Haldar, S.; Wieringa, F.T.; Northrop-Clewes, C.A.; McCabe, G.P. Adjusting plasma ferritin concentrations to remove the effects of subclinical inflammation in the assessment of iron deficiency: A meta-analysis. Am. J. Clin. Nutr. 2010, 92, 546–555. [Google Scholar] [CrossRef] [PubMed]
- Mejia-Rodriguez, F.; Shamah-Levy, T.; Villalpando, S.; Garcia-Guerra, A.; Mendez-Gomez Humaran, I. Iron, zinc, copper and magnesium deficiencies in Mexican adults from the national health and nutrition survey 2006. Salud Publica Mex. 2013, 55, 275–284. [Google Scholar] [PubMed]
- United Nations Development Programme. Human Development Index (HDI). UNDP, 2015. Available online: http://hdr.undp.org/en/content/human-development-index-hdi (accessed on 28 October 2016).
- World Health Organization. World Malaria Report; WHO: Geneva, Switzerland, 2015. [Google Scholar]
- Malaria Atlas Project. Endemic Countries. 2016. Available online: http://www.map.ox.ac.uk/explore/countries/ (accessed on 27 October 2016 ).
- World Health Organization. Distribution of Schistosomiasis, Worldwide, 2011; WHO: Geneva, Switzerland, 2012. [Google Scholar]
- World Health Organization. Global Health Observatory Map Gallery; WHO: Geneva, Switzerland, 2016. [Google Scholar]
- UNAIDS. Countries; United Nations, 2014. Available online: http://www.unaids.org/en/regionscountries/countries (accessed on 29 October 2016).
- World Health Organization. Who Global Infobase—Data for Saving Lives; WHO: Geneva, Switzerland, 2010. [Google Scholar]
- Freeman, M.F.; Tukey, J.W. Transformations related to the angular and the square root. Ann. Math. Stat. 1950, 21, 607–611. [Google Scholar] [CrossRef]
- Miller, J.L. The inverse of the freeman-tukey double arcsine transformation. Am. Stat. 1978, 32, 138. [Google Scholar]
- Engle-Stone, R.; Nankap, M.; Ndjebayi, A.O.; Erhardt, J.G.; Brown, K.H. Plasma ferritin and soluble transferrin receptor concentrations and body iron stores identify similar risk factors for iron deficiency but result in different estimates of the national prevalence of iron deficiency and iron-deficiency anemia among women and children in Cameroon. J. Nutr. 2013, 143, 369–377. [Google Scholar] [PubMed]
- Rohner, F.; Northrop-Clewes, C.; Tschannen, A.B.; Bosso, P.E.; Kouassi-Gohou, V.; Erhardt, J.G.; Bui, M.; Zimmermann, M.B.; Mascie-Taylor, C.G. Prevalence and public health relevance of micronutrient deficiencies and undernutrition in pre-school children and women of reproductive age in Côte d’Ivoire, west Africa. Public Health Nutr. 2014, 17, 2016–2028. [Google Scholar] [CrossRef] [PubMed]
- MoH. Kenya National Micronutrient Survey, KNMS 2011; Ministry of Health, UNICEF, GAIN, WHO, MI, WFP: Nairobi, Kenya, unpublished (expected end 2016).
- UNICEF. Liberia National Micronutrient Survey 2011—Selected Preliminary Findings; UNICEF, Liberia Institute of Statistics: Monrovia, Liberia, 2011. [Google Scholar]
- MoH. Mozambique Micronutrient Survey 2012–2013; Ministry of Health, National Institute of Statistics, HKI, GAIN, DANIDA, and Irish Aid: Maputo, Mozambique, unpublished (expected end 2016).
- Wirth, J.P.; Rohner, F.; Woodruff, B.A.; Chiwile, F.; Yankson, H.; Koroma, A.S.; Russel, F.; Sesay, F.; Dominguez, E.; Petry, N.; et al. Anemia, micronutrient deficiencies, and malaria in children and women in Sierra Leone prior to the Ebola outbreak—Findings of a cross-sectional study. PLoS ONE 2016, 11, e0155031. [Google Scholar] [CrossRef] [PubMed]
- Labadarios, D.; Swart, R.; Maunder, E.; Kruger, H.; Gericke, G.; Kuzwayo, P.; Ntsie, P.; Steyn, N.; Schloss, I.; Dhansay, M.; et al. National food consumption survey-fortification baseline (NFCS-FB): South Africa, 2005. S. Afr. J. Clin. Nutr. 2008, 21, 245–300. [Google Scholar]
- UNICEF. National Nutrition Survey Afghanistan (2013); Aga Khan University (AKU), Pakistan, Ministry of Public Health (MoPH) and UNICEF: Afghanistan, 2013. Available online: http://static1.squarespace.com/static/56424f6ce4b0552eb7fdc4e8/t/57490c778259b5de672ae2e3/1464405132287/Afghanistan_Report+NNS+2013.pdf (accessed on 28 October 2016).
- ICDDRB. National Micronutrients Status Survey 2011–2012, Bangladesh; Centre for Nutrition and Food Security, UNICEF, GAIN, and Institute of Public Health and Nutrition: Dhaka, Bangladesh, 2013; Available online: http://static1.squarespace.com/static/56424f6ce4b0552eb7fdc4e8/t/57490d3159827e39bd4d2314/1464405328062/Bangladesh_NMS_final_report_2011-12.pdf (accessed on 28 October 2016).
- Cambodia Demographic and Health Survey 2014; National Institute of Statistics, Directorate General for Health, and The DHS Program: Phnom Penh, Cambodia, 2015; Available online: https://dhsprogram.com/pubs/pdf/FR312/FR312.pdf (accessed on 28 October 2016).
- Knowles, J.; Thurnham, D.I.; Phengdy, B.; Houamboun, K.; Philavong, K.; Keomoungkhone, I.; Keovilay, K. Impact of inflammation on the biomarkers of iron status in a cross-sectional survey of Lao women and children. Br. J. Nutr. 2013, 110, 2285–2297. [Google Scholar] [CrossRef] [PubMed]
- MoH. Nutrition Status of Mongolian Population; fourth National Nutrition Survey Report, 2010; Minstry of Health, Public Health Institute, Nutrition Research Centre, UNICEF, WHO: Ulaanbaatar, Mongolia, 2011.
- Rohner, F.; Woodruff, B.A.; Aaron, G.J.; Yakes, E.A.; Lebanan, M.A.; Rayco-Solon, P.; Saniel, O.P. Infant and young child feeding practices in urban Philippines and their associations with stunting, anemia, and deficiencies of iron and vitamin A. Food Nutr. Bull. 2013, 34, S17–S34. [Google Scholar] [CrossRef] [PubMed]
- MoH. República Dominicana-Encuesta Nacional de Micronutrientes, 2009; Ministry of Health, Center for Social and Demographic Studies, CDC, and INCAP: SANTO DOMINGO, Dominican Republic, 2014.
- MoH. Ecuador-Encuesta Nacional de Salud y Nutricion, Ensanut-Ecu 2012; Minstry of Health, UNICEF, WHO, UNFPA: Quito, Ecuador, 2014.
- Villalpando, S.; Cruz Vde, L.; Shamah-Levy, T.; Rebollar, R.; Contreras-Manzano, A. Nutritional status of iron, vitamin b12, folate, retinol and anemia in children 1 to 11 years old: Results of the Ensanut 2012. Salud Publica Mex. 2015, 57, 372–384. [Google Scholar] [PubMed]
- Mora, J.O. Integrated Anemia Control Strategy (IACS) Has Significantly Reduced Anemia in Women and Children in Nicaragua; Micronutrient Initiative, 2007; Available online: https://www.k4health.org/sites/default/files/mora_2007.pdf (accessed on 29 October 2016).
- Sullivan, K.M.; Venugopalan, B.; Jefferds, M.E.; Boy, E.; Bonilla, J.; Sandino, I.; Halleslevens, P. Association of elevated alpha(1)-acid glycoprotein (AGP) and the prevalence of anemia in Nicaraguan preschool children. Food Nutr. Bull. 2012, 33, 137–141. [Google Scholar] [CrossRef] [PubMed]
- UNICEF. Iraq National Micronutrient Deficiencies: Assessment and Response 2011–2012; Iraqi Ministry of Health, WHO, UNICEF, WFP, and European Commission: Baghdad, Iraq, 2013.
- MoH. Oman-National Micronutrient Status and Fortified Food Coverage Survey; Ministry of Health, International Micronutrient Malnutrition Prevention and Control Program, CDC, WHO, UNICEF: Muscat, Oman, 2009.
- UNICEF. Azerbaijan Nutrition Survey (azns), 2013; USAID, World Bank Group, UNICEF: Azerbaijan, 2013. [Google Scholar]
- UNICEF. Report of the Georgia National Nutrition Survey; UNICEF, CDC, GAIN: Georgia, 2010; Available online: http://unicef.ge/uploads/Report_of_the_Georgia_National_Nutrition_Survey_2009_-_eng.pdf (accessed on 29 October 2016).
- UNICEF. Micronutrient Status Survey in Tajikistan, 2009; Ministry of Health Republic of Tajikistan, UNICEF: Tajikistan, 2010. Available online: http://www.slideshare.net/UNICEF-Tajikistan/micronutrient-status-survey-in-tajikistan (accessed on 28 October 2016).
- Hund, L.; Northrop-Clewes, C.A.; Nazario, R.; Suleymanova, D.; Mirzoyan, L.; Irisova, M.; Pagano, M.; Valadez, J.J. A novel approach to evaluating the iron and folate status of women of reproductive age in Uzbekistan after 3 years of flour fortification with micronutrients. PLoS ONE 2013, 8, e79726. [Google Scholar] [CrossRef] [PubMed]
- WHO. Serum Ferritin Concentrations for the Assessment of Iron Status and Iron Deficiency in Population. 2011. Available online: http://www.who.int/vmnis/indicators/serum_ferritin.pdf (accessed on 28 October 2016).
- De-Regil, L.M.; Jefferds, M.E.; Sylvetsky, A.C.; Dowswell, T. Intermittent iron supplementation for improving nutrition and development in children under 12 years of age. Cochrane Database Syst. Rev. 2011. [Google Scholar] [CrossRef]
- Fernandez-Gaxiola, A.C.; De-Regil, L.M. Intermittent iron supplementation for reducing anaemia and its associated impairments in menstruating women. Cochrane Database Syst. Rev. 2011. [Google Scholar] [CrossRef]
- Glinz, D.; Hurrell, R.F.; Ouattara, M.; Zimmermann, M.B.; Brittenham, G.M.; Adiossan, L.G.; Righetti, A.A.; Seifert, B.; Diakite, V.G.; Utzinger, J.; et al. The effect of iron-fortified complementary food and intermittent preventive treatment of malaria on anaemia in 12-to 36-month-old children: A cluster-randomised controlled trial. Malaria J. 2015, 14. [Google Scholar] [CrossRef] [PubMed]
- Stein, A.J.; Meenakshi, J.V.; Qaim, M.; Nestel, P.; Sachdev, H.P.; Bhutta, Z.A. Analyzing the Health Benefits of Biofortified Staple Crops by Means of the Disability-Adjusted Life Years Approach: A Handbook Focusing on Iron, Zinc and Vitamin A; IFPRI/CIAT: Washington, DC, USA, 2005. [Google Scholar]
- Suchdev, P.S.; Namaste, S.M.; Aaron, G.J.; Raiten, D.J.; Brown, K.H.; Flores-Ayala, R.; Group, B.W. Overview of the biomarkers reflecting inflammation and nutritional determinants of anemia (BRINDA) project. Adv. Nutr. 2016, 7, 349–356. [Google Scholar] [CrossRef] [PubMed]


| Country | Region 1 | Inflammation Exposure | Anemia | IDA | ID | Proportion of Anemia Associated with ID | Reference | |||
|---|---|---|---|---|---|---|---|---|---|---|
| n | % | n | % | n | % | % | ||||
| Cameroon, 2012 2 | SSA | Very high | 859 | 57.6 | 798 | 16.5 | 838 | 20.6 | 28.7 | [26] |
| Côte d’Ivoire, 2007 2 | SSA | Very high | 879 | 71.8 | 783 | 12.0 | 781 | 15.5 | 16.7 | [27] |
| Kenya, 2011 2 | SSA | High | 827 | 26.3 | 827 | 13.3 | 918 | 21.8 | 50.6 | [28] |
| Liberia, 2011 2 | SSA | Very high | 1445 | 59.1 | 1415 | 21.2 | 1416 | 29.8 | 35.9 | [29] |
| Mozambique, 2012/2013 2,4 | SSA | Very high | 962 | 70.8 | 917 | 17.3 | 917 | 19.3 | 24.4 | [30] |
| Sierra Leone, 2013 2 | SSA | Very high | 710 | 76.3 | 668 | 3.8 | 654 | 5.2 | 5.0 | [31] |
| South Africa, 2005 3 | SSA | High | 1049 | 28.9 | 768 | 12.3 | 821 | 21.4 | 42.6 | [32] |
| Afghanistan, 2013 2 | SEA | Medium | 728 | 44.9 | 728 | 13.7 | 728 | 26.1 | 30.5 | [33] |
| Bangladesh, 2011/2012 2 | SEA | Medium | 607 | 33.1 | 449 | 7.2 | 468 | 10.7 | 21.8 | [34] |
| Cambodia, 2014 2 | SEA | High | 485 | 51.7 | 485 | 6.0 | 485 | 7.6 | 11.6 | [35] |
| Laos, 2006 2 | SEA | High | 495 | 40.9 | 483 | 10.8 | 483 | 18.4 | 26.4 | [36] |
| Mongolia, 2010 5 | SEA | Medium | 433 | 23.9 | 433 | 5.0 | 433 | 21.4 | 20.9 | [37] |
| Philippines, 2010 2 | SEA | High | 1784 | 41.8 | 1784 | 18.7 | 1784 | 27.9 | 44.7 | [38] |
| Vietnam, 2009 2 | SEA | Low | 583 | 9.1 | 564 | 3.2 | 568 | 12.9 | 35.2 | [14] |
| Dominican Rep., 2009 5 | LAC | Low | 772 | 28.1 | 321 | 8.7 | 321 | 27.7 | 31.0 | [39] |
| Ecuador, 2012 3 | LAC | Low | 2046 | 25.7 | 1913 | 7.0 | 2045 | 10.6 | 27.2 | [40] |
| Mexico, 2012 2 | LAC | Low | 2352 | 20.4 | 2319 | 3.4 | 2319 | 13.9 | 16.7 | [41] |
| Nicaragua, 2003–2005 5 | LAC | Medium | 1420 | 20.1 | 731 | 6.9 | 731 | 37.9 | 34.3 | [42,43] |
| Iraq, 2011 3 | ME | Medium | 2275 | 21.6 | 2087 | 9.5 | 2087 | 20.2 | 44.0 | [44] |
| Oman, 2005 3 | ME | Low | 247 | 41.5 | 178 | 11.2 | 183 | 26.3 | 27.0 | [45] |
| Azerbaijan, 2013 2 | CA | Medium | 111 | 24.2 | 1460 | 6.5 | 1233 | 15.0 | 26.9 | [46] |
| Georgia, 2010 5 | CA | Low | 2222 | 23.9 | 1648 | 0.1 | 1648 | 0.2 | 0.3 | [47] |
| Tajikistan, 2009 3 | CA | Low | 2136 | 28.7 | 2136 | 8.6 | 2136 | 12.1 | 16.4 | [48] |
| Country | Region 1 | Inflammation Exposure | Anemia | IDA | ID | Proportion of Anemia Associated with ID % | Reference | |||
|---|---|---|---|---|---|---|---|---|---|---|
| n | % | n | % | n | % | |||||
| Cameroon, 2012 2,3 | SSA | Very high | 888 | 38.8 | 857 | 11.1 | 872 | 15.3 | 28.6 | [26] |
| Côte d’Ivoire, 2007 2 | SSA | Very high | 928 | 49.9 | 905 | 11.6 | 910 | 16.7 | 23.3 | [27] |
| Kenya, 2011 2 | SSA | High | 592 | 21.9 | 592 | 14.0 | 633 | 21.3 | 63.9 | [28] |
| Liberia, 2011 2 | SSA | Very High | 1955 | 33.2 | 1911 | 11.3 | 1911 | 19.6 | 34.0 | [29] |
| Mozambique, 2012/2013 2,4 | SSA | Very high | 1086 | 39.8 | 1068 | 16.1 | 1068 | 25.1 | 40.5 | [30] |
| Sierra Leone, 2013 2 | SSA | Very high | 871 | 44.8 | 827 | 6.1 | 774 | 8.3 | 13.6 | [31] |
| South Africa, 2005 5 | SSA | High | 2126 | 29.4 | 2126 | 11.8 | 1906 | 20.9 | 40.1 | [32] |
| Afghanistan, 2013 2,3 | SEA | Medium | 1187 | 40.4 | 1187 | 13.8 | 1187 | 24.0 | 34.2 | [33] |
| Bangladesh, 2011/2012 2 | SEA | Low | 1031 | 26.0 | 868 | 4.8 | 882 | 7.1 | 18.5 | [34] |
| Cambodia, 2014 2,3 | SEA | Medium | 450 | 42.7 | 450 | 2.2 | 450 | 2.9 | 5.2 | [35] |
| Laos, 2006 2 | SEA | Medium | 825 | 36.2 | 818 | 14.6 | 818 | 23.2 | 40.3 | [36] |
| Mongolia, 2010 6 | SEA | Medium | 892 | 14.4 | 767 | 3.0 | 767 | 28.2 | 20.8 | [37] |
| Vietnam, 2009 2 | SEA | Low | 1526 | 11.6 | 1522 | 5.4 | 1523 | 13.7 | 46.6 | [14] |
| Dominican Rep., 2009 6 | LAC | Medium | 1129 | 33.8 | 534 | 20.9 | 541 | 49.4 | 61.8 | [39] |
| Ecuador, 2012 3 | LAC | Low | 6958 | 16.9 | 6548 | 9.0 | 6957 | 15.5 | 53.3 | [40] |
| Mexico, 2006 7 | LAC | Medium | 2521 | 14.1 | 2521 | 8.1 | 2521 | 9.5 | 59.7 | [16] |
| Nicaragua, 2003–2005 5,8 | LAC | Medium | 1500 | 11.2 | 1500 | 6.9 | 1500 | 30.9 | 61.6 | [42] |
| Iraq, 2011 5 | ME | Medium | 1206 | 19.9 | 1152 | 5.7 | 1152 | 28.7 | 28.6 | [44] |
| Oman, 2005 5 | ME | Low | 352 | 38.8 | 338 | 29.0 | 342 | 51.1 | 74.7 | [45] |
| Azerbaijan, 2013 2 | CA | Medium | 2706 | 38.2 | 2621 | 23.8 | 2727 | 34.1 | 62.3 | [46] |
| Georgia, 2010 6 | CA | Low | 1721 | 24.1 | 1721 | 0.7 | 1721 | 1.6 | 2.9 | [47] |
| Tajikistan, 2009 5 | CA | Low | 2138 | 24.2 | 2138 | 2.2 | 2138 | 9.7 | 9.1 | [48] |
| Uzbekistan, 2008 2 | CA | Low | 2582 | 34.4 | 2582 | 21.8 | 2582 | 47.5 | 63.2 | [49] |
| Stratification | % | (95% CI) | I2 (%) |
|---|---|---|---|
| Overall | 24.6 | (17.7; 32.2) | 99.4 |
| Regions 1 | |||
| SSA | 28.1 | (15.6; 42.6) | 99.3 |
| SEA | 24.0 | (17.6; 31.1) | 95.4 |
| LAC | 26.9 | (18.9; 35.8) | 98.3 |
| ME | 35.6 | (20.2; 52.7) | 96.4 |
| CA | 11.0 | (0.2; 34.5) | 99.8 |
| Anemia burden, all | |||
| Severe (≥40%) | 21.7 | (13.8; 30.7) | 98.4 |
| Moderate (20%–39.9%) | 25.7 | (15.8; 37.2) | 99.6 |
| Anemia burden, rural | |||
| Severe (≥40%) | 13.9 | (1.4; 35.9) | 99.1 |
| Moderate (20%–39.9%) | 33.8 | (26.2; 41.8) | 95.5 |
| Anemia burden, urban | |||
| Severe (≥40%) | 26.0 | (13.7; 40.7) | 98.9 |
| Moderate (20%–39.9%) | 39.8 | (31.9; 48.0) | 95.1 |
| Inflammation exposure | |||
| Very high | 20.0 | (8.0; 35.6) | 99.2 |
| High | 31.7 | (16.4; 49.4) | 99.2 |
| Moderate | 29.6 | (22.5; 37.2) | 98.2 |
| Low | 19.6 | (8.8; 33.4) | 99.7 |
| Setting | |||
| rural | 28.0 | (19.2; 37.7) | 98.3 |
| urban | 32.5 | (25.1; 40.4) | 98.0 |
| Stratification | % | (95% CI) | I2 (%) |
|---|---|---|---|
| Women of reproductive age | |||
| Overall | 36.7 | (27.6; 46.3) | 99.7 |
| Regions 1 | |||
| SSA | 33.1 | (22.5; 44.7) | 99.0 |
| SEA | 26.1 | (15.1; 38.8) | 99.1 |
| LAC | 59.0 | (54.3; 63.7) | 95.7 |
| ME | 51.8 | (10.7; 91.4) | 99.6 |
| CA | 29.7 | (3.8; 66.7) | 99.9 |
| Anemia burden, all | |||
| Severe (≥40%) | 17.7 | (7.6; 30.9) | 98.8 |
| Moderate (20%–39.9%) | 39.7 | (25.1; 55.3) | 99.8 |
| Mild (5%–19.9%) | 44.7 | (33.9; 55.8) | 99.4 |
| Anemia burden, rural | |||
| Severe (≥40%) | 16.0 | (12.5; 19.8) | 99.0 |
| Moderate (20%–39.9%) | 45.2 | (31.2; 59.7) | 99.1 |
| Mild (5%–19.9%) | 33.7 | (18.3; 51.2) | 98.0 |
| Anemia burden, urban | |||
| Severe (≥40%) | 33.5 | (8.3; 65.4) | 99.5 |
| Moderate (20%–39.9%) | 37.4 | (28.5; 46.8) | 97.6 |
| Mild (5%–19.9%) | 52.0 | (18.8; 84.2) | 99.4 |
| Inflammation exposure | |||
| Very high | 24.5 | (16.1; 34.0) | 98.0 |
| High | 52.0 | (29.1; 74.4) | 99.1 |
| Moderate | 40.3 | (28.0; 53.2) | 99.5 |
| Low | 35.3 | (15.9; 57.6) | 99.9 |
| Setting | |||
| rural | 36.3 | (25.7; 47.6) | 99.0 |
| urban | 39.9 | (30.2; 50.1) | 98.8 |
© 2016 by the authors; licensee MDPI, Basel, Switzerland. This article is an open access article distributed under the terms and conditions of the Creative Commons Attribution (CC-BY) license (http://creativecommons.org/licenses/by/4.0/).
Share and Cite
Petry, N.; Olofin, I.; Hurrell, R.F.; Boy, E.; Wirth, J.P.; Moursi, M.; Donahue Angel, M.; Rohner, F. The Proportion of Anemia Associated with Iron Deficiency in Low, Medium, and High Human Development Index Countries: A Systematic Analysis of National Surveys. Nutrients 2016, 8, 693. https://doi.org/10.3390/nu8110693
Petry N, Olofin I, Hurrell RF, Boy E, Wirth JP, Moursi M, Donahue Angel M, Rohner F. The Proportion of Anemia Associated with Iron Deficiency in Low, Medium, and High Human Development Index Countries: A Systematic Analysis of National Surveys. Nutrients. 2016; 8(11):693. https://doi.org/10.3390/nu8110693
Chicago/Turabian StylePetry, Nicolai, Ibironke Olofin, Richard F. Hurrell, Erick Boy, James P. Wirth, Mourad Moursi, Moira Donahue Angel, and Fabian Rohner. 2016. "The Proportion of Anemia Associated with Iron Deficiency in Low, Medium, and High Human Development Index Countries: A Systematic Analysis of National Surveys" Nutrients 8, no. 11: 693. https://doi.org/10.3390/nu8110693
APA StylePetry, N., Olofin, I., Hurrell, R. F., Boy, E., Wirth, J. P., Moursi, M., Donahue Angel, M., & Rohner, F. (2016). The Proportion of Anemia Associated with Iron Deficiency in Low, Medium, and High Human Development Index Countries: A Systematic Analysis of National Surveys. Nutrients, 8(11), 693. https://doi.org/10.3390/nu8110693