Abstract
Purpose To derive and validate an effective radiomics-based model for differentiation of COVID-19 pneumonia from other lung diseases using a very large cohort of patients.
Methods We collected 19 private and 5 public datasets, accumulating to 26,307 individual patient images (15,148 COVID-19; 9,657 with other lung diseases e.g. non-COVID-19 pneumonia, lung cancer, pulmonary embolism; 1502 normal cases). Images were automatically segmented using a validated deep learning (DL) model and the results carefully reviewed. Images were first cropped into lung-only region boxes, then resized to 296×216 voxels. Voxel dimensions was resized to 1×1×1mm3 followed by 64-bin discretization. The 108 extracted features included shape, first-order histogram and texture features. Univariate analysis was first performed using simple logistic regression. The thresholds were fixed in the training set and then evaluation performed on the test set. False discovery rate (FDR) correction was applied to the p-values. Z-Score normalization was applied to all features. For multivariate analysis, features with high correlation (R2>0.99) were eliminated first using Pearson correlation. We tested 96 different machine learning strategies through cross-combining 4 feature selectors or 8 dimensionality reduction techniques with 8 classifiers. We trained and evaluated our models using 3 different datasets: 1) the entire dataset (26,307 patients: 15,148 COVID-19; 11,159 non-COVID-19); 2) excluding normal patients in non-COVID-19, and including only RT-PCR positive COVID-19 cases in the COVID-19 class (20,697 patients including 12,419 COVID-19, and 8,278 non-COVID-19)); 3) including only non-COVID-19 pneumonia patients and a random sample of COVID-19 patients (5,582 patients: 3,000 COVID-19, and 2,582 non-COVID-19) to provide balanced classes. Subsequently, each of these 3 datasets were randomly split into 70% and 30% for training and testing, respectively. All various steps, including feature preprocessing, feature selection, and classification, were performed separately in each dataset. Classification algorithms were optimized during training using grid search algorithms. The best models were chosen by a one-standard-deviation rule in 10-fold cross-validation and then were evaluated on the test sets.
Results In dataset #1, Relief feature selection and RF classifier combination resulted in the highest performance (Area under the receiver operating characteristic curve (AUC) = 0.99, sensitivity = 0.98, specificity = 0.94, accuracy = 0.96, positive predictive value (PPV) = 0.96, and negative predicted value (NPV) = 0.96). In dataset #2, Recursive Feature Elimination (RFE) feature selection and Random Forest (RF) classifier combination resulted in the highest performance (AUC = 0.99, sensitivity = 0.98, specificity = 0.95, accuracy = 0.97, PPV = 0.96, and NPV = 0.98). In dataset #3, the ANOVA feature selection and RF classifier combination resulted in the highest performance (AUC = 0.98, sensitivity = 0.96, specificity = 0.93, accuracy = 0.94, PPV = 0.93, NPV = 0.96).
Conclusion Radiomic features extracted from entire lung combined with machine learning algorithms can enable very effective, routine diagnosis of COVID-19 pneumonia from CT images without the use of any other diagnostic test.
INTRODUCTION
The recent pandemic caused by severe acute respiratory syndrome coronavirus 2 (SARS-CoV-2) has raised great concerns worldwide 1. As of December 2021, it has been responsible for more than 265 million confirmed cases and 5 million deaths all over the globe (see who.int). Different diagnostic methods have been proposed for SARS-CoV-2, also known as COVID-19. The most popular is the real-time reverse transcriptase-polymerase chain reaction (RT-PCR), which is a molecular test 2–6. Although RT-PCR is a highly reputable diagnostic test, it has some drawbacks, such as the delay in providing test reports, the remarkable effort of healthcare professionals in the process of sampling, and last but not least, the limited availability of the test kits especially in developing countries. In this regard, many physicians have turned to other diagnostic methods, including chest X-ray (CXR) and computed tomography (CT). CXR plays an important role in the non-invasive, fast, widely available, and cost-effective assessment of pulmonary lesions 7. In the context of COVID-19, some characteristics, such as ground glass or patchy opacities can be linked with COVID-19 pneumonia in a CXR. Nonetheless, discovering these findings requires expertise as these changes are subtle 8. CT images, on the other hand, better demonstrate the opacities and are useful even for the early diagnosis of COVID-19 pneumonia in asymptomatic/pre-symptomatic patients 9. Moreover, CT shows a significantly higher sensitivity compared to CXR 10, 11. Thus, it is better suited in the triage of patients if a scanner is available and the higher dose of X-rays to the patient via CT imaging is carefully considered 11.
A wide range of studies has been published on the clinical use of CT and its qualitative and quantitative analysis for the diagnosis and management of COVID-19 patients 12, 13. A number of qualitative/semi-quantitative findings in chest CT, such as the presence and laterality of ground-glass opacities and consolidation, number of lobes affected, the extent of lung involvement are used as acceptable features for COVID-19 diagnosis 14. Nevertheless, these findings are most likely to be subjective, rely on physician’s inference, and have very low specificity for a definitive diagnosis of COVID-19 15. Artificial Intelligence (AI) has been proposed as a solution to address the aforementioned limitations of CT (e.g., low specificity) as it provides with tools that can visualize and extract the most subtle and minute characteristics of images.
Radiomics, a high-level image analysis technique that mines multi-dimensional data from medical images, has especially emerged in the past decade 16–30 and is continuing to grow. It has been utilized in a range of diseases towards improved diagnosis, prognosis, treatment response assessment and other aspects of patient management. Recently, COVID-19 researchers have conducted a number of CT radiomics studies 17–19, 31. For prognosis, Tang et al. 32 focused on the prediction of COVID-19 severity using radiomics features of CT images and laboratory data. In another study, Wu et al. 33 analyzed the prognostic ability of radiomics features based on CT images of 492 patients to determine the poor-outcome group. Studies reported on the feasibility of deep learning (DL)/radiomics applied to CT images towards classification (e.g. COVID-19 pneumonia, non-COVID-19 pneumonia, other lung diseases, or normal images). Harmon et al. 34 trained a DL-based neural network and validated it on a cohort of 1337 patients. Bai et al. 35 included 1186 patients and evaluated an AI model for classifying CT images into COVID-19 and non-COVID-19 pneumonia. Zhang et al. 36 conducted a study on 3777 patients and evaluated an AI system with the addition of clinical data to determine whether an image reflects COVID-19 pneumonia, other pneumonia, or normal. Di et al. 37 utilized radiomic features to assess the differentiation of COVID-19 pneumonia and community-acquired pneumonia in 3330 patients. Xie et al. 38 evaluated the ability of radiomics features and ground-glass opacities in 301 patients for the discrimination of COVID-19 and non-COVID-19 patients.
Most aforementioned studies utilized datasets consisting of the dichotomy of COVID-19 pneumonia vs. other non-COVID-19 pneumonia, or COVID-19 vs. normal patients. However, some CXR or CT studies included other lung diseases as well. For instance, Albahli et al. 39 included 14 classes of diseases (e.g. cancer, pneumothorax, fibrosis, edema, atelectasis, etc.) in their dataset and trained their model on CXR images. Das et al. 40 also included tuberculosis patients and added their images to COVID-19 pneumonia, other pneumonia, and healthy CXR images of their dataset. Wang et al. 41 studied a dataset consisting of COVID-19 and other lung disease images in addition to normal lung images.
Several limitations were reported in a systematic review by Roberts et al. 42, which included more than 2,000 original articles focusing on the development of different DL/ML-based algorithms in diagnosis/prognosis of COVID-19 patients. First and foremost is data bias, many articles have used datasets with small sample sizes, duplicate samples, low quality or non-standardized medical image format. Moreover, many researchers have studied so-called Frankenstein 42 and Toy 43 datasets, utilizing small and/or low-quality images, which assemble and redistributed from other datasets 42. In addition, most of studies have not provided sufficient information regarding data preprocessing, demographics of training/testing cohorts, and code and data availability. Roberts et al. 42 reported that most articles in the diagnostic era failed to balance the number of COVID-19 and other classes of diseases in the training and testing datasets. For example, a study may have included considerably fewer COVID-19 cases compared to other cases. Regarding the methodology, most of the studies failed to elucidate an exact methodology which is a must for conducting a reproducible study. Hence, few studies are practical in real clinical situations.
In the present study, we have gathered a multi-institutional, multi-national CT image datasets of more than 26,307 patients containing COVID-19, non-COVID-19 pneumonia, and other lung pathologies. We aimed to assess the value of systematically utilizing CT-based radiomics to distinguish COVID-19 pneumonia from non-COVID-19 pneumonia and other types of lung diseases, using multiple dimensionality reduction, feature selection, and classification algorithms. To this end, we have assembled and utilized a very large, curated dataset and applied different AI, radiomics and prognostic/diagnostic modeling guidelines.
MATERIALS AND METHODS
The methodological steps adopted in this study can be found in Figure 1. We filled out several standardized checklists regarding diagnostic modelling (TRIPOD, Transparent Reporting of a multivariable prediction model for Individual Prognosis Or Diagnosis [40]), and AI in medical image analysis (CLAIM, Checklist for Artificial Intelligence in Medical imaging 44) to ensure the reproducibility and decency of our study. The two checklists were completed separately by two expert medical imaging scientists in the field of radiomics and AI (with consensus) who were not co-authors of this study. The complete checklist of standardizations was provided in the supplementary files.
Flowchart of different steps implemented in this study.
Datasets
The data of this study consisted of 18 local and 5 public datasets containing both COVID-19 and other lung diseases, arriving at 26,307 individual patient images (15,148 COVID-19; 9,657 with other lung diseases including non-COVID-19 pneumonia, lung cancer pulmonary embolism; and 1,502 normal). Our public dataset consisted of 5 separate datasets, including 1,744 COVID-19 34, 45, 46, pulmonary embolism (PE, n=5,696) 47, and lung cancer (n=1,379) 45 CT images. Our private datasets were assembled in this effort from 18 clinical centers in Iran totaling 13,404 COVID-19 patients with the same number of CT images (one image per patient). Our study was approved by the local ethics committees, and written informed consent was waived owing to its retrospective nature.
To be included in the study, patients had to have either a positive RT-PCR result or positive CT findings. CT findings were considered as consistent with COVID-19 if: (a) typical COVID-19 patterns and manifestations are observed as described in the COVID-19 Reporting and Data System (CO-RADS) 48, and (b) two radiologists separately reached a conclusion that CT images are compatible with COVID-19 patterns, and (c) a third radiologist confirmed the diagnosis if the two former radiologists face a discrepancy in their opinions. After including the eligible patients, we applied our exclusion criteria to prepare a cleaner dataset. The exclusion criteria were as follows: patients who had negative RT-PCR result (n= 1,900), patients with severe motion artefacts in CT images confirmed by an experienced medical physicist (n= 560), patients with inappropriate positions in CT images (n= 121), patients with low-quality CT images (n= 210). In addition, 1,379 normal cases without any sign in CT images or background of lung disease, and 2,582 patients with other pneumonia (non-COVID-19) were enrolled to this study. After applying the aforementioned exclusion criteria, a total of 26,307 patients were enrolled as our overall dataset. Images were acquired in different medical centers using various CT scanners, there was a variability in acquisition parameters such as tube current and slice thickness. In our local medical centers, CT imaging was performed at the end inhalation breath-hold to decrease respiratory motion artefacts. More information on public database were provided in 34, 45–47.
Image Segmentation, Image Preprocessing, and Feature Extraction
The images were segmented automatically using a previously constructed DL algorithm 49 and were reviewed to confirm the segmentation outcome. The images were first cropped to attain the lung-only region box, then resized to 296×216. Image voxel size was resized to 1×1×1 mm3 followed by 64-bin discretization. Radiomics feature extraction was performed using the Pyradiomcis library 50, which has been standardized according to the Image Biomarker Standardization Initiative (IBSI) 51. The 108 extracted features included shape (n=16), first-order histogram, second-order Gray Level Co-occurrence Matrix (GLCM, n=24), and higher-order features including Gray Level Dependence Matrix (GLDM, n=14), Gray Level Size Zone Matrix (GLSZM, n=16), Gray Level Run Length Matrix (GLRLM, n=16), and Neighboring Gray Tone Difference Matrix (NGTDM, n=5).
Univariate Analysis
Univariate analysis was performed by using simple logistic regression; each feature was trained on the training sets, and the results were reported on the testing sets. Benjamin and Hochberg false discovery rate (FDR) corrections was applied to the p-values. Statistical comparison of AUCs between training sets and test sets was performed by the DeLong test [41] to ascertain best performance.
Feature Preprocessing, Feature Selection, and Classifiers
Z-Score normalization was applied to all features. The mean and standard deviation were calculated in the training sets and then applied to testing sets. Features with high correlation (R2>0.99) were eliminated using Pearson correlation. In this study, we used 4 feature selection algorithms, including Analysis of Variance (ANOVA), Kruskal-Wallis (KW), Recursive Feature Elimination (RFE), and Relief, and 8 dimensionality reduction techniques, including Principal Component Analysis (PCA), Incremental PCA (IPCA), Kernel PCA (KPCA), Truncated SVD (TSVD), Gaussian Random Projection (GRP), Sparse Random Projection (SRP), Fast ICA (FICA), and TSNE. For the classification task, we used 8 classifiers, including Logistic Regression (LR), Least Absolute Shrinkage and Selection Operator (LASSO), Linear Discriminant Analysis (LDA), Decision Tree (DT), Random Forest (RF), AdaBoost (AB), Naïve Bayes (NB), and Multilayer Perceptron (MLP). By cross-combining our 4 feature selectors + 8 dimensionality reduction techniques with the 8 classifiers, we tested 96 different combinations.
Evaluation
We trained and evaluated our models in 3 different scenarios. First of all, the entire dataset (26,307 patients including 15,148 COVID-19 and 11,159 non-COVID-19) being randomly split into 70% (18,414 patients) and 30% (7,893 patients) for the training and test sets, respectively. As our data included patients whose COVID-19 was confirmed using RT-PCR and patients confirmed only by imaging, this dataset included both populations. Second, excluding normal patients in other lung disease class, and only including RT-PCR positive COVID-19 cases in COVID-19 class, the resulting dataset (20,697 patients including 12,419 COVID-19, and 8,278 non-COVID-19) was randomly split into 70% (14,677 patients) and 30% (6,209 patients) for the training and test sets, respectively. In Third dataset, only including non-COVID-19 pneumonia patients and a random sample of COVID-19 patients (5,582 patients including 3,000 COVID-19 and 2,582 non-COVID-19) to provide a balanced dataset, and then randomly split the dataset into 70% (3,907 patients) and 30% (1,675 patients) for the training and test sets, respectively.
The multivariate steps, including feature preprocessing, feature selection, and classification were performed separately for each dataset. Classification algorithms were optimized during training using grid search algorithms. The best models were chosen by a one-standard-deviation rule in 10-fold cross- validation and then evaluated on test sets. The accuracy, sensitivity, specificity, area under the receiver operating characteristic curve (AUC), positive predictive value (PPV), and negative predicted value (NPV) were reported for the test set. Statistical comparison of AUCs between the different models in the test sets was performed by the DeLong test 52 to ascertain best performances. The significance level was considered at the level of 0.05. All multivariate analysis steps were performed in the Python open-source library Scikit-Learn 53.
RESULTS
Figure 2 shows the hierarchical clustering heat map of the radiomics feature distribution for COVID-19 and lung disease classes for the entire dataset (i.e. dataset #1). We provide a hierarchical clustering heat map for strategies 2 and 3 in Supplemental Figures 1 and 2, respectively. The correlation of radiomic features are depicted in Figure 3 for the entire dataset, whereas Supplemental Figures 3 and 4 show the same for strategies 2 and 3. Highly correlated features (R2>0.99) were identified and redundant features eliminated, enabling dimensionality reduction in an unsupervised manner, prior to multivariate analysis using machine learning algorithms.
Cluster heat map of dataset 2, columns and rows are the radiomics features and patients sample, respectively
Cluster heat map for dataset 3. columns and rows are the radiomics features and patients sample, respectively
Correlation matrix between different features in dataset 2
Correlation matrix between different features in dataset 3
Cluster heat map of the whole dataset. Columns and rows are the radiomics features and patients sample, respectively.
Correlation matrix between different features in the entire dataset.
Supplemental Tables 1-3 summarize univariate analysis for each feature in strategies 1, 2 and 3, respectively. We report the training and test AUC, sensitivity, specificity, and also adjusted p-values (using Benjamin and Hochberg FDR method) for each feature using binary logistic regression. When comparing AUCs, none of the features had a p-value<0.05 for the training and test sets using the DeLong test. In dataset #1, 3 features including Robust Mean Absolute Deviation from first-order (AUC = 0.55, Sensitivity = 0.54, Specificity = 0.56), Small Area High Gray Level Emphasis from GLSZM (AUC = 0.55, Sensitivity = 0.61, Specificity = 0.55), and Long-Run High Gray Level Emphasis form GLRLM (AUC = 0.5, Sensitivity = 0.54, Specificity = 0.50) had AUC, sensitivity and specificity higher than 0.50. For strategies 2 and 3, Robust Mean Absolute Deviation from first-order (AUC = 0.55, Sensitivity = 0.54 and Specificity = 0.51) and Large Dependence Emphasis from GLDM (AUC = 0.55, Sensitivity = 0.50 and Specificity = 0.57) had AUC, sensitivity and specificity higher than 0.5, respectively.
Univariate analysis in dataset 1
Univariate analysis in dataset 2
Univariate analysis in dataset 3
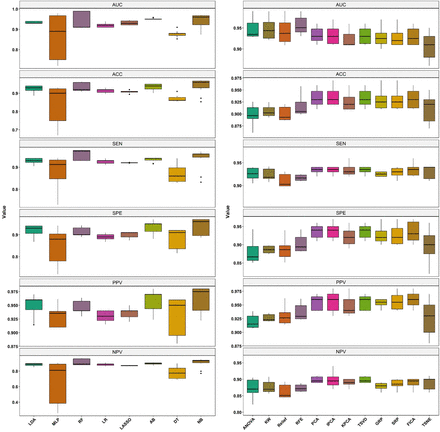
For dataset #1, Figure 4 represents the heatmap of the cross-combination of feature selectors and classifiers for AUC, sensitivity, specificity, accuracy, PPV, NPV, wherein collective datasets was randomly split into 70% (18,208 patients) and 30% (7,804 patients) for the training and test sets, respectively. Relief feature selection and RF classifier combination resulted in highest performance (AUC = 0.99, sensitivity = 0.98, specificity = 0.94, accuracy = 0.96, PPV = 0.96, NPV = 0.96). Supplemental Figure 5 presents a box plot of feature selectors and classifiers for the different evaluation metrics in dataset 1.
Box plot of different quantitative parameters for different feature selectors and classifiers in dataset 1
Heatmaps of the cross-combination of feature selectors (12 rows) and classifiers (8 columns) for AUC, sensitivity, specificity, accuracy, PPV, NPV in dataset #1.
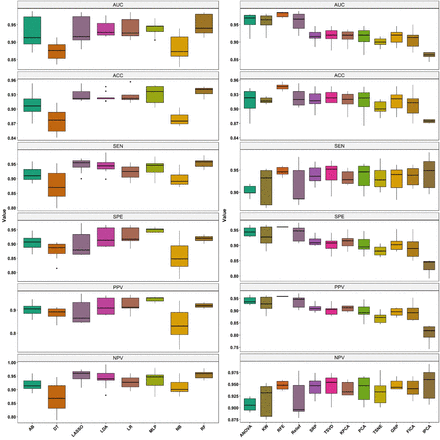
For dataset #2, Figure 5 represents the heatmap of the cross-combination of feature selectors and classifiers for AUC, sensitivity, specificity, accuracy, PPV, NPV, wherein normal cases were excluded and CT images with PCR-Positive were included and then randomly split into 70% (15,514 patients) and 30% (6,649 patients) for the training and test sets, respectively. RFE feature selection and RF classifier combination resulted in highest performance (AUC = 0.99, sensitivity = 0.98, specificity = 0.95, accuracy = 0.97, PPV = 0.96, NPV = 0.98). Supplemental Figure 6 represents a box plot of feature selectors and classifiers for different evaluation metrics in dataset #2.
Box plot of different quantitative parameters for different feature selectors and classifiers for dataset 2
Heatmaps of the cross-combination of feature selectors (12 rows) and classifiers (8 columns) for AUC, sensitivity, specificity, accuracy, PPV, NPV in dataset #2.
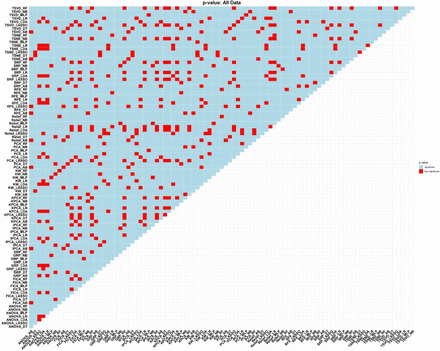
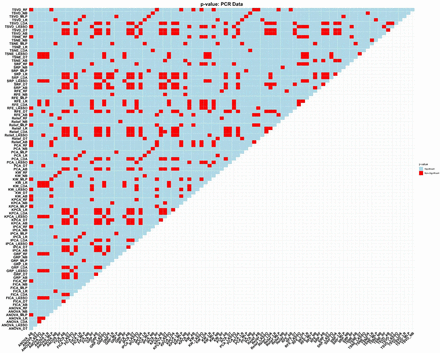
For dataset #3, Figure 6 represents the heatmap of the cross-combination of feature selectors and classifiers for AUC, sensitivity, specificity, accuracy, PPV, NPV, which CT images with PCR-Positive and community-acquired pneumonia were included and then randomly split into 70% (10,205 patients) and 30% (4,200 patients) for the training and test sets, respectively. ANOVA feature selection and RF classifier combination resulted in highest performance (AUC = 0.98, sensitivity = 0.96, specificity = 93, accuracy = 0.94, PPV = 0.93, NPV = 0.96). Supplemental Figure 2 represents a box plot of feature selectors and classifiers for different evaluation metrics in dataset #3. Figure 7 represents the receiver operating characteristic curve for three different strategies. Supplemental figures 8-10 represent the statistical comparison of AUC between the different models using DeLong test.
Box plot of different quantitative parameters for different feature selectors and classifiers for dataset 3
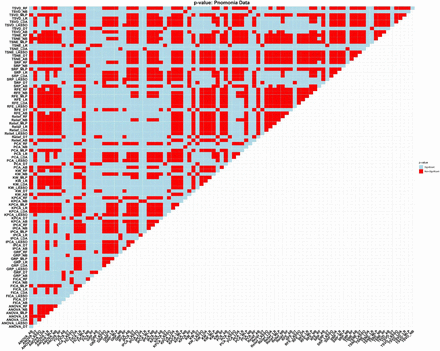
Statistical comparison of AUC values for different model using DeLong test in dataset 1
Statistical comparison of AUC values for different models using DeLong test in dataset 2
Statistical comparison of AUC values for different models using DeLong test in dataset 3
Heatmaps of the cross-combination of feature selectors (12 rows) and classifiers (8 columns) for AUC, sensitivity, specificity, accuracy, PPV, NPV in dataset #3.
ROC curves for dataset #1 (a), dataset #2 (b) and dataset #3 (c). For figure (a, b and c), confidence intervals are also plotted (gray) with 10000 bootstrapping. The confidence intervals are very small due to the large scale of our study. In figure (d), the results from strategies 1-3 are plotted all on one figure to compare the different algorithms.
DISCUSSION
In this work, we implemented multiple machine learning algorithms to detect COVID-19 in a dataset consisting of a large number of patients (COVID-19, non-COVID-19 pneumonia, lung cancer, PE and normal patients). The entire lung was segmented using automated DL algorithms, and subsequently radiomics features were extracted. Features were normalized, redundant features eliminated, and remaining features fed to feature selection algorithms and classifiers. Our models were evaluated using different strategies. We successfully discriminated COVID-19 from other lung diseases and also COVID-19 pneumonia from other pneumonia.
Our findings are consistent with previous studies focusing on the same goals. A study by Fang et al.54 showed that a radiomics model based on CT imaging features could differentiate COVID-19 pneumonia from other types of pneumonia with an area under the ROC curve of 95%. Their results also suggested that radiomics perform better than the clinical-only model. In another study, Tan et al. 55 demonstrated the efficacy of a radiomics-based model in discovering whether a patient has COVID-19 pneumonia or other types of pneumonia by analyzing the non-infectious areas of their CT scan. Their model achieved an AUC as high as 0.95 both in the training and test datasets. Di et al. 37 also studied the diagnostic accuracy of CT-based radiomics in patients and reached a robust model. Their hypergraph model could distinguish between community-acquired pneumonia and COVID-19 disease pneumonia.
Although some studies investigated the power of radiomics in the differentiation of lung abnormalities as mentioned earlier. Several research studies were conducted on the application of other AI methods, such as DL/ML algorithms, and DL + radiomics models. A study by Yousefzadeh et al. 56 investigated the performance of a DL-based model (ai-corona) in the differentiation task between COVID-19 pneumonia, other pneumonia, non-pneumonia, and normal images. Their model reached an AUC as high as 0.997, 0.989, and 0.954 in three different test sets. Harmon et al. 34 trained a DL algorithm on a multi-national dataset of 1,280 patients and evaluated its classification ability using a chest CT dataset of 1,337 patients. They achieved an accuracy of 90.8%. Ni et al. 57 also studied a DL model aiming to locate and detect lung abnormalities, including COVID-19 pneumonia. Their model reached 0.97 in the F1 score and assisted the radiologists in faster detection and diagnosis (p-values<0.0001).
Similar to most radiomics studies of COVID-19, we used chest CT images 37, 38, 58. However, there is ongoing research exploiting other imaging modalities as well. For example, Bae et al. 59 evaluated the prediction ability of radiomics in chest X-rays of 514 patients. They attempted to gain assistance from other methods DL (Radiomics feature Map + DL + clinical features) and achieved AUCs of 0.93 and 0.90 in the prediction of mortality and the need for mechanical ventilators, respectively. In another study by Chandra et al. 60, chest X-rays of 2,088 (training set) and 258 (testing set) patients taken at baseline, were assessed and radiomics analysis performed. They reached an AUC of 0.95 in the test set for identifying normal, suspicious, and COVID-19 groups of patients.
On the use of different lung pathologies in the dataset, several other studies have been conducted. The dataset of Amyar et al. 61 covered healthy patients as well as those with COVID-19, lung cancer, and some other lung pathologies. They achieved an AUC of 0.97 for the classification task. Wang et al. 41 utilized a PARL (prior attention residual learning)-based model for the classification of CT images into COVID-19 pneumonia, other pneumonia, and non-pneumonic images and could achieve a AUC of 0.97 for COVID-19 discrimination. Chen et al. 62 included 422 patients who had COVID-19, other types of pneumonia, tuberculosis, and also normal images in their dataset. Their ResNet model achieved an accuracy of 91.2% for classifying images. Our study also included several pathologies in the lung, including COVID-19, pneumonia of other types (viral and bacterial), lung cancer, and also normal lung images.
Overall, several studies assessed radiomics and DL and DL + Radiomics algorithms for diagnostic and classification purposes with a small size dataset in most cases 36, 63, 64. In this work, we concluded that radiomic features combined with appropriate machine learning algorithm has the potential to enhance our diagnostic ability in the differentiation of COVID-19 pneumonia, other types of pneumonia, and several other lung diseases. We utilized a large-sized dataset consisting of CT images of patients from multiple institutions (multiple scanners/ imaging protocols) from different countries. The large-scale dataset of our study helped the generalizability and reproducibility of our model, which was evaluated using different scenarios.
Our efforts faced a number of limitations, some of which were addressed and considered. For example, motion artefacts are inescapable when patients are undergoing CT scans. Hence, we excluded these patients as they had an overlapping region of pneumonia in their chest image. Second, not all patients were tested for COVID-19 RT-PCR as some of them were included in our study only by their positive CT signs. Thus, we attempted to overcome this limitation using different model evaluation scenarios (e.g. choosing patients with positive RT-PCR as the testing set) in order to reach a reproducible model for further studies. Third, we did not include clinical or laboratory data. However, these data have been shown to be linked with CT image features 36, 65. Finally, image acquisition parameters were undoubtedly distinct in each center and affected radiomic features. Further studies should be performed using harmonized features between different centers.
CONCLUSION
We evaluated multiple machine learning algorithms to detect COVID-19 pneumonia and discriminate it from other lung diseases using radiomics features of the entire lung using a very large heterogeneous dataset. We successfully discriminated COVID-19 from other lung diseases and also COVID-19 from other community-acquired pneumonia. Radiomic features of whole lung and machine learning algorithms combination could effectively detect COVID-19 cases to boost clinical diagnosis without the need for other diagnostic tests.
Data and code availability
Radiomics features and code will be available upon request.
Data Availability
All data produced in the present work are contained in the manuscript
https://www.cancerimagingarchive.net/collections/
https://mosmed.ai/datasets/covid19_1110
http://ictcf.biocuckoo.cn/HUST-19.php
https://www.rsna.org/education/ai-resources-and-training/ai-image-challenge
Conflict of Interest statement
The authors declare that they have no conflict of interest.
Acknowledgements
This work was supported by the Swiss National Science Foundation under grant SNRF 320030_176052.
Footnotes
First Author: Isaac Shiri, MSc, Geneva University Hospital, Division of Nuclear Medicine and Molecular Imaging, CH-1211 Geneva, Switzerland, Email: Isaac.shirilord{at}unige.ch


