
Abstract
COVID-19 mortality increases dramatically with age and is also substantially higher among Black, Indigenous, and People of Color (BIPOC) populations in the United States. These two facts can have conflicting implications because BIPOC populations are younger than white populations. In analyses of California and Minnesota--demographically divergent states--we show that COVID vaccination schedules based solely on age benefit the older white populations at the expense of younger BIPOC populations with higher risk of death from COVID-19. We find that strategies that prioritize high-risk geographic areas for vaccination at all ages better target mortality risk than age-based strategies alone, although they do not always perform as well as direct prioritization of high-risk racial/ethnic groups. Vaccination schemas directly implicate equitability of access, both domestically and globally.
Introduction
Distributing COVID-19 vaccines represents one of the most significant public health challenge in a century, both in the United States (1) and globally (2). US national guidelines issued by the CDC in December 2020 (3) were consistent with the evidence that the risk of death from COVID-19 increases starkly with age (4). However, the guidelines ignored evidence that the risk of exposure to and subsequent infection from SARS-CoV-2, the causative agent of COVID-19, is substantially higher for Black, Indigenous, and People of Color (BIPOC) (5). As a result, vaccine prioritization based solely on age may have exacerbated racial/ethnic inequities in COVID-19 burden because BIPOC populations are generally younger than the white population, more likely to be infected at younger ages, and at higher risk of dying from COVID-19 at all ages (5–7).
In contrast, prioritizations that consider other dimensions of risk alongside age may more effectively target those at greatest risk of COVID-19 death while reducing racial and ethnic inequities. Yet not all targeted approaches are feasible in practice. While BIPOC populations have notably higher COVID-19 age-specific mortality, distributing vaccines based on race and ethnicity may not be legally viable (8) or politically tenable (9–11) in the United States. Further, a race-based approach may be perceived as discriminatory, given long-standing medical racism (8, 12). Instead, geographic targeting, using indices of health or COVID-19 mortality, may be more practical, more resistant to legal challenges, and still more equitable than strategies based on age alone (13). Here, we explore the mortality and equity implications of alternative vaccine eligibility schemas based on age alone, age and race, and age and geography.
We analyze four paired sets of alternative vaccination prioritization strategies and evaluate their sociodemographic and health equity implications. The baseline strategy for all comparisons is sequential age-based vaccination that starts with the oldest people and progressively extends eligibility for younger groups; in three of our four comparisons, age-based vaccination proceeds in 5-year age units. The comparison schemas employ race/ethnicity or geography alongside age to determine eligibility. To reflect the COVID-19 mortality risk of the general population, we excluded those already prioritized in the US Phase 1A vaccine rollout (i.e., long-term care residents and health care workers). We assumed policymakers and health departments aim to prioritize vaccinations for the groups with highest COVID-19 mortality risk (14) (rather than with highest risk of transmission (15, 16)), in the context of limited vaccine supply. Other COVID-19 vaccine modeling studies consider which age groups to prioritize (17, 18) and various trade-offs between age, comorbidities, and occupations (14, 16, 19–21). Here, we compare strategies for vaccinating the general population based on age, race and ethnicity, and alternative measures of geographic risk.
We evaluate eligibility schemas by how well they match vaccine eligibility to the maximum COVID-19 mortality risk, using the observed COVID-19 mortality in 2020 (i.e., prior to mass vaccine rollout) as a proxy measure of risk. Our underlying assumptions are that vaccinating individuals prevents some deaths from COVID-19 that would otherwise occur in the context of partial community vaccination (22, 23) and that vaccine supply is smaller than vaccine demand, necessitating choices about whom to prioritize. Given fixed vaccine supply, matching eligibility to the maximum mortality risk should avert the largest number of deaths by directing vaccines to the people at highest risk (14). In addition, maximizing the mortality risk of the eligible also improves equity in the sense that it does not prioritize lower-risk populations above higher-risk populations. We consider an eligibility schema to be inequitable when lower-risk white people are eligible before higher-risk BIPOC people, and when lower-risk socioeconomically advantaged people are eligible before higher-risk socioeconomically deprived people. Thus, in contrast to debates about “efficiency vs. equity,”(24, 25) our analyses examine whether widely used eligibility rules were simultaneously less equitable and less effective than feasible alternatives.
In analyses, we used individual-level death certificate data from California and Minnesota. These two states are socioeconomically and demographically distinct. They experienced divergent pandemic trajectories and, according to a CDC analysis, differential success at key junctures in vaccinating their most vulnerable residents (26). We can thus compare the health equity implications of the four sets of vaccine prioritization strategies in two different populations, showing how this framework can be flexibly applied across diverse settings.
Our results serve three distinct goals. First, they can be used as a retrospective assessment of decisions made by US states throughout spring 2021. Second, they remain directly relevant for future shortages associated with COVID-19 vaccine policy (e.g., forthcoming booster shots against variants), as well as scarce resource allocation decision-making generally in future disasters, including future pandemics. Third, they help provide a generalizable framework for evaluating vaccine eligibility and equity requiring only data on either areal measures of deprivation or historic COVID-19 mortality. For example, this framework could be used in other settings where vaccine scarcity remains an issue, such as low- or middle-income countries that are not expected to have adequate vaccine supply until at least 2022 (27), or in settings where disadvantaged populations are younger on average than advantaged populations.
Results
Age-based prioritization alone results in substantial racial and ethnic disparities in averted deaths
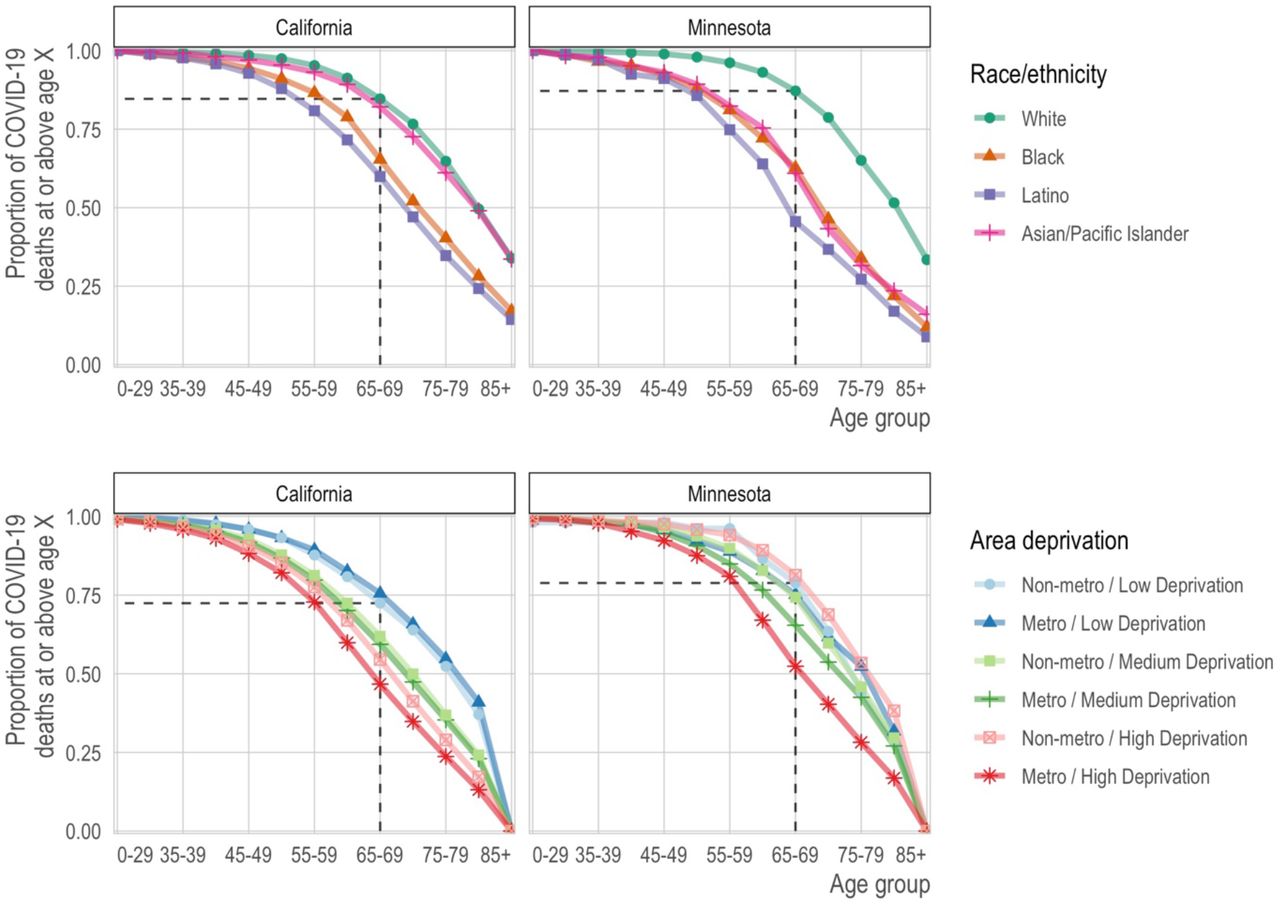
We found that sequential age-based prioritization alone would result in substantial racial/ethnic disparities in deaths averted. For example, vaccinating all people aged 75+ would have prevented nearly two-thirds of white COVID-19 deaths (CA: 65%; MN: 65%). Yet, for California and Minnesota respectively, this age-based prioritization alone would have prevented only 40% and 33% of Black COVID-19 deaths, 35% and 27% of Latino COVID-19 deaths, and 61% and 32% of Asian and Asian-American COVID-19 deaths (Figure 1, top row; Native American populations were not analyzed separately due to their small size). These stark differences reflect both that the white population is substantially older than most BIPOC populations and that COVID-19 mortality reaches high levels at substantially younger ages in BIPOC populations (Figure 2). Age-based prioritization therefore reduces much more of the total risk in white populations compared to BIPOC populations.

Each line corresponds to the proportion of deaths (y-axis) at or above each successive age group (x-axis). In the top row, each line corresponds to a racial/ethnic category. For reference, we show the proportion of deaths among non-Hispanic whites ages 65 and older. For nearly all other racial/ethnic groups, the proportion of deaths at age 65 is lower. Correspondingly, for nearly all other racial/ethnic groups, the same proportion of deaths occurs at substantially lower ages. In the bottom row, each line represents a metropolitan area and deprivation level. Darker shades are metropolitan while lighter shades are non-metropolitan. Blue is low deprivation, green is medium deprivation, and red is high deprivation. The reference lines show the proportion of deaths at ages 65 and above among non-metropolitan, low deprivation areas.

We show the proportion of COVID-19 deaths (y-axis) in each age bin (x-axis) by race/ethnicity (rows) for California (left column) and Minnesota (right column). The grey bars in the background of each panel show the age distribution of deaths in the non-Hispanic white population for comparison.
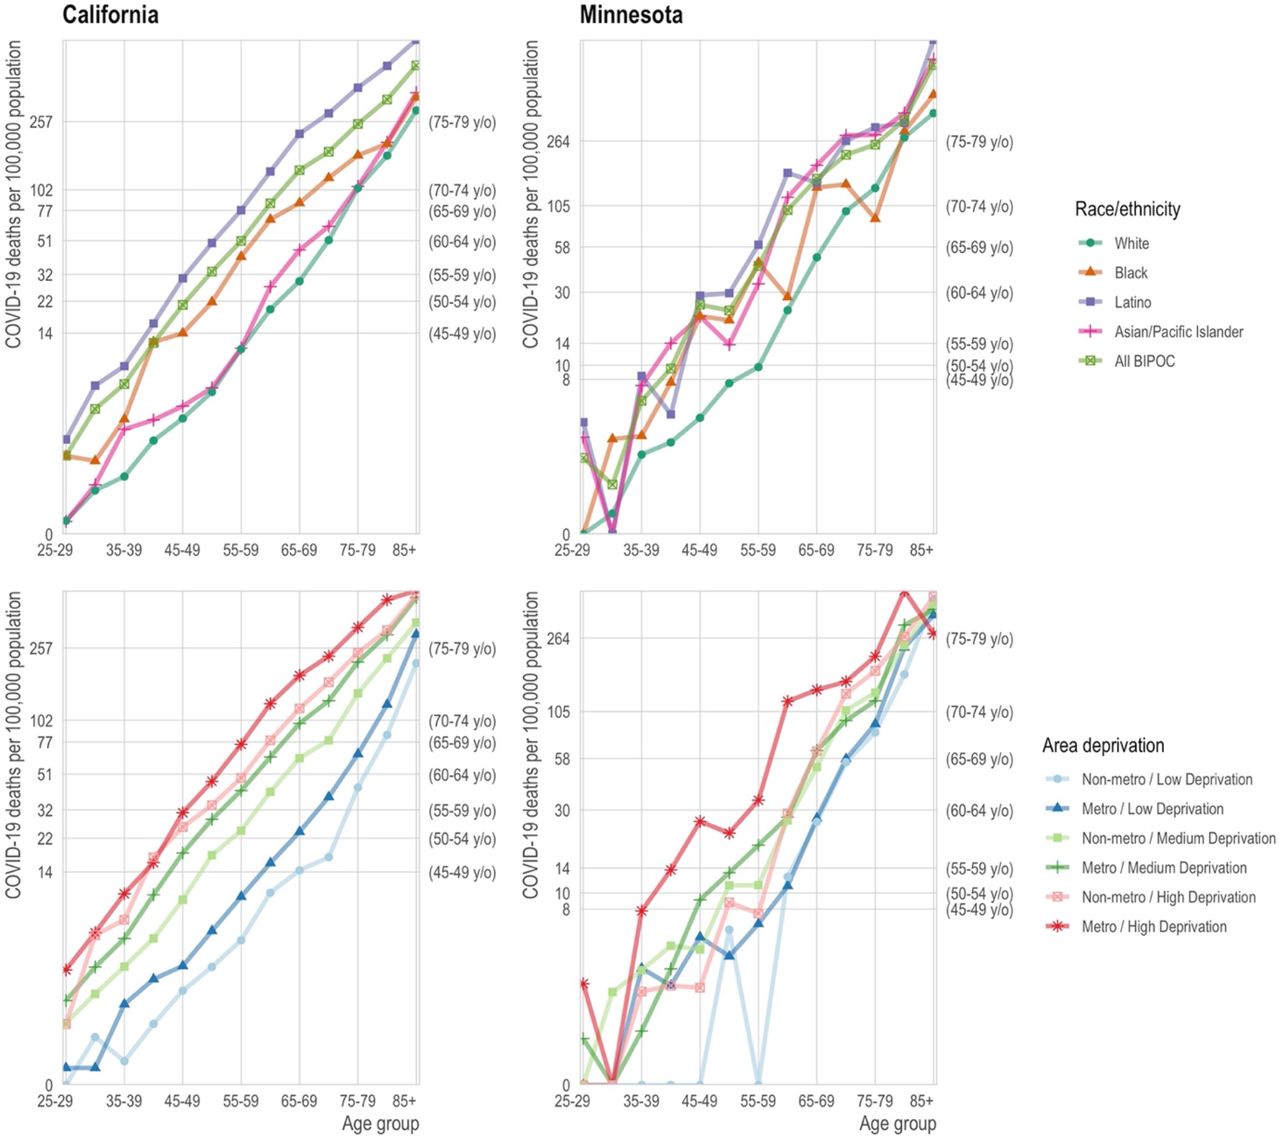
A consequence of this multidimensional COVID-19 mortality risk is that structurally disadvantaged groups often have mortality that exceeds the state aggregate rate for age groups that are 10 or even 15 years older. For example, if mortality at ages 65-69 is sufficiently high to merit vaccine priority, the same would be true for (in California) Latinos older than 55 or (in Minnesota) BIPOC as a whole who are older than 50, because their COVID-19 mortality exceeds their state’s aggregate COVID mortality at ages 65-69 (Figure 3, top row).
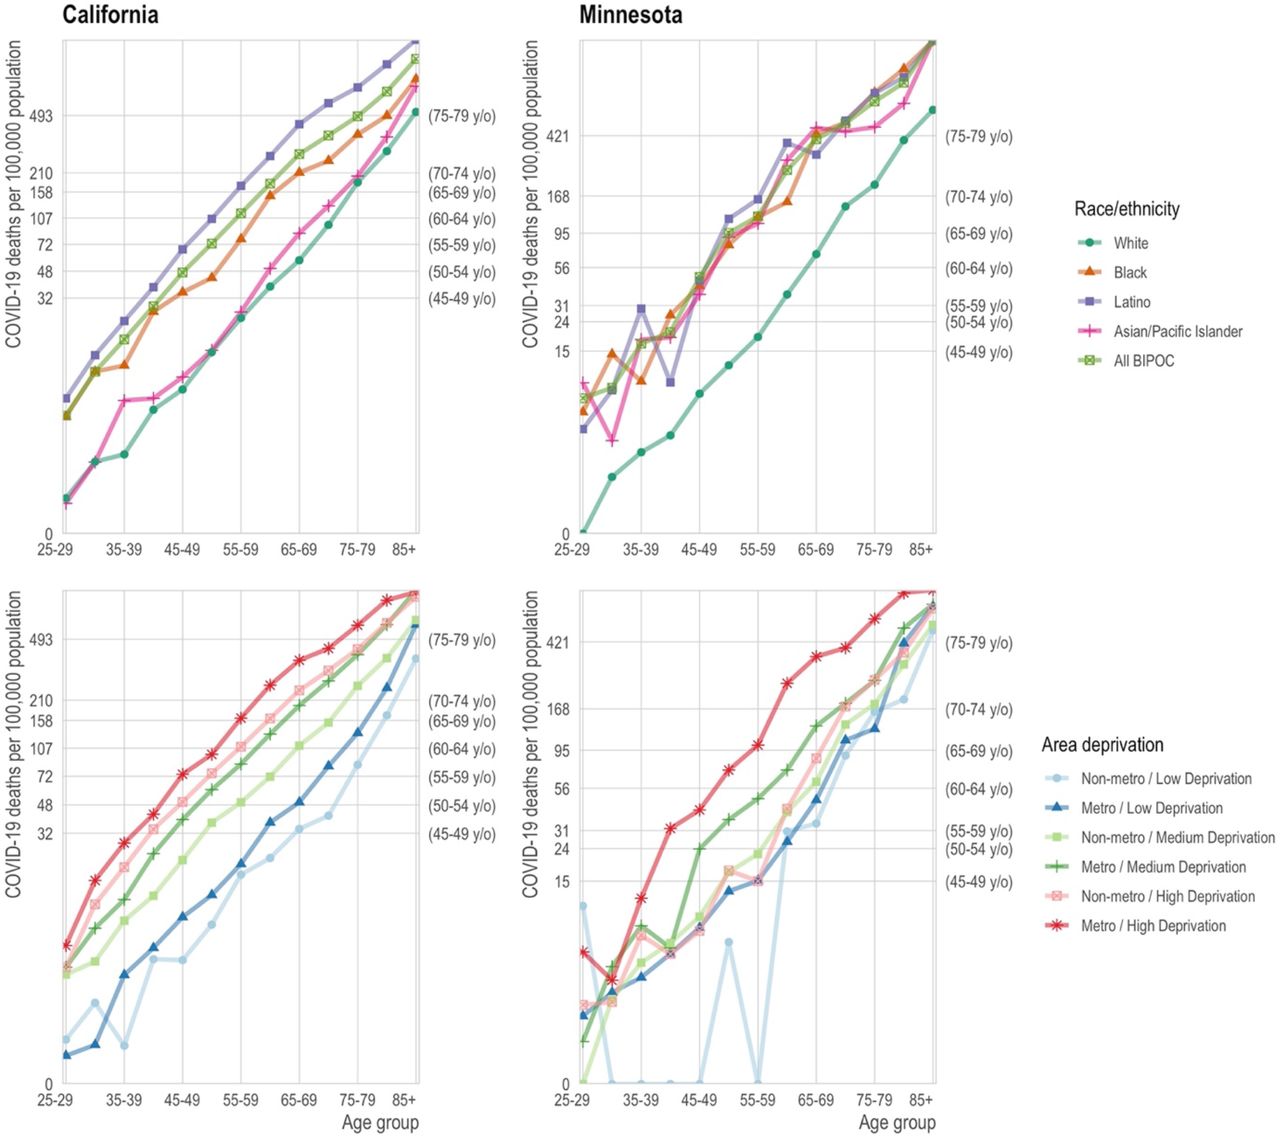
Top row: The mortality rate (y-axis) by age (x-axis) varies by race/ethnicity (colors) with the non-Hispanic white population (blue) experiencing substantially lower mortality at any age relative to the BIPOC (red) and Latino (green) populations. Age-based eligibility rules ignore this variation. The secondary y-axis on the right shows the age group corresponding to the state-wide age-specific mortality rate. For example, in California, the age-specific mortality rate for non-Hispanic white 65-69 year olds is 57 per 100,000, close to the state average for 50-59 year olds (secondary y-axis) and to 40-49 year old BIPOC and Latinos. Bottom row: The mortality rate (y-axis) by age (x-axis) varies by area deprivation index (ADI; colors). We divide areas into “Metro” (lighter shades) and “Non-metro” (darker shades). We define “Metro” as the seven counties in the Twin Cities metropolitan area in Minnesota and Los Angeles, San Diego, San Francisco, Santa Clara, and Fresno counties in California. Non-metro areas include all census tracts outside of the metro category. Low deprivation is defined as an area deprivation index of 1-3, medium deprivation is 3.01-7.49, and high deprivation is 7.5-10.
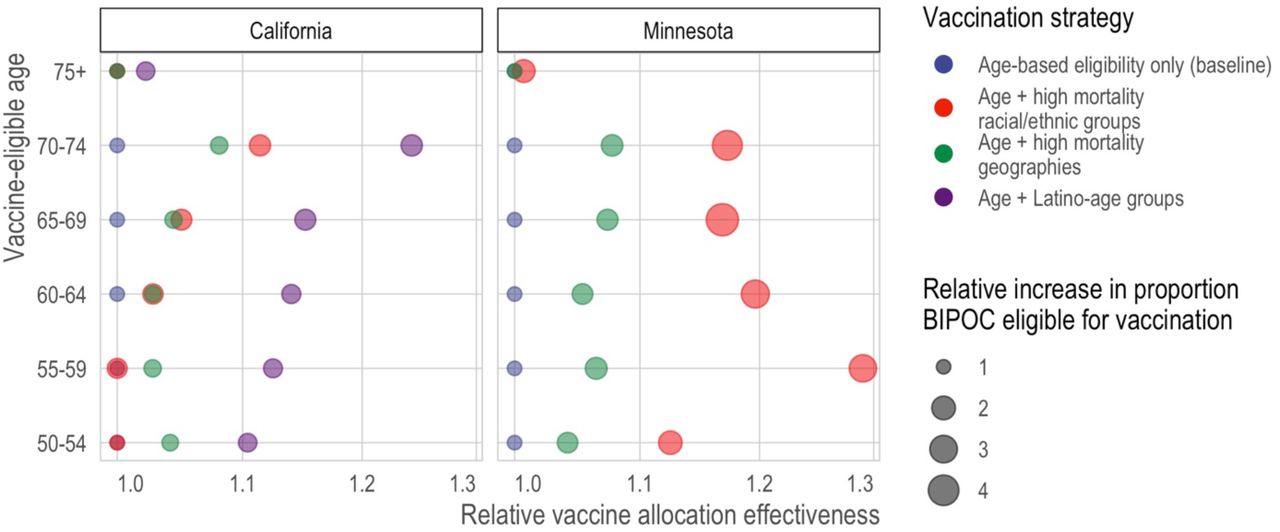
In the first set of paired, alternative vaccination strategies, we compare sequential age-based vaccination (in five-year age groups) to vaccination schedules that combines the same age thresholds with race/ethnicity-age groups whose COVID-19 mortality exceeds that of the aggregate COVID mortality for the youngest eligible age group (e.g., ages 65-69 vs. ages 65-69 plus BIPOC ages 50-64 in Minnesota). We found that prioritizing vaccination for race-age groups with the highest risk would better target vaccination to high-risk individuals (Figure 4, Figure S1). Yet the legal, political, and practical barriers to such race-based prioritization motivate the research questions addressed in the remaining three comparison sets, which consider to what extent geographic prioritization can achieve similar ends of targeting high-risk individuals and improving racial equity in vaccination, compared to age-based rules that, in practice, prioritize white populations.

Here, we compare the predicted mortality rate from COVID-19 (x-axis) of different types of vaccine allocation strategies (color) based on age (y-axis). Specifically, we compare age alone (blue), age in combination with racial/ethnic groups (red), age in combination with high mortality locations (green), and for California—the larger, more diverse state—age in combination with the highest mortality racial/ethnic group, which is Latinos (purple). In all cases and across all ages, incorporating additional, younger but higher risk groups improves the efficiency of the rollout and reduces racial/ethnic inequities. In California, targeting high mortality geographies (green) achieves similar efficiency as prioritizing disadvantaged racial/ethnic groups as a whole (red). In Minnesota, incorporating high mortality racial/ethnic groups always outperforms incorporating high mortality geographies; however, high mortality geography still improves the alignment of vaccine allocation with COVID-19 mortality risk.
Geographic prioritization based on area-level deprivation improves equity and averts more deaths
In the second set of alternative vaccination strategies, we compare sequential age-based vaccination to vaccination schedules that also prioritize geography-age groups whose COVID mortality exceeds that of the aggregate for the youngest eligible age group. While age-based prioritization for the 75+ age group alone would have prevented nearly two-thirds of COVID-19 deaths in advantaged neighborhoods (CA: 65%; MN: 62%), it would have prevented only 35% and 40% of COVID-19 deaths in deprived neighborhoods in major metropolitan areas in California and Minnesota, respectively (Figure 1, bottom row; Figure 3, bottom row).
Compared to age-based prioritization alone, prioritizing by area-level deprivation can better target high-risk groups (Figure 4, Table S1). In California, geographic prioritization targets mortality about as effectively as prioritizing BIPOC as a whole, although not as well as prioritizing Latinos (the highest-risk racial group) specifically; in Minnesota, geographic prioritization is less effective than prioritizing BIPOC populations. Geographic prioritization also increases racial equity in Minnesota but does so only very modestly in California.
Universal adult vaccination in the highest-mortality neighborhoods can improve equity and avert more deaths
In the third comparison set, an alternative geographic prioritization strategy would directly identify Census tracts with historically higher COVID-19 mortality rather than proxying risk by area deprivation and major metropolitan status. This strategy mirrors one adopted by some states (28). Compared to statewide sequential age-based prioritization alone, adding vaccination for all adults (ages 20+) in the highest mortality tracts would generally improve the targeting of high-mortality groups in contexts where it also improves vaccine uptake among older people in the high-mortality tracts, but not in contexts where vaccinating the high-mortality tracts adds vaccination only for the youngest (not among those who were already eligible due to their age) (Figure 5; see details in Materials and Methods). Prioritizing high-mortality tracts would also dramatically increase vaccine access for BIPOC communities (Figure 6). These results are qualitatively robust to a sensitivity analysis that assumes that a large portion of “high-mortality tracts” included unidentified long-term care facilities whose deaths should be excluded from the analysis (Figure S5; see details in Materials and Methods).

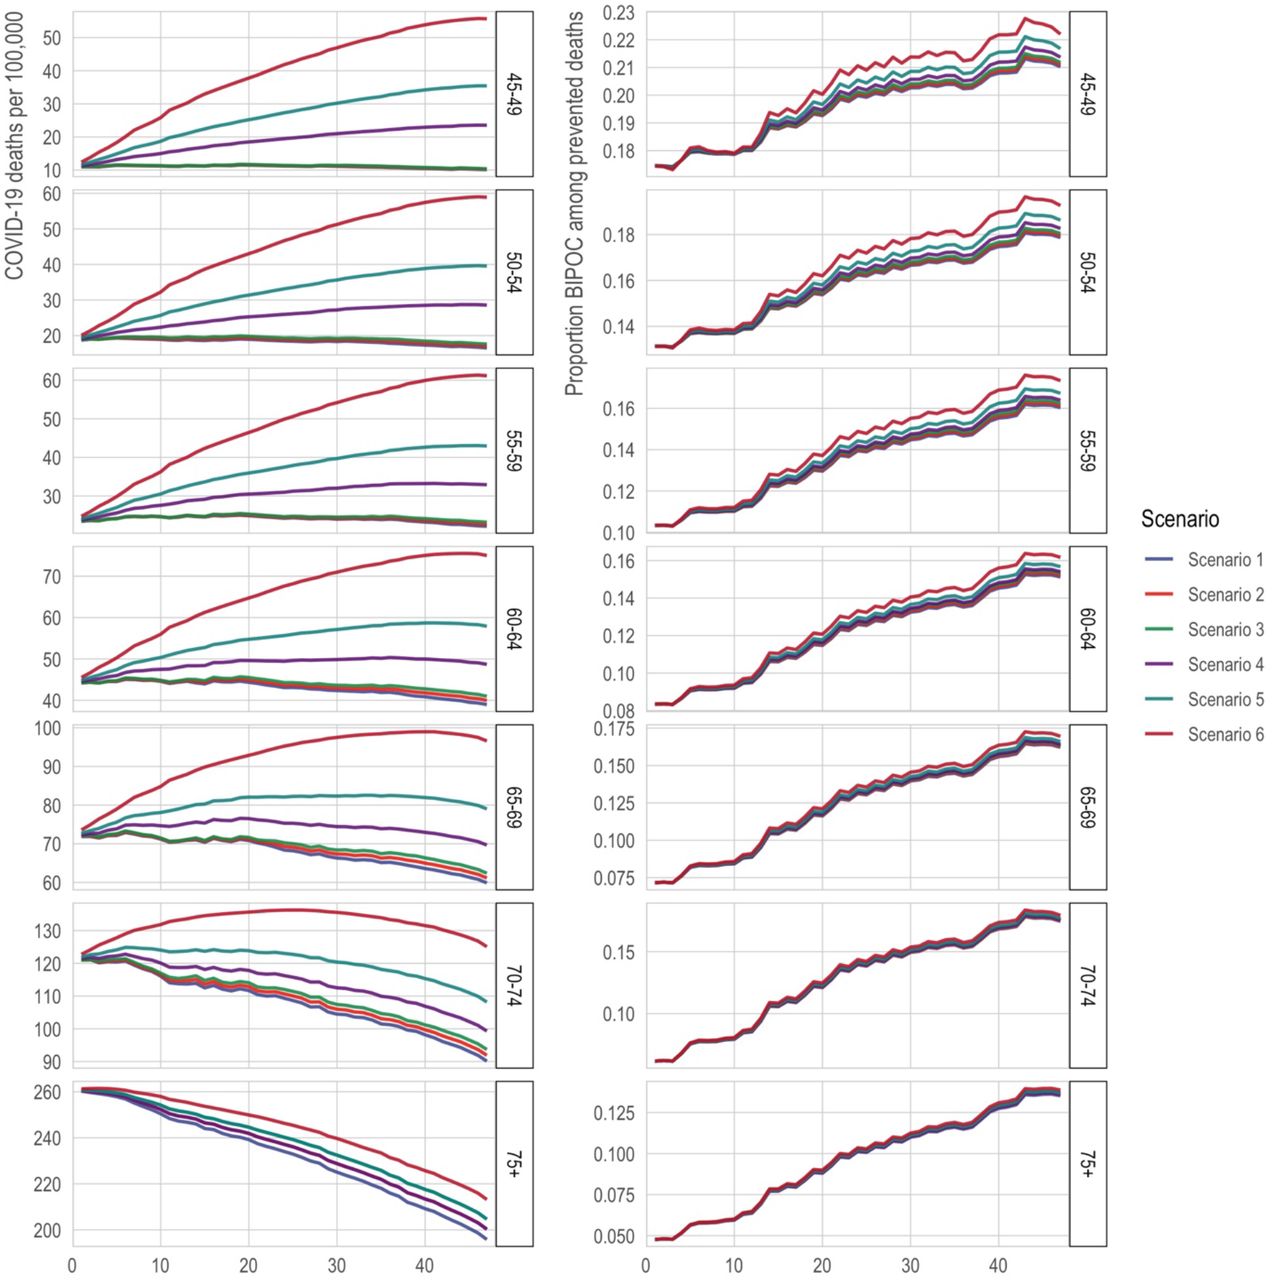
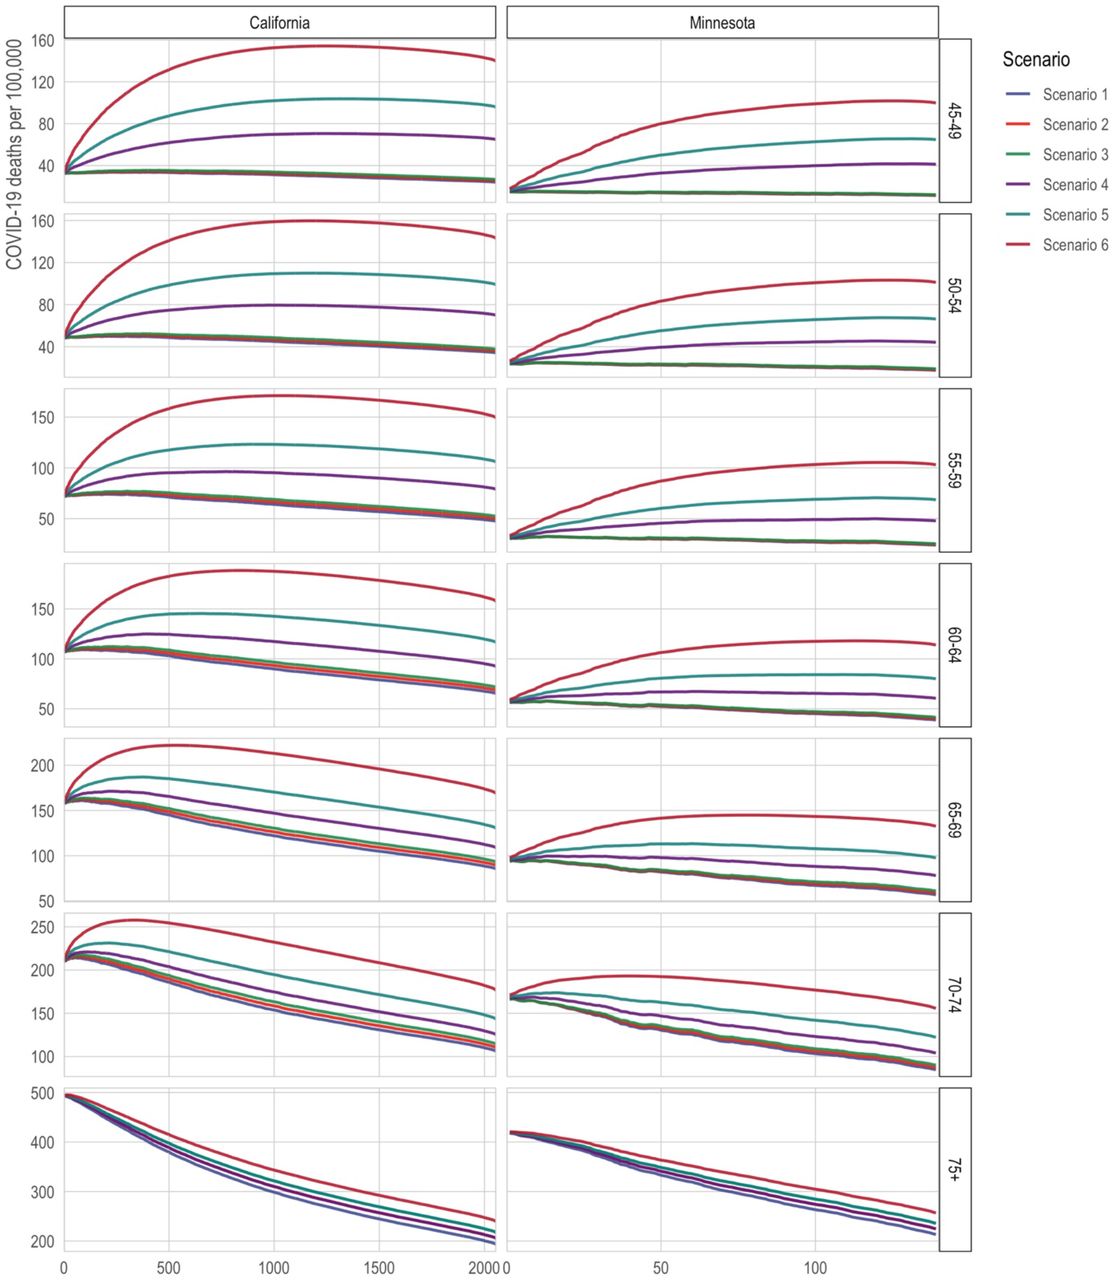
The x-axis is the number of tracts in which all adults (ages 20+) are prioritized for vaccination. The y-axis is 2020 COVID-19 deaths per 100,000; a higher death rate among the eligible indicates better targeting of vaccines toward high-risk individuals. The lines correspond to alternative scenarios as described in the text of the Materials and Methods.

The x-axis is the number of tracts in which all adults (ages 20+) are prioritized for vaccination. The y-axis is the proportion of the state’s eligible population that is non-white. The lines correspond to alternative scenarios as described in the text of the Materials and Methods.
For illustration, in California, if prioritizing tracts does not increase vaccine uptake among the oldest tract residents (who would already be eligible by age) but only results in vaccinating younger tract residents, then vaccinating the 500 highest-mortality tracts would decrease the mortality averted by 8% (from 158 to 145 deaths per 100,000) compared to vaccinating the 65-69-year-olds alone. The inflection point, where prioritizing all adults in a tract is neutral, occurs at around 220 tracts under the assumption of no improved older-age vaccination; under this assumption, prioritizing fewer than about 220 tracts improves mortality targeting and prioritizing more than about 220 tracts worsens it. However, if prioritizing tracts increases vaccine uptake by 50% among the oldest, already-eligible residents of those tracts, then vaccinating the 500 highest-mortality tracts would increase the averted mortality by 17% (from 158 to 185 deaths per 100,000).
Universally lowering the age of eligibility averts fewer deaths and is less equitable than selectively lowering eligibility age
In the fourth comparison, we consider alternative strategies aimed at increasing racial equity in vaccination: substantially lowering age thresholds across the board, as some states have adopted with this motivation (29), versus selectively lowering age thresholds for high-mortality geographies. We compare these strategies at two critical junctures representing “early” and “late” vaccine rollout points: when vaccinating the 70-74 age group and when vaccinating the 55-59 age group (Figure 7; see details in Materials and Methods). Compared with universally lowing the age threshold, the benefits of selectively lowering it, for maximizing the extent to which eligibility aligns with those at highest mortality risk, are substantial: for the older ages, selective lowering better targets the aggregate mortality risk of the eligible by 53% (222 vs. 145 deaths per 100,000) in California, and 88% (179 vs. 95 deaths per 100,000) in Minnesota; for the younger ages, selective lowering better targets mortality risk among the eligible by 48% (73 vs. 49 deaths per 100,000) in California, and 42% (33 vs. 23 deaths per 100,000) in Minnesota. However, in California, selective lowering of the age threshold does not meaningfully increase the proportion of vaccine-eligible people who are BIPOC for either early or late rollout. For Minnesota, it increases the proportion of vaccine-eligible who are BIPOC modestly (11% vs. 8% for the older ages; 18% vs. 14% for the younger ages).

Here, we compare the targeted mortality rate from COVID-19 (x-axis) of different types of vaccine allocation strategies (color) under alternative assumptions about vaccine uptake (y-axis). Specifically, we compare strategies that universally reduce the age at eligibility (blue) to strategies that retain a higher age at eligibility but drop to a much younger age for high-risk geographic units, defined by Area Deprivation Index and major metropolitan status. In each panel, the first line assumes that vaccine uptake is random among the eligible; the second assumes that, conditional on eligibility, each successively younger 5-year age group increases uptake by 10% if the age threshold is high and by 50% if the age threshold is low; and the third line assumes that, conditional on eligibility, whites increase uptake by 10% if the age threshold is high and 50% if the age threshold is low. The second and third lines indicate that a larger eligible group relative to vaccine supply may exacerbate selective uptake of lower-risk eligible people.
An additional shortcoming of broadly lowering age thresholds is obscured by the assumption of random uptake among the eligible: to the extent that the size of the eligible group exceeds the available vaccine supply, broadly lowering the age threshold can exacerbate the differences between groups in vaccine uptake (“selective uptake”), especially of lower-risk individuals. To capture this phenomenon, we compare the mortality risk among the vaccinated, and proportion BIPOC among the vaccinated, under varying degrees of selective uptake among whites and selective uptake among younger eligible people. We find that, to the extent that creating a larger eligible population might exacerbate selective uptake by badly outstripping vaccine supply (e.g., white people being 25% more likely than BIPOC to access vaccines when eligible under broad eligibility—a number in line with observed rates (30)—vs. only a hypothetical 10% under more restricted eligibility), geographic targeting will be even more effective at targeting high-risk groups and will also produce more equitable vaccination (Figure 8). At these relatively low rates of selective uptake, the difference made by selective uptake is small relative to the differences made by the vaccination schedules even assuming random uptake. Larger rates of selective uptake produce more dramatic divergences between the schedules (Figure S6).
Discussion
Strict age-based vaccination strategies for COVID-19 disproportionately benefit the white population. For example, in both California and Minnesota, after excluding long-term care populations and health care workers, around two-thirds of white COVID-19 deaths, but well below half of Black and Latino deaths, occurred above age 75. This prioritization might be justifiable if older populations were at higher risk than younger populations, irrespective of race, much as prioritizing residents of long-term care facilities in Phase 1a resulted in prioritizing a largely white population at overwhelming risk (31). However, we show that this justification does not apply to age-based vaccination after Phase 1a. For example, when state vaccination eligibility was extended from 75+ to 65+, the mortality rate among the newly eligible was lower than the mortality rate among BIPOC groups that are 10 or 15 years younger yet still ineligible for vaccination. These age-ineligible, yet high-risk, BIPOC groups had to wait up to three months longer to be eligible for vaccination (32)—and, by the time they were eligible, may have been competing for access with the general public. These results underscore the implications of prioritizing vaccine allocation based on the 65+ age threshold, as many states implemented in January 2021. Inequities driven by eligibility rules based on age alone may partly account for continued disparities, such as, in Minnesota, the fact that at the time of writing a majority of the white population but only one-third of the Black and Latino populations are fully vaccinated (33), a disparity also occurring nation-wide (34).
Compared to a vaccine eligibility strategy based on age alone, a strategy that combines geographic location based on socioeconomic characteristics with age-based eligibility--such as by extending eligibility to the geographic and age groups with higher mortality than the youngest age-eligible group--better aligns with risk of COVID-19 mortality. The total improvements in risk coverage from this age-geography prioritization are fairly modest (improving the targeting of high-mortality groups by 3-9% across age groups and states) because the populations added through geographic prioritization are small relative to the five-year age groups in each state, so they have only a relatively small effect on aggregate risk among the eligible. However, the small size of the populations that would additionally become eligible also implies that geographic prioritization has a low direct opportunity cost, as only a small number of vaccines need to be allocated to high-risk geographies to achieve the equity gains of targeting.
Our results can reframe some debates about “efficiency vs. equity.” In the context of vaccine scarcity, efforts to save the most lives possible and to save lives equitably can be at odds (13, 35). Yet our results suggest that more equitable approaches can also be more effective at matching vaccines to the people at greatest risk, compared to arguably simpler, less equitable approaches. In particular, our results suggest that, in some cases, directing vaccination efforts at small, high-risk geographic areas without regard to age can improve on efforts to target older ages throughout the state, especially when such geographically targeted efforts improve vaccine uptake among older residents of high-risk areas. These results suggest that states should consider targeting broad swaths of the population (e.g., all adults) in highly specific geographic contexts when--and, from the perspective of directly reducing mortality, perhaps only when--this targeting allows for tactics that allow older residents to be more effectively reached. Such tactics could include home visits (36, 37), walk-in pop-up clinics (38), assigning appointment slots to all residents (39), and other forms of direct outreach that prioritize disadvantaged neighborhoods (40). Such approaches may be especially likely to succeed in increasing uptake among the highest-risk when high-risk populations are vaccine-hesitant but might be more likely to adopt vaccination as others in their networks become vaccinated, and to the extent that such approaches increase framing of vaccination as the local default (39). Such direct outreach might be an effective strategy to vaccinate very high-risk populations quickly.
Moreover, broadly prioritizing all adults in the highest-mortality neighborhoods may be even more effective than the results here suggest. To the extent that groups with disproportionately high mortality also have disproportionate incidence of infection (41–44), the mortality-based results here may understate the benefits of better targeting at-risk groups. Because people live in segregated communities, people at heightened risk of COVID-19 death are likely to interact with others at elevated risk. Thus, prioritizing vaccination more effectively by neighborhood can potentially have multiplier effects as vaccinating relatively old residents reduces mortality directly and vaccinating younger residents reduces transmission to high-risk older people (45–48). Because the analyses in this article do not model transmission dynamics, they do not provide a comprehensive answer to the optimal vaccine eligibility schedule. Instead, they show that, even in the setting most favorable to purely age-based eligibility (i.e., a setting that considers only directly-averted deaths), such eligibility schemas are inferior to those that incorporate multiple dimensions of demographic risk.
Our results show that some strategies designed to increase equity are unlikely to do so, and may result in a poor match of vaccine eligibility to risk. In the period between Phase 1a and universal adult eligibility, several states extended age eligibility to age 50+ (49) and even to all adults before universal eligibility was widespread (50, 51), with reductions in the age at eligibility sometimes driven by a recognition that BIPOC people die of COVID-19 at younger ages on average (52). However, large universal drops in the age threshold for eligibility have the consequence of targeting risk quite poorly. We show that, compared to such a strategy, an alternative strategy that incorporates only high-risk geographies at younger ages does substantially better at prioritizing people with higher mortality risk. This is especially true in the context of disproportionate vaccine uptake by the advantaged among the eligible. However, our vaccine uptake simulation results suggest that small to moderate rates of selective uptake make relatively little difference in the extent to which each vaccination strategy succeeds in prioritizing high risk people, compared to the large difference made by the choice of eligibility schema itself.
Better-optimized vaccination strategies should consider local demographics, intersectional risks, and both large-scale (e.g., large metro areas) and small-scale (e.g., Census tract disadvantage) geographic stratification. For example, in both states, disadvantaged metropolitan Census tracts had distinctly higher COVID-19 mortality than all other geographies. Yet we found that geographic risk was more stratified by area deprivation index in California and more stratified by major Metro status in Minnesota, implying that a one-size fits all approach may be sub-optimal given vast demographic and geographic heterogeneity across states. Our results underscore the need for each state to individually consider what metrics would be most impactful for vaccine prioritization that both simultaneously maximizes the reduction in deaths due to COVID-19 while also ensuring a fair and equitable approach. This lesson—that equitable and effective vaccination approaches require looking flexibly at multiple dimensions of risk in local context—should also extend to countries beyond the United States as they undertake their own vaccination campaigns amid scarcity (53).
This study has several limitations. One set of limitations concerns the data. First, the calculations reported in this analysis are based on mortality data obtained from January to December 2020. Therefore, to the extent that mortality patterns by age, race/ethnicity, and place have changed over the course of the pandemic (e.g., responses to selective shutdowns or social distancing patterns), our results may not reflect future deaths averted by vaccination. To address this, we confirmed that our main results persist when mortality risk is estimated from data for November-December 2020 only. Second, we were only able to evaluate strategies that prioritize based on information included on death certificates, which typically excludes risk factors such as some comorbidities, income, healthcare access, and immigration status. Third, in some of our analyses of racial equity, we grouped all Black, Indigenous, and People of Color (BIPOC) into a single racial/ethnic category. Collapsing across diverse racial/ethnic and Indigenous populations poses challenges with respect to generalizability and implies a universal lived experience which does not exist (54, 55). However, combining groups enabled us to make direct comparisons between states (including a smaller, predominantly white state, Minnesota). Fourth, our data depend on the quality of COVID-19 cause assignments and racial categorization assignments in death certificates (56, 57).
A second set of limitations concerns the scope of the results. First, our study focused on vaccine eligibility; yet access given eligibility may be as important as eligibility per se in determining equitability in COVID-19 vaccination. We incorporated analyses of how eligibility decisions might interact with differential access to vaccination via two kinds of selective uptake simulations: (1) greater vaccine uptake among white (or younger) eligible people than BIPOC (or older) eligible people, and (2) highly localized geographic prioritization increases uptake among residents of those geographies who would have been eligible regardless. In both cases, we explored how selective uptake could exacerbate or ameliorate the consequences of eligibility rules. In general, however, our results illuminate only one of several mechanisms of inequitable vaccine access: the portion directly attributable to decisions about who is eligible to be vaccinated. Moreover, inequity in vaccination is only one route to inequity in COVID-19 outcomes that also stems from differences in transmission (41–44) and vulnerability (58). Second, some strategies are easier to implement than others. Geographic prioritization strategies require states to leverage data to determine where to target, whether broad indexes of risk like the area deprivation index or direct measures of where deaths have been concentrated in the state. Strategies that prioritize active outreach in small, high-risk areas require coordination and other resources and, to be effective, staff with linguistic competence and community connections that health departments may lack. Finally, vaccination strategies that are not widely perceived as legitimate can undermine social solidarity and increase efforts to flout the rules (59), and we did not evaluate whether geographic prioritization is likely to be widely perceived—or can be made to be widely perceived—as fair.
A central argument for age-based vaccination schedules is that they may minimize administrative burdens that may undermine more targeted schedules by preventing the eligible people who are at highest risk from accessing the vaccine. For example, targeting comorbidities may inadvertently exclude people without primary care doctors (60). Geographic prioritization strategies, like those explored here, may chart a middle path between, on the one hand, broad eligibility criteria that minimize administrative burden and, on the other, highly-targeted criteria that aim to direct vaccines at groups with the highest mortality risk. Geographic prioritization is not free of administrative burden, particularly for those without secure housing, who need to be reached with alternative strategies. And in particular, since few individuals know their Census tract, the prioritization strategies considered here would require individuals to check the eligibility of their addresses (e.g., through an online system or over the phone) or to be proactively contacted by state health systems; merely placing vaccination sites in high-risk neighborhoods does little to ensure that residents of those neighborhoods will be the people vaccinated (61). On the other hand, tract boundaries typically conform well to local contextual knowledge of neighborhood boundaries (62, 63), suggesting that eligibility can be defined in meaningful terms for the public by communicating street boundaries. The feasibility of tract-based eligibility is an important consideration since the benefits shown here for targeting Census tracts may not extend to geographic units that are larger and not defined with regard to meaningful social boundaries, such as the zip code targeting employed in California’s eligibility rules (64, 65). Our results suggest that, in the U.S. vaccine rollout, discussion should have turned earlier to how best to make prioritization feasible at highly localized geographic levels.
In many spheres of service provision, there are strong arguments in favor of universalist systems that minimize the burdens of demonstrating eligibility (66). Yet the vaccine rollout is a unique context in which, during the crucial early months in the United States—and likely for some time to come in most of the world—the supply has been inflexibly scarce, making a truly universal approach untenable. Given this, strategies that prioritize residents of the neighborhoods where risk of dying of COVID-19 has been heavily concentrated could protect people whom age-based strategies exclude, in spite of their heightened risk of death.
Materials and Methods
Mortality data
We used death certificate data provided by the California and Minnesota Departments of Public Health to identify all deaths due to COVID-19 from January 1, 2020 to December 31, 2020 (California N=33,311; Minnesota N=5,803). We excluded deaths occurring in 2021 to limit distortion from vaccinations, since our goal is to estimate the mortality risk of various groups were they unvaccinated. Deaths are considered to be COVID-19 deaths if any mention of ICD code U07.1 appears on the death certificate, whether as the underlying or as a contributing cause. To reflect the underlying COVID-19 mortality risk that would be observed in the general population, we excluded decedents who would be eligible for Phase 1A of the vaccine. Specifically, we removed COVID-19 deaths that occurred in long-term care facilities or nursing home residents (N = 4,959 for California; N = 3,070 for Minnesota) and, in California, deaths that occurred in hospice (N=161), which were (somewhat ambiguously) included in California’s Phase 1a. (Hospice deaths were not included in Minnesota’s Phase 1a.) Deaths that occurred in long-term care facilities were identified in California by, first, using death certificate place of death and, second, matching the location of deaths to a comprehensive list of long-term care facilities. In Minnesota, these deaths were identified by the death certificate (see Appendix for details and sensitivity analyses). In addition, we removed deaths among health care workers in California (N = 1,494); however, we were unable to remove health care worker deaths in Minnesota (N = 28, per communication with the Minnesota Department of Health). Finally, we excluded those who do not reside in the state in which they died or who could not be successfully geolocated (California N=1,817; Minnesota N=162). Our final analytic samples are N=24,880 geolocated deaths in California and N=2,584 geolocated deaths in Minnesota.
We limited analyses of specific racial groups to non-Hispanic White, non-Hispanic Black, Latino, and Asian/Asian-American populations because they are the largest populations in both states and we have greater confidence that death certificate racial assignments match population racial categorizations. Latino or Hispanic identity took precedence over racial group assignment. In Minnesota numerators and in both state denominators, the Asian group includes Pacific Islanders; in California, those are coded as “other-race” deaths (N=564 for the full other-race category), resulting in a small undercount of the COVID-19 death rates for Asians in California. We treat all non-white populations (including those recorded as “Other race” on death certificates) as the BIPOC group.
A sensitivity analysis on the main results found that they are qualitatively robust to defining mortality risk using data for November-December 2020 only instead of data for all of 2020 (see Supplemental Appendix; Figure S2, Figure S3, Figure S4).
Population data
Official 2020 population estimates are not yet available. We projected 2020 population estimates by race/ethnicity and age using historical population counts. Specifically, we used the Census Bureau July 1st population estimates by race, sex, and single-year of age for 2019 and the number of deaths by race, sex, birth cohort and age that took place between July 1, 2019 and June 30, 2020 in each state. Assuming zero net migration for each state during this 12-month period, we implemented the cohort-component method for each sex and race to estimate the July 1st population estimates by race, sex, and single-year of age for 2020. These calculations were performed after redistributing deaths of “Other” races, including multiple races (i.e. other than “Non-Hispanic White”, “Non-Hispanic Black”, “Non-Hispanic Native American”, “Non-Hispanic Asian”, “Hispanic”) proportionately over the other races for each sex and within each age group. Similarly, we redistributed deaths of unknown ages proportionately over all known ages within each race, sex, and age group category. We verified that our population estimates for July 1, 2020 were consistent with past trends in the state (using Census Bureau July 1 population estimates for 2010 through 2019) (67) for each combination of race, sex, and 5-year age group.
In order to estimate Census tract-specific populations for each race-, sex-, and age-specific group, we used the 2013-2018 National Historical Geographic Information System (NHGIS) estimates (68), which are the most recent available, as a baseline measure. The NHGIS estimates are in 10-year age bands. To produce 5-year age bands, we used the single-year-age projections of the 2020 population to estimate the proportion of each race- and sex-specific 10-year age interval that is in the older or younger 5-year group in that interval. Finally, we scaled the resulting Census tract-specific estimates up to the projected 2020 population size using the ratio of the 2020 population to the 2013-2018 NHGIS estimates for each race-, sex-, and 5-year-age-specific population. This procedure assumes that differential population growth across geographic areas in each state is proxied by the resident demographics.
Geographic disadvantage
We define geographic disadvantage using the area deprivation index (ADI) and metropolitan status. For each census block group, the ADI provides a score ranging from 1 (low deprivation) to 10 (high deprivation) based on 17 area-level measures about education, employment, housing quality, and poverty (69); the scores represent deciles of the state distribution of multidimensional deprivation. We use the ADI rather than the widely-used Social Vulnerability Index (SVI) because the SVI includes the racial composition of geographic areas as a component of vulnerability (70), whereas our goal is to evaluate facially race-neutral geographic targeting. For each Census tract, we took the population-weighted mean ADI score and categorized tracts as low deprivation (<=3), medium deprivation (3.01 to 7.49), and high deprivation (>=7.5). The asymmetry in the cutpoints for advantage and disadvantage reflects that there are extremely few COVID-19 deaths in areas with ADI<2.5 in Minnesota, producing unstable age-specific mortality rates without including slightly less advantaged tracts. In addition, we categorized tracts by metropolitan status. In Minnesota, metropolitan tracts were the seven counties in the Twin Cities metropolitan area (collectively representing about 56% of the state population). In California, metropolitan tracts were those in Los Angeles, San Diego, San Francisco, Santa Clara, and Fresno counties (collectively representing about 44% of the state population). Non-metro areas include all Census tracts outside of the metro categorization.
Statistical analysis
Our analysis is based on estimating the COVID-19 mortality risk of the eligible population under various eligibility schemes. Mortality is an unadjusted ratio of observed COVID-19 deaths per 100,000 population. We used COVID-19 mortality in 2020 to proxy COVID-19 mortality risk in 2021 in the absence of vaccination, thus ignoring changes from selective mortality, improved treatment, and evolving patterns of risk. We do not assume that risk in 2021 in the absence of vaccination would equal risk in 2020, but we do assume that, across groups, 2021 risk in the absence of vaccination would be proportional to 2020 risk. This assumption allows us to compare the aggregate risk of the eligible under various vaccination strategies. As a sensitivity analysis, to see whether evolving patterns of risk would alter our results, we also used only November-December 2020 mortality to estimate risk (see Supplement) instead of 2020 as a whole.
Thus, the risk to each subpopulation at age group a and group i (which can be a racial group or geographic group), Mi,a, represents that subpopulation’s aggregate COVID-19 mortality across 2020. As expressed in deaths per 100,000 people, this risk is given by:
 where Di,a is a count of COVID-19 deaths in 2020 in group i and age interval a and Ni,a is the estimated 2020 population size in the same subpopulation. Weight wi,a is set to 1 for all subpopulations in the main analysis, reflecting that our main results assume vaccine uptake is random among the eligible group, and thus all eligible subpopulations are weighted equally. However, we also compared prioritization schedules in the context of differential vaccine uptake among the eligible by race or by age (to varying degrees), reflecting that the available vaccine supply exceeds demand among the eligible. These simulations are described in detail below. They are accomplished mechanically by up-weighting the mortality of the populations assumed to have selective uptake (e.g., white people) to estimate a counterfactual mortality risk of a population of vaccine-receivers that are a nonrandom draw from the eligible population. We implemented code review procedures for all of the statistical analyses (71).
Census tract estimates (Comparison set 3)
To assess schedules that include high-mortality Census tracts directly, we rank tracts in each state by their COVID-19 mortality. We limit the tract ranking to tracts with at least 1,000 residents and at least 5 COVID-19 deaths (which means that the ranking is limited to relatively high-mortality tracts; N=2,055 tracts in California; N=139 tracts in Minnesota) in order to reduce the inclusion of tracts that had high mortality for idiosyncratic reasons in 2020 that would not have applied in 2021. A remaining danger is that some included tracts may contain unidentified long-term care facilities, which would mean that the true inflection point (at which prioritizing all adults in high-mortality tracts flips from improving to worsening mortality targeting) would occur at a lower number of tracts than our analysis suggested. This possibility is explored in a sensitivity analysis described in the Appendix (Figure S5).
We consider tract inclusion under six scenarios, ranked by the extent to which vaccinating all adults in the tract would prioritize high-risk individuals:
“No tract benefit for older people”: Assumes that older people in prioritized tracts, who are eligible by age as well as tract, would be vaccinated at the same rate as their age group in the rest of the state and gain no additional likelihood of vaccination from tract priority;
“Tract benefit only for youngest old (smaller benefit)”: Assumes that the youngest older people in prioritized tracts, who have just recently become eligible by age as well as tract, would become 25% more likely to be vaccinated when their tract is prioritized, but older people who have been eligible longer would be vaccinated at the same rate as their age group in the rest of the state and gain no additional likelihood of vaccination from tract priority;
“Tract benefit only for youngest old (larger benefit)”: Assumes that the youngest older people in prioritized tracts, who have just recently become eligible by age as well as tract, would become 50% more likely to be vaccinated when their tract is prioritized, but older people who have been eligible longer would be vaccinated at the same rate as their age group in the rest of the state and gain no additional likelihood of vaccination from tract priority;
“Tract benefit for all older people (smaller benefit)”: Assumes that all older people in prioritized tracts, who are eligible by age as well as tract, would become 25% more likely to be vaccinated when their tract is prioritized;
“Tract benefit for all older people (larger benefit)”: Assumes that all older people in prioritized tracts, who are eligible by age as well as tract, would become 50% more likely to be vaccinated when their tract is prioritized;
“Tract benefit regardless of age-eligibility”: Assumes that all older people in prioritized tracts, who are eligible by age as well as tract, would become twice as likely to be vaccinated when their tract is prioritized (thus benefiting from the same absolute increase as younger people in the tract).
All six scenarios additionally assume that people in prioritized tracts who are too young to be otherwise eligible become vaccinated at the same rate as age-eligible people outside prioritized tracts. Mechanically, the selective uptake assumptions amount to setting the wi,a weighting term in Eq. (1) equal to some factor greater than 1 for those who are assumed to experience selective uptake, and wi,a =1 for all eligible others. For example, Scenario 4 weights people who are eligible by virtue of both their age and their tract at wi,a=1.5 while those who are eligible by virtue of age or tract but not both are weighted at wi,a=1.
Analysis of alternative equity strategies: substantially lowering the age threshold universally vs. selectively (Comparison set 4)
In these analyses, we compared the strategy of substantially lowering the age threshold for eligibility universally to the strategy of keeping the age threshold at a higher level but selectively lowering it for high-risk geography-age groups. High-risk geography-age groups are defined in the same way as in comparison set 2: geographies are stratified by area deprivation and metropolitan status, and geography-age groups are declared eligible when their mortality exceeds that of the state aggregate for the youngest eligible age group.
In these analyses, we compared these strategies at two points:
Scenario 1/Early vaccination: Setting statewide eligibility at age 60 vs. setting statewide eligibility at age 70 while additionally prioritizing high-risk geographies as young as 60.
Scenario 2/Late vaccination: Setting statewide eligibility at age 45 vs. setting statewide eligibility at 55 while additionally prioritizing high-risk geographies as young as 45 (California) or 40 (Minnesota).
We selected these age targets in order to match comparisons across states at “early” and “late” vaccination ages. In both California and Minnesota, the statewide 70-74 age group’s mortality is exceeded by residents of deprived Metro areas beginning at age 60. (In California, the 70-74 group’s mortality is also exceeded by residents of deprived non-Metro areas beginning at age 65.) In California, the statewide 55-59 age group’s mortality is exceeded by residents of deprived Metro areas beginning at age 45; in Minnesota, this age group’s mortality is exceeded by residents of deprived Metro areas beginning at age 40. (The 55-59 group’s mortality is also exceeded by residents of deprived non-Metro areas in California, and medium-deprivation Metro areas in Minnesota, beginning at age 50.) Thus, Scenario 2’s comparison statewide threshold of age 45 is conservative for Minnesota in the sense that a schedule aiming to include the most deprived neighborhoods would need to incorporate age 40, not just 45.
In the baseline analysis of these scenarios, we assumed that vaccine uptake was random among the eligible (wi,a=1 for all subpopulations). In the selective uptake simulations (described more fully in the Appendix), we considered what would happen if dramatically increasing the size of the eligible group (e.g., by dropping the statewide age threshold by 10 years of age) increased the selective uptake of white people, or of younger people, among the eligible from 10% to 25% (i.e., if having a vaccine-eligible population whose size greatly exceeds supply results in wwhite,a increasing from 1.1 to 1.25 while wBIPOC,a remains fixed at 1). These numbers were chosen to be roughly calibrated against data suggesting about 25% selective uptake among white people six weeks into eligibility at 65+ (72).
Additional information
This study was deemed exempt from full review by the University of Minnesota institutional review board (STUDY00012527) and was approved by the California Health and Human Services institutional review board (Project number: 2020-109).
Data Availability
All data needed to evaluate the conclusions in the paper are present in the paper and/or the Supplementary Materials. The data can be downloaded from a permanent repository at https://osf.io/tzeq3/?view_only=191ff8cfbd104e3aa2e76518af554943
Author contributions
EWF and MVK conceived and designed the study. EWF, MVK, Y-HC, MB, DVR, KPL, ARR, KBD, JPL acquired, analyzed, and interpreted the data. EWF, MVK, ARR, ECM, MB, KAD, JPL drafted the initial version of the manuscript. All authors provided critical revisions. All authors approve of the final manuscript and take final responsibility for the decision to submit for publication.
EWF and MVK had direct access to and verified the underlying data. In addition, JPL had full access to the Minnesota death certificate data and Y-HC had full access to the California death certificate data; and ARR had full access to and verified the analytic data.
Data availability statement
All data needed to evaluate the conclusions in the paper are present in the paper and/or the Supplementary Materials. The data can be downloaded from a permanent repository at https://osf.io/tzeq3/?view_only=191ff8cfbd104e3aa2e76518af554943
Competing interests
EWF is a member of the Steering Committee of the Seward Vaccine Equity Project, an unpaid volunteer position. All authors declare that they have no competing interests.
Sensitivity Analyses
Sensitivity analysis: Estimating mortality risk based only on November-December 2020
Our analysis depends on estimating the mortality risk that each population cell would have in 2021 in the absence of vaccination, relative to other population cells. In the main analysis, we used COVID-19 mortality across 2020 to estimate this counterfactual mortality. (As explained in the Materials and Methods, we do not assume that COVID-19 mortality in 2021 in the absence of vaccination would equal COVID-19 mortality in 2020, but we do assume that its distribution across groups would be proportional to the distribution in 2020.) To evaluate the robustness of our results to this assumption, we repeat the main parts of our analysis while estimating mortality risk based only on November and December 2020. Those two final months collectively represented around half of the year’s COVID mortality (with California experiencing 8% of 2020 COVID-19 deaths in November and 40% in December and Minnesota experiencing 25% in November and 30% in December). This alternative strategy for estimating mortality risk would be preferred if the demographics of COVID-19 mortality within each state evolved monotonically over 2020, or otherwise evinced a permanent shift late in the year that would persist into 2021 in the absence of vaccination. Conversely, this alternative strategy would be dispreferred to the extent that demographics of COVID-19 mortality risk shifted non-monotonically over time, such that no one period should be assumed to better proxy overall risk than any other period, or to the extent that demographics exhibited seasonal cycles.
Results using this alternative estimate of mortality risk confirm that our argument does not turn on the period from which mortality risk is estimated. For example, using the November-December measure, the percent of COVID-19 deaths that occur at age 75 or older is, in California, 67% of white, 39% of Black, 37% of Latino, and 62% of Asian deaths, and in Minnesota, 65% of white, 27% of Black, 29% of Latino, and 36% of Asian deaths (Figure S2; these percentages are extremely close to those estimated from all of 2020 (Figure 1). Exceeding state aggregate mortality at ages 65-69—a key threshold that early eligibility decisions were pegged to—are BIPOC individuals beginning at ages 60-64 in both California and Minnesota, and Latino individuals beginning at ages 55-59 in California (Figure S3, top row). Similarly, exceeding the state aggregate mortality at ages 65-69 are individuals in the most deprived neighborhoods beginning at ages 60-64 in California non-major-metro and major metro areas, and in Minnesota’s major metro area (Figure S3, bottom row).
In general, limiting the data to November-December attenuates the extent to which younger BIPOC people have greater COVID risk than the state aggregate in Minnesota—with BIPOC having higher mortality than the state aggregate at a maximum 10 years older rather than 15—and reduces the magnitude of deaths averted by adopting alternative strategies in Minnesota, while hardly changing these results for California (Figure S4). This likely reflects that November and December were highly distinctive months in Minnesota’s 2020 COVID-19 mortality (e.g., with mortality more concentrated in the white population during November and December than in all other months of 2020 and the 2021 months that followed). However, in both states, the conclusion that purely age-based vaccine eligibility prioritized low-risk white people above high-risk BIPOC people—and that geographic targeting can improve the matching of vaccines to high mortality, compared to age-based eligibility alone—does not depend on the time period over which mortality risk is measured.
Sensitivity analysis: Alternative classification of long-term care deaths in Minnesota
Minnesota is unusual in that a majority of COVID-19 deaths in the state occurred in long-term care facilities. For this reason, we analyze whether results about high-mortality Census tracts could be partially driven by misclassifying some long-term care deaths as general population deaths in Minnesota. The primary identification of long-term care deaths in Minnesota is based on two death certificate fields that identify whether the death occurred in a long-term care facility and whether the decedent was a resident of long-term care. We count both as LTC deaths (so that we include, for example, LTC residents who were hospitalized shortly before their deaths). This strategy produces an undercount of LTC deaths relative to numbers estimated by the Minnesota Department of Health (MDH) through the end of 2020 (3,070 vs. 3,803).
As an alternative strategy constructed as a sensitivity analysis, we also classify as LTC deaths any deaths that are estimated to have occurred in the same location as any LTC deaths (to any cause and in any year, from January 1, 2017 to May 5, 2021), in addition to those classified as LTC deaths based on their death certificates. We count deaths as occurring in the same location if they occurred at a known address or street point within a 50-meter radius of one another.
This strategy closely approximates true LTC deaths, producing an estimate of 3,726. However, it likely includes some notable overestimation in addition to some missed deaths, for two reasons. First, many establishments combine a LTC facility with independent living facilities. The MDH classifications exclude those in independent living from LTC counts and, for our purposes, this exclusion is correct because independent living residents were usually not prioritized for vaccination along with LTC residents in Phase 1a (per communication with MDH). However, our location-based sensitivity analysis will count the independent living deaths as LTC deaths as long as they occurred within 50 meters. Spot-checking locations in which, on death certificates, large numbers of deaths were tagged as LTC and large numbers also were not tagged as LTC reveals that these are, as expected, institutions that combine memory care facilities with independent living facilities. Second, this location-based classification may erroneously include residents of large non-LTC residential facilities if any individual is tagged on the death certificate as an LTC death even though their address is not an LTC facility. For example, spot checking revealed a public housing building in Saint Paul in which four deaths were “LTC deaths” but had a residential address in that building, even though the building does not contain LTC units. These deaths may be people who moved into LTC shortly before their deaths and had their longer-term address listed on the death certificate (or may have some other source of data error), but this location-based sensitivity analysis then treats all residents of this public housing building as LTC deaths. Because of these errors of commission, which will differentially exclude people living in high-risk housing or living among high-risk individuals, the alternative strategy for identifying LTC deaths is not preferred, but is included as a sensitivity analysis because it errs in a different direction from the main analysis.
As expected, the analysis using these alternative exclusion criteria finds smaller benefits to universally vaccinating all adults in high-mortality tracts than does the main analysis (Figure S5). For example, using these criteria, we find, at best, only minimal benefit, and more often detriment, to universal vaccination at any point when prioritizing high-mortality tracts is assumed to yield no increase in vaccine uptake among older people in those tracts. When tract prioritization is assumed to increase vaccine uptake among older people by 50%, this alternative analysis finds minimal benefit or detriment to tract prioritization at the stage when 70+ ages are otherwise being vaccinated, but meaningful benefit as ages younger than 70 become eligible. Perhaps the biggest difference of the results in Figure S5 from the main results shown in Figure 6 and Figure 7 is that, given the very sensitive alternative measure of LTC deaths, a notably smaller number of Census tracts is considered to have sufficient non-LTC COVID-19 deaths (and sufficient population) to generate reliable evidence of high mortality (N=47 vs. N=139). These alternative results can be interpreted as a lower bound on the benefits of universal prioritization of high-mortality tracts in Minnesota.
Sensitivity analysis: Selective uptake
We considered results under selective uptake by white people or young people. In the race analyses, we allowed white people to be more likely, given eligibility, to access vaccines by 0% (baseline), 5%, 10%, 15%, 25%, 50%, 100%, or 150%. In the age analyses, we allowed each successively younger age group to be more likely, given eligibility, to access vaccines by the same percentages. The full set of results are given in Figure S6.
Here, we portray the same comparisons as Figure 4 in relative, rather than absolute, scale. Specifically, we compare the targeted mortality rate (x-axis) of different types of vaccine allocation strategies (color) based on age (y-axis). Specifically, we compare age alone (blue), age in combination with racial/ethnic groups (red), age in combination with high mortality locations (green), or age in combination with the highest mortality racial/ethnic group, which in California is Latinos (purple). In all cases and across all age limits, incorporating additional, younger but higher risk groups improves the efficiency of the rollout and improves racial/ethnic equity. In California, incorporating high mortality geographies (green) achieves nearly the same efficiency as incorporating high mortality racial/ethnic groups (red). In Minnesota, incorporating high mortality racial/ethnic groups always outperforms incorporating high mortality geographies; however, high mortality geography still improves the alignment of vaccine allocation with COVID-19 mortality risk.

Each line corresponds to the proportion of deaths (y-axis) at or above each successive age group (x-axis). In the top row, each line corresponds to a racial/ethnic category. For reference, we show the proportion of deaths among non-Hispanic whites ages 65 and older. For nearly all other racial/ethnic groups, the proportion of deaths at age 65 is lower. Correspondingly, for nearly all other racial/ethnic groups, the same proportion of deaths occurs at substantially lower ages. In the bottom row, each line represents a metropolitan area and deprivation level. Darker shades are metropolitan while lighter shades are non-metropolitan. Blue is low deprivation, green is medium deprivation, and red is high deprivation. The reference lines show the proportion of deaths at ages 65 and above among non-metropolitan, low deprivation areas. This figure recreates Figure 5 with mortality risk defined by November-December 2020 (rather than all of 2020) in order to ensure that the choice of time period does not drive the results.

Top row: The mortality rate (y-axis) by age (x-axis) varies by race/ethnicity (colors) with the non-Hispanic white population (blue) experiencing substantially lower mortality at any age relative to the BIPOC (red) and Latino (green) populations. Age-based eligibility rules ignore this variation. The secondary y-axis on the right shows the age group corresponding to the state-wide age-specific mortality rate. Bottom row: The mortality rate (y-axis) by age (x-axis) varies by area deprivation index (ADI; colors). We divide areas into “Metro” (lighter shades) and “Non-metro” (darker shades). We define “Metro” as the seven counties in the Twin Cities metropolitan area in Minnesota and Los Angeles, San Diego, San Francisco, Santa Clara, and Fresno counties in California. Non-metro areas include all census tracts outside of the metro category. Low deprivation is defined as an area deprivation index of 1-3, medium deprivation is 3.01-7.49, and high deprivation is 7.5-10.
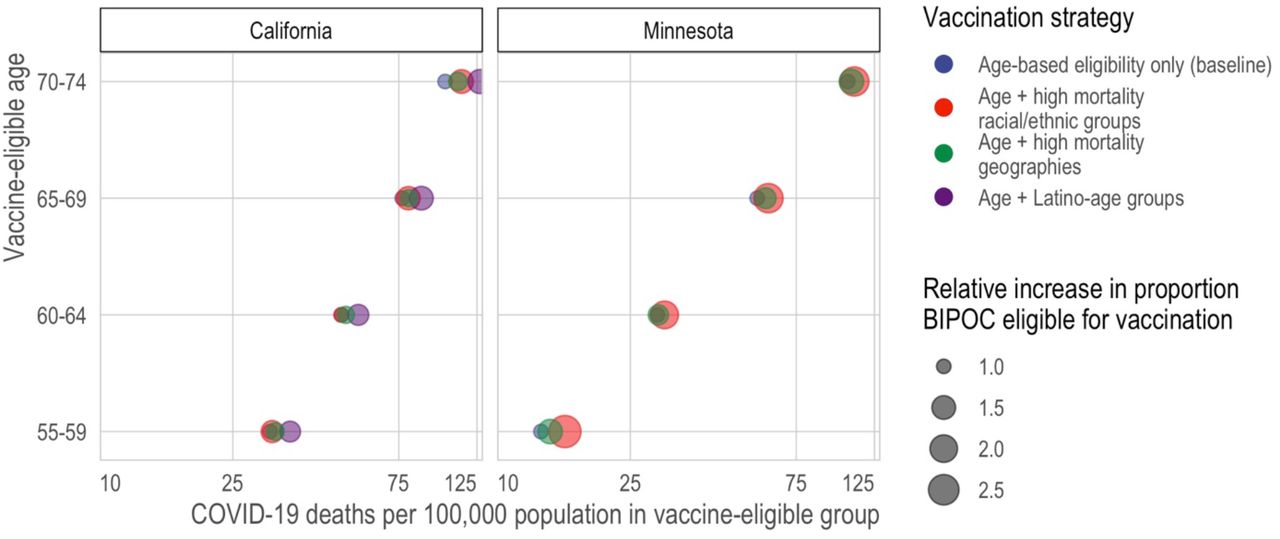
Here, we compare the predicted mortality rate (x-axis) of different types of vaccine allocation strategies (color) based on age (y-axis). Specifically, we compare age alone (blue), age in combination with racial/ethnic groups (red), age in combination with high mortality locations (green), and for California—the larger, more diverse state—age in combination with the highest mortality racial/ethnic group, which in California is Latinos (purple).
The x-axis is the number of tracts in which all adults (ages 20+) are prioritized for vaccination. The y-axis in the left column is is 2020 COVID-19 deaths per 100,000; a higher death rate among the eligible indicates better targeting of vaccines toward high-risk individuals. The y-axis in the right column is the proportion of those eligible for vaccination who are BIPOC. The lines correspond to alternative scenarios as described in the text of the Materials and Methods. This figure reproduces the analysis in Figure 5 and Figure 6 under an alternative classification designed to produce an overcount of deaths in long-term care facilities (LTCFs), to ensure that results about prioritizing high-mortality tracts are not driven by unidentified deaths in LTCFs.

The x-axis is the percent by which vaccine uptake among the eligible is increased for white populations or for each successively younger five-year age group. The y-axis is the 2020 COVID-19 death rate per 100,000 among the eligible populations; a higher death rate among the eligible implies better targeting of vaccines toward high-risk individuals.
Death rate and proportion white of people eligible under various hypothetical vaccination schedules
Acknowledgements
We thank Elaine Hernandez, Maria Glymour, Joshua Goldstein, Marc Lipsitch, Eleanor Murray, Michelle Niemann, Govind Persad, and Matthew Plummer for helpful discussion. We thank the California Department of Public Health and Minnesota Department of Health for access to death certificate data. This work is supported in part by the National Institutes of Health. EWF, ARR, MB, and DVR are supported in part by the National Institute on Aging (EWF and DVR: P30AG066613; ARR: T32AG049663; MB: P30AG012839 and R03G058110). EWF, DVR, and JPL are supported in part by the Eunice Kennedy Shriver National Institute of Child Health and Human Development (P2CHD041023). MVK is supported in part by the National Institute on Drug Abuse (K99DA051534). In addition, EWF is supported by a Sustainable Development Goals Rapid Response Grant, a College of Liberal Arts Seed Grant, and during initial data processing stages was supported by the Fesler-Lampert Chair of Aging Studies at the University of Minnesota. This research also relied on data and research support from the National Historical Geographic Information System (NHGIS), which is supported by the National Institutes of Health (R01HD057929) and National Science Foundation (1825768). Finally, we thank the Berkeley Workshop in Formal Demography (supported by the National Institutes of Health [R25HD083136, P30AG012839, P2CHD073964]), which facilitated the initial connection between the California-based and Minnesota-based research teams. The funders of the study had no role in study design, data collection, data analysis, data interpretation, or writing of the report. The content is solely the responsibility of the authors and does not necessarily represent the official views of the National Institutes of Health or National Science Foundation.
Footnotes
One-sentence summary: Age-based COVID-19 vaccination prioritizes white people above higher-risk others; geographic prioritization improves equity.
Revised in response to reviewers.
References


