
Abstract
The promise of efficacious vaccines against SARS-CoV-2 is fulfilled and vaccination campaigns are starting worldwide. However, the fight against the pandemic is far from over. Here, we propose an age-structured compartmental model to study the interplay of disease transmission, vaccines rollout, and behavioural dynamics. We investigate, via in-silico simulations, individual and societal behavioural changes, possibly induced by the start of the vaccination campaigns, and manifested as a relaxation of non-pharmaceutical interventions. We calibrate the model using real epidemiological data for three different countries: Italy, France, and the United Kingdom. We explore different vaccination rollout speeds, prioritization strategies, and vaccine efficacy as well as multiple behavioural responses. Our findings suggest that early relaxation of safe behaviours can jeopardize the benefits brought by the vaccine in the short term: a fast vaccine distribution and policies aimed at keeping high compliance of individual safe behaviours are key to mitigate disease resurgence.
1 Introduction
So far the war against COVID-19 has been largely fought with non-pharmaceutical interventions (NPIs). Bans of events and social gatherings, limitations in national and international travels, school closures, shifts towards remote working, curfews, closure of pubs and restaurants, cordon sanitaires, national and regional lockdowns are examples of governmental interventions implemented around the world to curb the spreading of SARS-CoV-2 [1–5]. While extremely effective, such top-down NPIs induce profound behavioural changes, bring many social activities to a halt, and thus have huge socio-economic costs. Hence, alongside these measures, governments nudged and/or mandated populations to adopt another set of NPIs. Social distancing, face masks, and increased hygiene are examples [6]. Although far from being cost-free, they are more feasible, sustainable, and allow for higher levels of socio-economic activity. As such, they have been the leitmotif of the post first COVID-19 wave in many countries. Unfortunately, awareness, adoption, and compliance with these NPIs have been spotty [6]. Furthermore, they have not been complemented with sufficiently aggressive test and trace programs. As result, many countries experienced marked disease resurgences after the summer and some had to resort to new lockdowns [7]. As we write, we are turning a crucial corner in the battle. Three vaccines have shown great results of their phase 3 trials, two have been authorized for emergency use by several regulating agencies (three in the UK) and several others are in the pipeline [8–10]. We are witnessing the start of vaccination campaigns around the world. However, the logistical issues linked to the production, delivery, and administration of billions of doses on a global scale impose caution when evaluating the impact vaccines will have on the pandemic in the short term. They will be a scarce resource and it will take time to vaccinate the fraction of the population necessary for herd immunity [11, 12]. Furthermore, vaccines are not perfect and there are many other unknowns [13]. The results show high levels, around 95% [14, 15], of direct protection against the disease. However, these figures might end up to be lower, it is still unclear how they stratify for risk-groups (i.e., age), whether vaccines limit further transmission, how long the immunity lasts, and what is the protection offered by partial vaccination or lower doses [13]. Finally, vaccines’ acceptance is a complex challenge. A recent survey among 13, 426 participants in 19 countries shows that, while 71.5% of the sample is very or somewhat likely to take the vaccine, there are large heterogeneities [16]. Acceptance rates vary from 90% in China to less than 55% in Russia. They are linked to socio-economic, socio-demographic features, and education attainment [16]. Worryingly, participants in the 18–24 age brackets reported being less likely to accept the vaccine. Compatible results have been reported in another survey conducted among 2, 006 US adults [17]. In this case, 69% of participants declared to be willing to take the vaccine. However, the results show dependence on political leanings, whether health providers will recommend the vaccine, the perceived likelihood to get infected, and the perceived efficacy of protection [17]. Arguably, vaccines alone will not be able to contain the spreading of the virus, at least in the short term [18]. Social distancing, face masks, hygiene measures, and other NPIs will be still key during the delivery of such vaccination programs.
In this context, an important question emerges. What will happen to adoption and compliance to NPIs as vaccination campaigns progress? Their arrival might induce individual and collective behavioural changes. Some might see this milestone as the official end of the emergency and as result relax their COVID-safe behaviours. Somehow paradoxically, vaccines might have, at least initially, a net negative effect. According to the health-belief model, one of the most commonly used psychological theories to characterize health-related behaviours, beliefs, perceptions, barriers to take action, and other modifying variables such as socio-demographic and socio-economic factors are key ingredients driving behavioural changes [19–21]. Several surveys conducted during the COVID-19 pandemic, well before any concrete hope for a vaccine, confirm this picture, provide hints of how the arrival of vaccines might corrode even more adoption, and highlight how compliance is a complex multi-faced problem [5]. A cross-sectional survey conducted among 3474 US adults shows that about 47% of participants perceived measures such as social distancing, washing hands, avoid touching the face of low effectiveness [22]. Another survey conducted among 1591 individuals in the United States indicates that as individuals perceived an increase in the personal risk they increasingly engaged in risk-prevention behaviours [23]. A survey conducted among 21, 649 adults in eight countries (Austria, France, Germany, Italy, New Zealand, the UK, and the USA) shows gender differences in risk perception. Women have been found, in all countries, more likely to perceive COVID-19 as a serious problem, agree with NPIs, and comply with them [24]. Similar results have been found in other studies conducted in Slovenia, Japan and Germany [25–28]. Age is also an important variable affecting adoption. Interestingly, both young and old adults, especially if male, reported lower levels of compliance [25, 26]. Finally, a survey conducted among 401 participants in Pakistan shows how people living in urban areas are more likely to develop higher knowledge about the current pandemic and how the unavailability of hygienic material is the main barrier for NPIs adoption [29]. The importance of socio-demographic and socio-economic characteristics in the adoption of NPIs has been also reported in other studies conducted by monitoring variations to aggregate mobility patterns before and during NPIs. Unanimously they indicate that disadvantaged groups, though less mobile before the pandemic, were not able to reduce their mobility (i.e., stay home) during the implementation of strict NPIs [30–37].
The literature aimed at estimating the epidemiological and societal impact of COVID-19 vaccines has been focused mainly on two very important points. The first line of research has been devoted to quantifying the effects of a vaccine on the evolution of the pandemic, considering different efficacy and coverage levels [38]. The second instead tackled the issue of vaccine allocation investigating strategies that target first different groups (i.e., age brackets, high-risk individuals) or particular occupations (i.e., doctors, nurses) [10, 39, 40]. To the best of our knowledge, the effects of a vaccine on the adoption of NPIs and thus on the evolution of the pandemic have not been yet studied at the population level. The only article in this direction we are aware of is a very recent preprint exploring this issue in the specific setting of long-term care facilities [41].
To tackle such limitation, we introduce an age-structured epidemic model capturing the possible relaxation of NPIs adoption as a function of the vaccinated population. We consider the two types of NPIs described above. The first reflects top-down measures such as school closure, remote working, and closure of other activities. We explore two reopening scenarios implemented after the closures of November modeling them as variations of contact matrices. The second type captures bottom-up individual COVID-safe measures such as wearing face masks, social distancing, and increased hygiene. We model different compliance levels as distinct compartments and consider transitions driven by the fraction of the vaccinated population (contributing towards lower compliance) and by the number of deaths (contributing towards higher compliance). We calibrate the model to the second COVID-19 wave in Italy, France, and the UK using real contact matrices, the effects of governmental restrictions on schools, working mode, contacts, and real epidemic data up to 2020/12/01. We then simulate a vaccination campaign starting on 2021/01/01 and study, from a theoretical standpoint, the effects of the aforementioned behavioural changes induced by the presence of vaccines on the population. Our findings show that an early relaxation of COVID-safe behaviours may lower, and even nullify, the advantages brought by the vaccine in the short term. We find that the impact of behaviour is amplified when the vaccine rollout is slower, when the top-down measures are less strict or when a vaccination strategy targeting homogeneously the population is employed. Overall, the picture that emerges from the analysis of the different countries is pretty consistent: a high level of compliance towards NPIs such as mask-wearing, social distancing, and avoidance of large gatherings, will be needed in the next months in order to avoid spoiling the great effort of the vaccination campaigns.
2 Results
2.1 Epidemic Model and Calibration
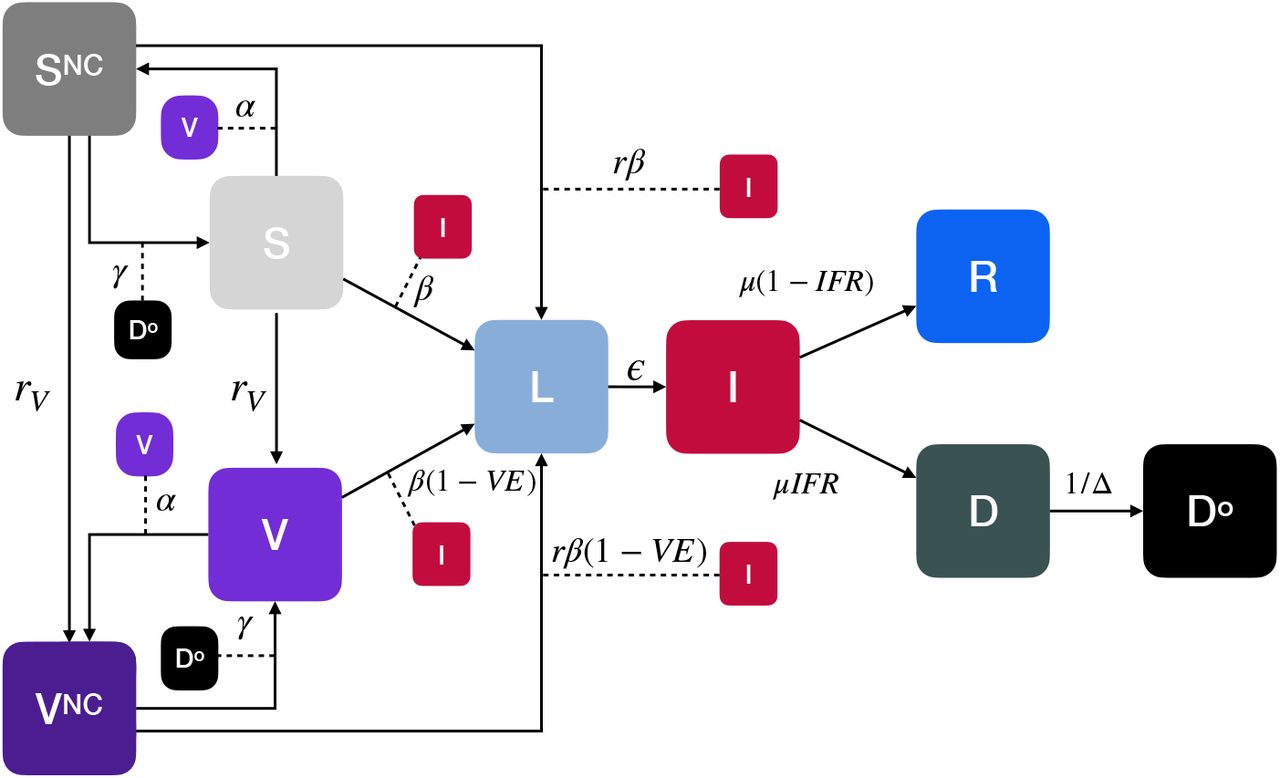
We consider an age-structured compartmental epidemic model extending the classic SLIR archetype with the addition of compartments to account for deaths, vaccinations, and different adoption of NPIs. Before time tV, when the vaccination rollout begins, the model dynamics follows a SLIR structure with deaths. Susceptible individuals (S compartment), in contact with infectious (I compartment), become latent (L compartment). The transmission rate is β and the force of infection is dependent on the age-stratified contact matrix C ∈ ℝK×K, whose element Cij represents the average number of contacts that an individual in age group i make with individuals in j per day. The matrix C has four location-specific contributions: contacts at home, workplace, school, and other locations. We adopt country-specific contacts matrices provided in Ref. [42]. Latent become infectious after ϵ−1 time steps, on average. Infectious individuals either recover (R compartment) or die (D compartment). Note how we include a delay of Δ−1 from the time when individuals enter the compartment D and die (Do compartment, the superscript stands for “observed”). After tV, at each time step (i.e., day) a fraction rV of the susceptible population receives a vaccine that reduces the probability of infection proportional to vaccine efficacy V E and enters in the compartment V. If not specified otherwise, the fraction rV of the population is selected in decreasing order of age. In fact, due to the stratification of mortality risks per age-structure, many countries are prioritizing older age brackets among other groups (i.e., health care workers) [10, 43, 44].
We investigate different values of V E. We consider V E = 0.9 which is in the range of the results from the concluded phase 3 trials as mentioned above [14, 15]. We explore also a lower efficacy of V E = 0.7 in line with findings of a different vaccine trial [45]. Furthermore, we study two vaccination rates rV. A very optimistic and fast deployment that manages to vaccinate rV = 1% of the population daily (aligned with the preparedness plan for Influenza pandemic [46] and with modeling studies on SARS-CoV-2 [39]), and a slower yet more realistic rollout rV = 0.25%. For more details about the vaccination strategies and vaccine efficacy we refer the reader to the Methods section and the Supplementary Material (SM). In the model, as the fraction of vaccinated people grows, individuals (both vaccinated and not) may start giving up safe behaviours therefore exposing themselves to higher infection risks. We describe these different behavioural classes with two compartments SNC (for susceptible) and V NC (for vaccinated). For convenience, we will refer to these individuals as “non-compliant” (NC) to COVID-safe behaviours. The transition from S and V towards such riskier behavioural classes is a function of the fraction of the vaccinated population and the parameter α. The increased risk is captured by a parameter r > 1 which multiplies the transmission rate i.e., β → rβ. In turn, we account for the possibility that a worsening of the epidemiological conditions may push individuals back to safer behaviours. The number of fatalities in the previous time step is used to control this second behavioural transition. Indeed, an increase in deaths is frequently used - especially by media - as an indicator of the severity of the current epidemiological situation. Existing literature suggests that risk perception (in the form of number of infected individuals or deaths) and communication of such risk significantly affect adherence to personal mitigation strategies such as social distancing and wearing face masks [5, 45]. We use a parameter γ to capture the propensity of non-compliant individuals of adopting safer behaviours again. A schematic representation of the model is provided in Fig. 1. We refer the reader to the Methods section and the SM for the mathematical formulation, including the derivation of the basic reproductive number R0. As a way to constraint the model to realistic settings, we calibrate it, via an Approximate Bayesian Computation (ABC) technique [47, 48], separately to data from France, Italy, and the UK in the period 2020/09/01 − 2020/12/01. In other words, the same compartmentalization structure is used to model the evolution of the pandemic in the three countries. Each model is fed with country-specific contact matrices, epidemic and demographic indicators. The fitted parameters are the transmission rate β and those defining the effects of NPIs on contacts patterns. For workplace, school, and other locations contacts we fit a monthly varying parameter defining the extent to which contacts decreased in those contexts. For simplicity, we assume no changes to contacts at home, though lockdowns tend to increase them [49]. Note how we let vary both the transmission rate and the contact matrix. The former describes the risk of infection given contacts with infectious individuals. This is function of the disease (which is assumed to be the same, we don’t consider multiple or emergent new strains possibly more transmissible) and of the protective behaviours such as social distancing and use of face masks. The latter describes variations to the number and types of contacts induced by top-down NPIs as for example remote working, schools closure and lockdowns. By splitting the contributions to the force of infection of transmission rate and contact matrix we are able to take into consideration different behavioural attitudes which, given the same number of contacts, might lead to higher or lower risks of infection. This allows us to consider explicitly both top-down and bottom-up NPIs. More details are reported in the Methods.

We consider an extension of the classic SLIR model adding compartments for vaccinated (V), dead (D describes individuals that will die with a delay of Δ−1 entering the compartment Do), susceptible (SNC) and vaccinated (V NC) individuals that do not comply with COVID-safe behaviours. The vaccine offers a protection V E. The transmission rate for susceptible is β and for susceptible non-compliant rβ (r > 1). The parameter α regulates the transition from compliant to non-compliant behaviours, while γ regulates the opposite flow. Arrows describe the transitions between compartments. The dashed lines represent transitions mediated by interactions. For example, individuals move from SNC to L by interacting with infectious individuals (I) with a transmission rate of rβ. The compartmentalization is then extended to account for empirical age-structure and contact matrices.
In Fig. 2, we report the results of the calibration. It is important to stress how our goal is not to develop a predictive model aimed at forecasting the pandemic trajectory. The fit is used to ground the model and to define the epidemic conditions at the start of the vaccination campaign in the three countries. In fact, our aim is to understand the possible interplay between behaviours and vaccine rollout which is also function of the epidemic progression. In the Figure we report the official and simulated weekly number of deaths. Despite its simplicity and approximations, the model is able to reproduce the evolution of the pandemic in the three countries capturing well its resurgence and progression after the summer. The fitted contact reductions in different contexts show similar trends across countries. A relaxation of restrictions in September and October when schools reopened and many other activities restarted, followed by strict NPIs (even lockdowns) in November due to a significant increase of deaths. These observations are in line with variations of aggregated mobility traces reported by Google (see SM), which however are not trivially linked to epidemiologically relevant contact patterns. In the inset of the Figure we represent the posterior distribution for the transmission rate β obtained through calibration. The median β appears to be larger for the UK, followed by Italy and France. These values correspond to a median R0 of 1.74 for UK, 1.63 for Italy, and 1.55 for France. Not surprisingly, the values are estimated to be larger than one for the three countries. We note how R0 is both function of β and of the contacts matrix (and thus of the reduction parameters). These R0 are computed with respect to 2020/09/01 with the calibrated reduction parameters (we refer the reader to the SM for further details). In the Figure we also report a comparison between the projected numbers of deaths obtained from the model and the official data in December. Despite these are out of sample projections (i.e., the data is not used for calibration) they fall within the confidence intervals of the model. The increase in the number of deaths in the last two weekly data points in the UK is probably linked to a new SARS-CoV-2 variant which has been reported to be more transmissible [50]. The new strain took over in the first week of December, hence outside our calibration period.

For each country (row) we represent on the left the observed and simulated weekly deaths. In the inset of the figure we also represent the posterior distribution of β. On the right, we report the fitted values of the reduction parameters for different contacts locations in different periods (100% indicates no significant reduction from baseline).
2.2 Vaccine-behaviour Interplay
After the calibration step, each model evolves from 2020/12/01 up to 2021/01/01 with the same contacts reduction parameters fitted for November with the addition of full school closure from December 21st to January 6th to account for holidays. Indeed, despite some NPIs have been relaxed at the beginning of December, the risk of infection spikes due to Christmas break and the emergence of a new strain in the UK, have pushed governments to reinstate strict NPIs policies. We set the start of the vaccination rollout on 2021/01/01. Note how, in the countries under investigation, the vaccination campaigns already started in the second half of December, though mostly symbolically for France and Italy. From this date on we model different scenarios to account for possible NPIs strategies kept in place as the vaccination campaign unfolds. In particular, we take into account two reopening scenarios:
scenario 1: 75% work, 100% school, 75% other locations;
scenario 2: 50% work, 75% school, 50% other locations.
While these numbers are hypothetical, they describe two possible strategies aimed at relaxing the NPIs put in place to contrast the disease resurgence in November/December. By looking at the fitted parameters in Figure 2, we can see that scenario 1 is compatible with the reductions our calibration selects for September/October. Hence, they describe a reopening of a large fraction of activities. Scenario 2 instead, models a more conservative reopening strategy which is however less strict than what observed in November/December.
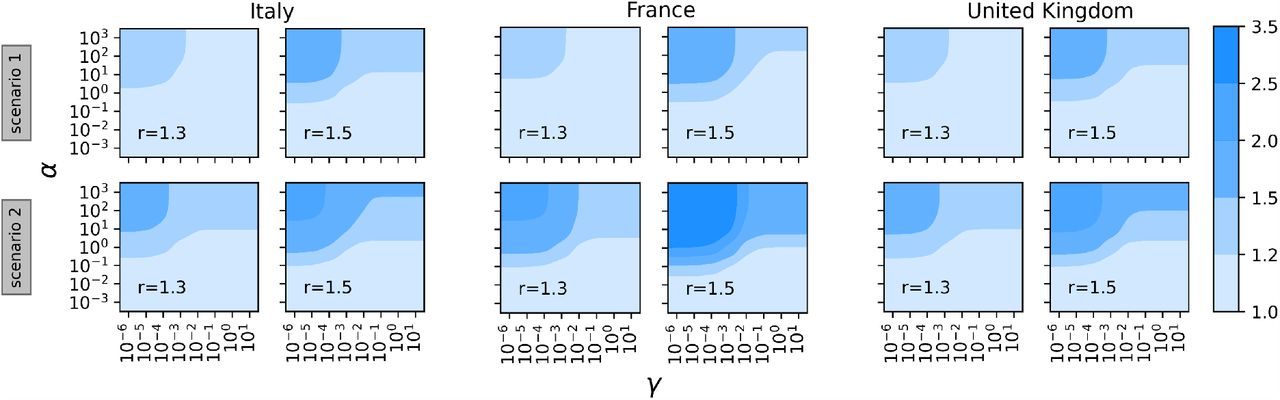
In Figure 3 we start exploring the phase space of parameters regulating the behavioural transitions, α and γ. We run the model from 2021/01/01 up to 2021/05/31 over a grid and compute, for each pair, the ratio between the observed deaths and those obtained in case of a vaccination campaign that does not trigger behavioural responses (i.e. α, γ = 0). Therefore, this quantity can be considered as the variation in deaths only attributable to an early relaxation of COVID-safe behaviours. For the three countries, we consider the two reopening scenarios and two different values of the parameter r (r = 1.3, 1.5) which defines the increase in infection risk for individuals relaxing preventive behaviours. We set rollout speed rV = 0.25% and vaccine efficacy V E = 90%. The obtained variation in deaths varies from a minimum of around 1 (which indicates a negligible net effect of behaviour) to a maximum increase of around 8 in the most extreme case. Across the different settings considered, a common pattern emerges. For α fixed (especially for values larger than one), as γ grows we observe progressively smaller variation in deaths. Indeed, if the population reacts promptly to the new deaths, non-compliant individuals turn back to COVID-safe behaviours. On contrary, for a fixed γ (especially for values equal or smaller than 10− 3) an increase of α induces a stronger behavioural response causing more deaths. In the following, we will keep γ = 10− 3and we will let vary α. In the three countries considered, the maximum number of deaths reported on a single day is around 1, 000. Therefore, this value of γ is such that, in a similar situation, non-compliant individuals would likely return to COVID-safe behaviours. As described in the Methods, we model the transition rate as  hence at the peak of deaths the transition rate towards compliance is
  . The sensitivity to this choice is discussed in the SM.

For the three countries, we explore different values of α and γ in terms of observed deaths increase with respect to a baseline without behavioural response (i.e. α, γ = 0). We set rV = 0.25% and V E = 90%.
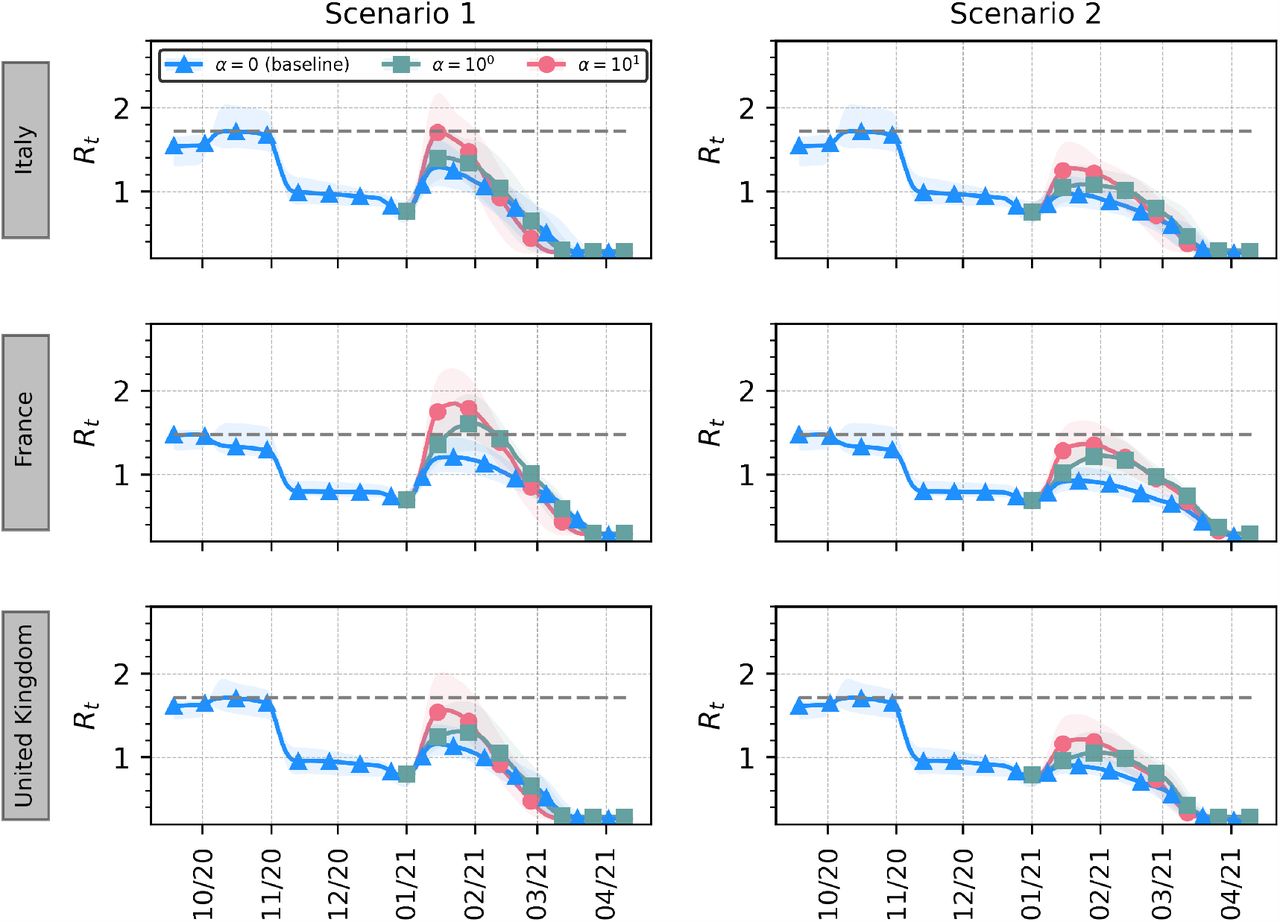
In Figure 4 we explore the effects of different behavioural responses on the effective reproductive number Rt (estimated via EpiEstim [51]) for the three countries in scenario 1 and 2. In particular, in the case α = 0 individuals do not react to the presence of a vaccine and continue adopting COVID-safe behaviours. Therefore, this represents a baseline case where no behavioural response is triggered by the vaccination campaign. It is interesting to notice that, for all the three countries, even in the absence of non-compliant individuals, Rt slightly grows at the reopening in January ‘21. Reasonably, in the more permissive scenario (left), the jump of Rt is higher, but in both scenarios - and for all countries - it remains far from the level that led to the November lockdowns (indicated in figure as a dashed grey horizontal line). When behavioural responses to the presence of a vaccine (i.e., α > 0) are considered, Rt grows more consistently and in some cases overcomes the maximum level observed during the second wave. For scenario 1, this is the case for France when α = 100, 101, while for Italy and UK the 95% CI cross such critical value when α = 101. When we consider the stricter scenario 2, instead, Rt almost reaches such levels only in France for α = 101. Nonetheless, in all the other cases, behavioural responses affect Rt causing a non-negligible increase. In the SM we report this analysis also for rV = 1%.

Median and 95% CI for effective reproductive number (Rt) with different behavioural responses for the three countries in scenario 1 (left) and scenario 2 (right). The grey dashed line indicates the maximum Rt observed before 2021/01/01. Model parameters: γ = 10−3, r = 1.5, rV = 0.25%, V E = 90%.
In Figure 5 we show the relative deaths difference in the three countries considering the reopening scenario 1. This is computed as the fraction of deaths avoided in presence of a vaccine with respect to the scenario without vaccination. We display the quantity for two different rollout speeds, vaccine efficacy and for different behavioural responses (i.e., varying α and r). For all the three countries, we observe that, in the absence of a behavioural reaction (i.e., α = 0) and a fast rollout rV = 1%, a vaccine would reduce the number of deaths in the first five months of 2021 by about 80% − 90% and 75% − 85% for V E = 0.9 and V E = 0.7 respectively. When a slower and more realistic rollout speed is considered (rV = 0.25%), such effectiveness drops to 50% for the case with V E = 0.9 and to 40% with V E = 0.7. For strongest behavioural responses (i.e., α = 103) we observe that the fraction of avoided deaths becomes smaller: when rV = 1%, the 80% reduction shifts to around 60 − 70% with larger fluctuations for the three countries. When a lower vaccine efficacy is considered (V E = 0.7), the reduction is amplified. When we consider instead the slower rollout rV = 0.25% a concerning effect consistently emerges: as non-compliance becomes larger, the benefit brought by the vaccine is nullified and the number of observed deaths even increases with respect to the no-vaccine (and thus no-behaviour change) scenario. This is solely attributable to the behavioural reaction to the vaccination campaign which in turn is not fast enough to balance behaviour relaxation. This phenomenon is even more pronounced when the vaccine efficacy is lower. We would like to stress once again this difference: while in the case of a faster rollout (rV = 1%) behavioural changes impact the number of avoided deaths, with a 4 times slower rollout (rV = 0.25%) the number of deaths increases exclusively due to an early relaxation of COVID-safe behaviours. This finding is consistent across the three countries considered. Indeed, while we note a higher variability of results for France when rV = 0.25%, the obtained medians are comparable. For lower r we observe a weaker impact on vaccine effectiveness in reducing mortality.

Relative deaths difference is computed as the fraction of deaths that are avoided with a vaccine with respect to a baseline simulation without vaccine (and thus no behavioural response). We run the model over the period 2021/01/01-2021/05/31. Results for two different rollout speeds, vaccine efficacy and for different behavioural responses are shown (γ = 10−3).
In Fig. 6 we report the same analysis considering scenario 2. The overall patterns and observations are confirmed also in the case of such more prudent reopening. However, across the board, the positive relative differences are smaller. Hence, the relative reduction induced by the presence of a vaccine is smaller in scenario 2 with respect to scenario 1. Furthermore, some extreme scenarios in France suggest that the number of deaths might even increase with rV = 1%. While this might seem counter-intuitive at first, it is important to remember how, in scenario 2, the baseline features already a smaller number of deaths. In fact, the implementation of stricter NPIs reduces the transmission routes of the virus even in absence of a vaccine, though at much high societal costs.

Relative deaths difference is computed as the fraction of deaths that are avoided with a vaccine with respect to a baseline simulation without vaccine (and thus no behavioural response). We run the model over the period 2021/01/01-2021/05/31. Results for two different rollout speeds, vaccine efficacy and for different behavioural responses are shown (γ = 10−3).
We test also a different vaccination strategy in which the vaccine is distributed homogeneously among people, irrespective of their age (see SM). We find that this strategy has generally a worse performance with respect to the one prioritizing the elderly in terms of avoided deaths. We note how this has been already observed in other modeling papers specifically addressing prioritization strategies [39, 52]. Furthermore, with our model we are also able to observe how the behavioural response amplifies differences in the effectiveness of vaccination strategies. For the sake of simplicity let’s focus on a specific scenario reported in Figure 5: fast rollout, Italy, V E = 0.9, r = 1.5 (the trend holds also for slower rollout and different countries). The fraction of averted deaths ranges from 81% when α = 0 to 76% when α = 100 dropping to 66% when α = 103. When a homogeneous vaccination strategy is implemented (see SM), the fraction of averted deaths goes from 78% when α = 0 to 72% with α = 100, and finally drops to 54% with α = 103. Thus, the drop when a strong behavioural response is in place is three-fold the one observed with a milder one when priority is given to elder population, and it becomes about four-fold larger when vaccine is administered homogeneously. Interestingly, while age-dependent vaccination performs slightly better when mild behavioural responses are in place, it appears to perform even better when strong behavioural responses are considered.
3 Discussion
For almost a year, in the midst of a global pandemic, policymakers struggled to implement sustainable restrictions to slow SARS-CoV-2 spreading. Every non-pharmaceutical intervention was aimed at flattening the incidence curve and buying time for the development, test, production and distribution of a vaccine that might ultimately protect the population. With an impressive scientific endeavor, several vaccines have been developed and an early distribution campaign was rolled out by the last days of December 2020. Besides the potential novel threats emerging from new virus strains [50], the upcoming vaccination campaign represents the beginning of a new normal and a gigantic step towards complete virus suppression. However, in the present paper we demonstrated that if the growth in vaccination uptake would lead to overconfident conducts inducing relaxation of COVID-safe behaviours, additional avoidable deaths will occur. We proposed a novel mechanistic compartmental model able to simulate the unfolding of COVID-19, the vaccination dynamics and the compliance/non-compliance transition modulated by the deaths increase and vaccination uptake. As a way to ground the model we calibrated it using data and observations from France, Italy and the UK and simulate the unfolding of the first months of the vaccination campaign in the three countries. Performing in-silico simulations allowed us to explore several scenarios, where both top-down policies were implemented (e.g., reductions in schools and work mixing patterns) and bottom-up (e.g., face masks, increased hygiene) behaviours dynamically emerged. Worryingly, in the three countries, even in a scenario with several restrictions and a successful vaccination campaign in place, it is possible to witness an increase of Rt at the levels observed in October 2020 when lockdowns were devised and finally implemented in November. In such scenarios, the number of deaths would increase by a factor 2 to 8, and would be purely attributable to non-compliance to safe behaviours.
Our results show that when behaviours come into play, vaccine effectiveness is non-linearly impacted by several factors besides the vaccine efficacy itself. Firstly, the vaccination rollout speed would impact tremendously the number of averted deaths: even in the extreme scenario where people started acting over-confidently boosting the spreading of the virus, a fast daily vaccination rate of 1% of the population would still avoid between 40% to 70% of deaths (yet wasting a potential 60% to 90% reduction due to the vaccine itself). On the other hand, a slower rollout with a daily vaccination rate of 0.25% of the population might even lead to detrimental effects. In fact, a relaxation of protective behaviors not backed by a fast enough rollout in this case might induce an increase of deaths with respect to scenarios without vaccines. Finally, if the vaccination campaign would target uniformly the population irrespective of their age, more people would die and overconfident behaviours would further increase such death toll.
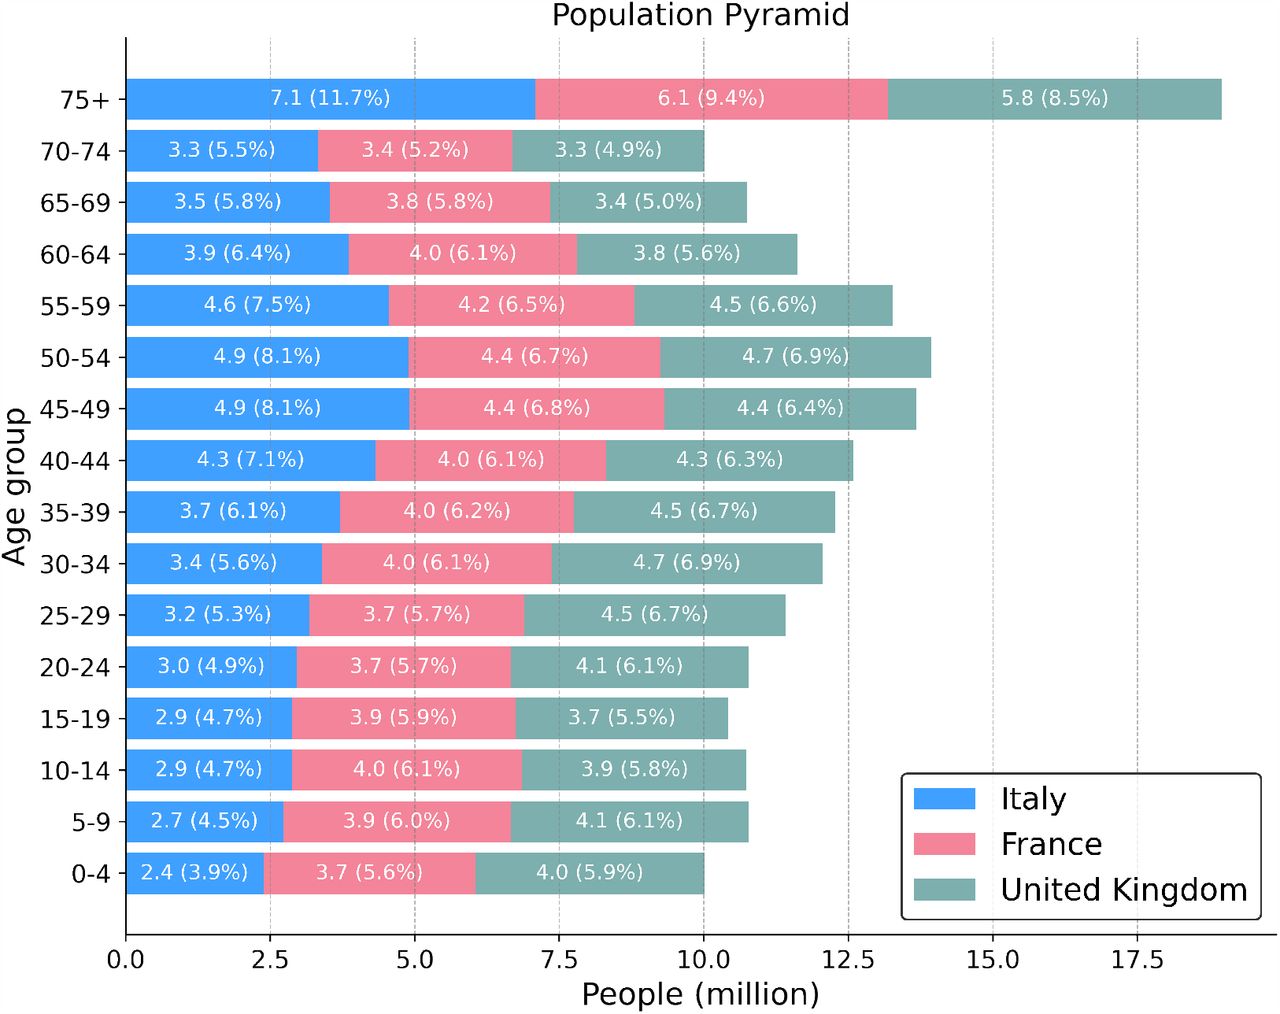
The findings are pretty consistent across the three countries considered although a greater variability (and generally worse trends) are observed for France. Since the vaccination rate is assumed to be the same, these differences are possibly due to the progression of the pandemic. From model’s projections presented in Figure 2, we see that France has the smaller number of weekly deaths projected by January 2021, and is also the country where deaths are expected to decrease more rapidly. Indeed, the deaths curve for France has peaked and has started to consistently decrease after mid-November. Arguably, since the transition towards COVID-safe behaviours is catalyzed by the number of deaths, such trend and lower level of mortality may facilitate non-compliance making individuals less prone to follow NPIs again after having relaxed their behaviour. Another possible explanation relies on the different age distribution. In fact, a higher number of deaths reduces the non-compliant population, and an older population is associated with higher number of deaths. However, as shown in the SM, though the demographics of the three countries considered are quite similar there are some important differences. For example, 11.7% of the population is in the 75+ class in Italy with respect to the 9.4% in France. Finally, since our findings are computed with respect to country-specific baseline, a relative higher increase in deaths does not necessarily correspond to an absolute higher increase.
We acknowledge some limitations in the present study. First, the vaccine is modeled as protective towards infection, without modeling the protection against severe COVID-19 complications and potential reduction of viral shedding in infected vaccinated individuals. At the time of writing, such information are still matters of study even for the vaccines already approved by regulators. For the sake of simplicity, we also considered the vaccines fully working immediately after the first dose. We have also considered two simple vaccination strategies that neglect the complexities of an unprecedented mass vaccination. As result, both the vaccination priorities and rates are an approximation of reality. While the model calibration suggests that our approach can nicely capture the national trend, our model is not meant to provide accurate forecasts of the local unfolding of the disease, but rather to test what-if scenarios in a comparative fashion. We have considered a simple age-structure compartmental model that does not capture spatio-temporal heterogeneity both in terms of spreading and of NPIs implementation which have instead been observed in the countries under investigation. Our model does not include the emergence of a new, more transmissible, strain in the UK. The variant took over in December and led to a significant spike of cases, hospitalizations and deaths. As result, the government imposed a third lock-down in the first days of 2021 which is more restrictive than our scenario number 2. Finally, we propose and model a potential mechanism leading to behavioural changes, but data are not available to perform a quantitative validation of the behavioural components of the model.
Implementation of individual protective behaviours and adherence to NPIs have been vital in order to reduce the transmission of SARS-CoV-2 leading to substantial population-level effects [5, 49, 53–63]. Behavioural science can provide valuable insights for managing policies, incentives, communication strategies and can help coordinate efforts to control threats and evaluate such interventions [64]. As was the case for the first waves of COVID-19, when NPIs were the only available mitigation measures [65], the results of our paper call for adequate strategies to keep high the attention and compliance towards individual COVID-safe behaviours, such as mask-wearing, social distancing, and avoidance of large gatherings now that vaccines are finally available. Communication strategies and policies should keep targeting such non-pharmaceutical intervention to avoid frustrating the immense effort of the vaccination campaigns.
4 Materials and Methods
4.1 Epidemic Model
We propose a compartmental model that incorporates both the vaccination process and the behaviour dynamics possibly linked to it. The virus transmission is modeled using the following approach. Healthy and susceptible individuals are in the compartment S. Interacting with infectious, they become infected and transit to the compartment of the latent (L). The force of infection is split into two contributions: the transmission rate β and the contact matrix C ∈ ℝK×K, whose element Cij represents the average number of contacts that an individual in age group i make with individuals in j per day. As detailed below, the matrix C has four location-specific contributions: contacts at home, workplace, school, and other locations. We adopt country-specific contacts matrices provided in Ref. [42]. After the latency period (ϵ−1), L become infectious and transit to the compartment I. After the infectious period (µ−1), individuals transit either to the compartment of recovered (R) or dead (D). The fraction of individuals transiting towards these last two compartments is regulated by the age-stratified Infection Fatality Rate [66]. Finally, to account for delays between actual death and the transition to D, we consider an additional compartment Do (deaths “observed”), towards which D individuals transit at rate Δ−1. The model described is a modification of the well-known SLIR compartmental model to account for the specific mortality dynamics linked to COVID-19. Similar approaches have been used in several modeling studies in the context of the current pandemic [67–69].
On top of the disease dynamics, we model both the vaccination process and the behavioural change that is possibly coupled to the vaccination. More in detail, after the start of the vaccination campaign at tV, at each time step, a fraction rV of the susceptible population receive a vaccine and transit to compartment V. As mentioned above, we consider two vaccination strategies: one in which the vaccine is given in decreasing order of age and one in which it is given homogeneously to the population. For convenience, we derive the model’s equations in the homogeneous case, we refer the reader to the following sections for more details. We consider a “leaky” vaccine that reduces susceptibility with a certain efficacy V E. In other words, the infection rate for V individuals is β(1 − V E). In parallel, we imagine a behavioural dynamics triggered by the presence of the vaccine. Indeed, susceptible individuals (both vaccinated and not) may start adopting less safe behaviours because reassured by the presence of an effective vaccine. This is encoded in the model with a transition from the compartment S (V) to a new compartment SNC (V NC) of individuals that protect less themselves and as a result get infected at a higher rate (rβ, with r > 1). Note that NC stands for non-compliant. This transition happens at a rate α and it is catalyzed by the cumulative fraction of vaccinated individuals vt. Note that in order to avoid issues with transition probabilities large than one we model the rate as  with X = [S, V]. Note how for small values of αvt the rate converges to the usual mass-action law. In turn, we assume that a strong resurgence of the epidemic would push individuals towards safer behaviours. Therefore, we consider also an opposite transition from SNC (V NC) to S (V) that happens at rate γ and is catalyzed by the number of observed deaths in the previous time step
  . Also for this transition we use the exponential form
  with X = [S, V]. The model can be written down as the following system of differential equations for individuals in age group k:

Where δ[t − tV] is a step function which is equal to 1 if t > tV and to 0 otherwise. The basic reproduction number is  , where
  is the contacts matrix weighted by the relative population in different age groups. In the SM we provide details on its derivation. We adopt the model integrating numerically the equation, thus it is deterministic. However, it is worth stressing that the model is calibrated in a probabilistic framework through the ABC-SMC technique. Said differently, the free parameters are characterized by posterior probability distributions rather than exact values. For this reason, the results presented (for example median and confidence intervals of model’s projections) are to be intended as an ensemble of multiple trajectories generated sampling from the posterior distribution of the fitted parameters. We used N = 20 samples to generate trajectories.
4.2 Modeling the Effects of NPIs on Contact Matrices
We implement top-down NPIs changing the contacts patterns defined by the contacts matrix C. As mentioned, we use the country-specific contacts matrices provided in Ref. [42]. These are made up by four contributions: contacts that happen at school, workplace, home, and other locations. In a baseline scenario, the overall contacts matrix C is simply the sum of these four contributions. Here, we implement the reductions in contacts, due to the restrictions, multiplying the single contribution by a reduction factor ηi(t). Thus, in general the overall contacts matrix at time t become:

Here, for the contacts locations work, school, and other locations we adopt a reduction parameter that varies monthly and can assume the values [0.25, 0.50, 0.75, 1.0]. Since we consider the period 2020/09/01 − 2020/12/01 for calibration, this implies that we fit three reduction parameters (September, October, and November) for each of these contacts locations.
4.3 Model Initialization
The number of individuals in different age groups is initialized considering the 2019 United Nation World Population Prospects [70, 71]. We consider 16 age brackets of five-years, except for the last one that includes 75+ individuals. The initial number of infected individuals is given by the total number of confirmed cases in the week before the start of the simulation according to the data issued from the European Centre for Disease Prevention and Control [72]. To initialize the number of non-susceptible individuals (placed in the R compartment) we compute the average of several publicly available projections of total COVID-19 infections up to 2020/09/01 (start of the simulation) from different modeling approaches [73]. Both the initial number of infected and of non-susceptibles is assigned homogeneously across age groups. Other parameters used are ϵ−1 = 4 days, µ−1 = 2.5 days (i.e. generation time TG = 6.5 days), Δ = 18 days, in line with current estimates of COVID-19 infection dynamics parameters [74, 75]. We use the age-stratified Infection Fatality Rate (IFR) from Ref. [66]. In the SM, we provide sensitivity analysis on the parameters choice and initialization. We see that R0 obtained through calibration is not significantly affected.
4.4 Model Calibration
We calibrate the model for each country using an Approximate Bayesian Computation (ABC) method based on Sequential Monte Carlo (ABC-SMC) [47, 48]. The ABC-SMC approach is based on the ABC rejection method. At each step of the rejection algorithm, a set of parameters θ is sampled from a prior distribution and an instance of the model is generated using θ. Then, an output quantity E′ of the model is compared to the corresponding real quantity E using a distance measure s(E′, E). If this distance is greater (smaller) than a predefined tolerance ϵ, then the sampled set of parameters is discarded (retained). After accepting N sets, the iteration stops and the distribution of accepted parameters is an approximation of the real posterior distribution P (θ, E). The ABC-SMC algorithm implements this procedure sequentially, decreasing at each generation the tolerance ϵ. This generally allows for faster and more precise computation. The free parameters of our model and the related prior distributions are:
the transmission rate β. We explore uniformly values of β such that the related R0 is between 1.1 and 2.0;
the monthly contacts reduction parameters for work, school and other locations contributions to C. For September and October we consider a uniform discrete prior on the values [0.25, 0.50, 0.75, 1.0]; for November we consider a uniform discrete prior on the values [0.25, 0.50, 0.75]. Indeed, Italy, France, and United Kingdom all issued in late October/early November tougher restrictions to curb the second wave.
The model is calibrated on the period 2020/09/01 − 2020/12/01 using the following distance metric:

Where ρ(Inc., Inc. ′) is the Pearson correlation coefficient between the real and simulated weekly incidence, while Dtot and  are respectively the total number of real and projected deaths in the calibration period.
We implement the ABC-SMC calibration using the python library pyabc [76]. The epidemic model is implemented using the python library scipy [77] and optimized with numba [78]. Visualizations are realized with the python library matplotlib [79].
4.5 Vaccination Strategies
We consider two vaccination strategies. In the first one, the vaccine is given in decreasing order of age. Since the IFR of COVID-19 strongly correlates with age, many countries worldwide are adopting similar strategies prioritizing the vaccination among the elderly. In practice, this means that in our simulations we start giving the vaccine to the 75+ age bracket and we proceed in decreasing order only when everyone in this group is vaccinated. If, on a given time step, the number of people remained in the age group is smaller than the total number of vaccines available, the exceeding part is given to the next age group. This implies that the number of vaccines given in different time steps is always constant. In the second strategy, the vaccine is given homogeneously to the population respecting the age distribution. This means that, of the X vaccines available at step t, the fraction Nk/N is given to age group k (where Nk is the number of susceptible individuals in age bracket k). If note specified differently, in the main text we consider the first strategy.
Data Availability
All the data and code used in this paper are publicly available at https://github.com/ngozzi/vaccine-behaviour
Data Availability
The data is available upon request
Data Availability
All the data and code used in this paper are publicly available at https://github.com/ngozzi/vaccine-behaviour.
A Supplementary Material
A.1 Sensitivity Analysis
We run sensitivity analysis on the epidemiological parameters considered. In Figure 7 we represent median and 95% CI of the basic reproduction number R0 for:

We represent R0 (median and 95% CI) for different pairs of ϵ, µ, different values of I(t = 0) and R(t = 0)
different combinations of ϵ, µ. In particular, we compare the values used in the main text (ϵ−1 = 4 days, µ−1 = 2.5 days) to both a longer infectious period (µ−1 = 3 days, which implies a TG = 7 days) and a longer latent period (ϵ−1 = 5 days, which implies a TG = 7.5 days);
different initial number of infected (I(t = 0)). In the main text, we used the total number of confirmed cases in the week before the start of the simulation according to the data issued from the European Centre for Disease Prevention and Control [72]. Here we consider an initial number of infected which is −50%/ + 50% of this value;
different initial number of non-susceptibles (R(t = 0)). In the main text we used the average cumulative number of infections at the start of the simulation estimated by different epidemic models [73]. Here we consider the maximum and minimum of these projections, rather than the average;
different values of Δ, which is the delay between the transition from the D to the Do compartment. We test both a shorter (Δ = 14days), and a longer (Δ = 22days) period (in the main text we used Δ = 18days).
In Figure, the grey dashed line indicates the median R0 related to the combination of parameters used in the main text. As we can see, this value falls within the 95% CI obtained for all the other parameters, except for one case in France, when we consider 50% more initial infected. In this case, we obtain a slightly lower R0 (median of 1.44 versus 1.55 used in the main text).
Furthermore, in Figure 8 we present the relative deaths difference (scenario 1) for a different behavioural parameter γ = 5 × 10⁻³ (in the main text we used γ = 10−3). As we can see, results are not particularly affected by this change. For example, for Italy, V E = 90%, rV = 1%, r = 1.5, when α = 10 we obtain a relative deaths difference of about 72% with respect to 69% obtained with γ = 10−3.

Giving up safe behaviours during rollout may nullify the benefits brought by the vaccine (scenario 1). Relative deaths difference is computed as the fraction of deaths that are avoided with a vaccine with respect to a baseline simulation without vaccine (and thus no behavioural response). Results for two different rollout speeds and for different behavioural responses are shown.
A.2 Additional Figures
We report here additional Figures that are mentioned in the main text. In particular:
in Figure 9 we represent the posterior distribution of the basic reproduction number R0 obtained through the ABC calibration for the three countries considered;
in Figure 10 we present the behavioural parameters space exploration for a rollout speed of rV = 1% (in the main text we showed results for rV = 0.25%);
in Figure 11 we present the evolution of Rt under different behavioural responses for a rollout speed of rV = 1% (in the main text we showed results for rV = 0.25%);
in Figure 12 we present the relative deaths difference for scenario 1, V E = 90%, and a homogeneous vaccination strategy (in the main text we showed results for vaccination strategy prioritizing the elderly);
in Figure 13 we represent the mobility changes from the COVID-19 community mobility report published by Google [80] for the countries considered. We report this to provide a qualitative comparison with the contacts reductions parameters obtained in the main text. Similarly to the results of our calibration, we observe, in different contexts (e.g. workplaces), the resurgence in mobility after the first wave during summer 2020. We then observe a sharp drop around the beginning of November 2020, concurrently with the second wave and new restrictions.
A.3 R0 calculation
We compute the basic reproduction number R0 of the model proposed using the Next Generation Matrix method [81]. We consider the 2K equations that describe the evolution in time of the number of infected individuals:


Dashed vertical lines indicate the median.

For the three countries, we explore different values of α and γ in terms of observed deaths increase with respect to a baseline without behavioural response (i.e. α, γ = 0). We set rV = 1.0% and V E = 90%.
Median and 95% CI for effective reproductive number (Rt) with different behavioural responses for the three countries in scenario 1 (left) and scenario 2 (right). The grey dashed line indicates the maximum Rt observed before 2021/01/01. Model parameters: γ = 10−3, r = 1.5, rV = 1%, V E = 90%.

Giving up safe behaviours during rollout may nullify the benefits brought by the vaccine (scenario 1). Relative deaths difference is computed as the fraction of deaths that are avoided with a vaccine with respect to a baseline simulation without vaccine (and thus no behavioural response). Results for two different rollout speeds and for different behavioural responses are shown (γ = 10−3).
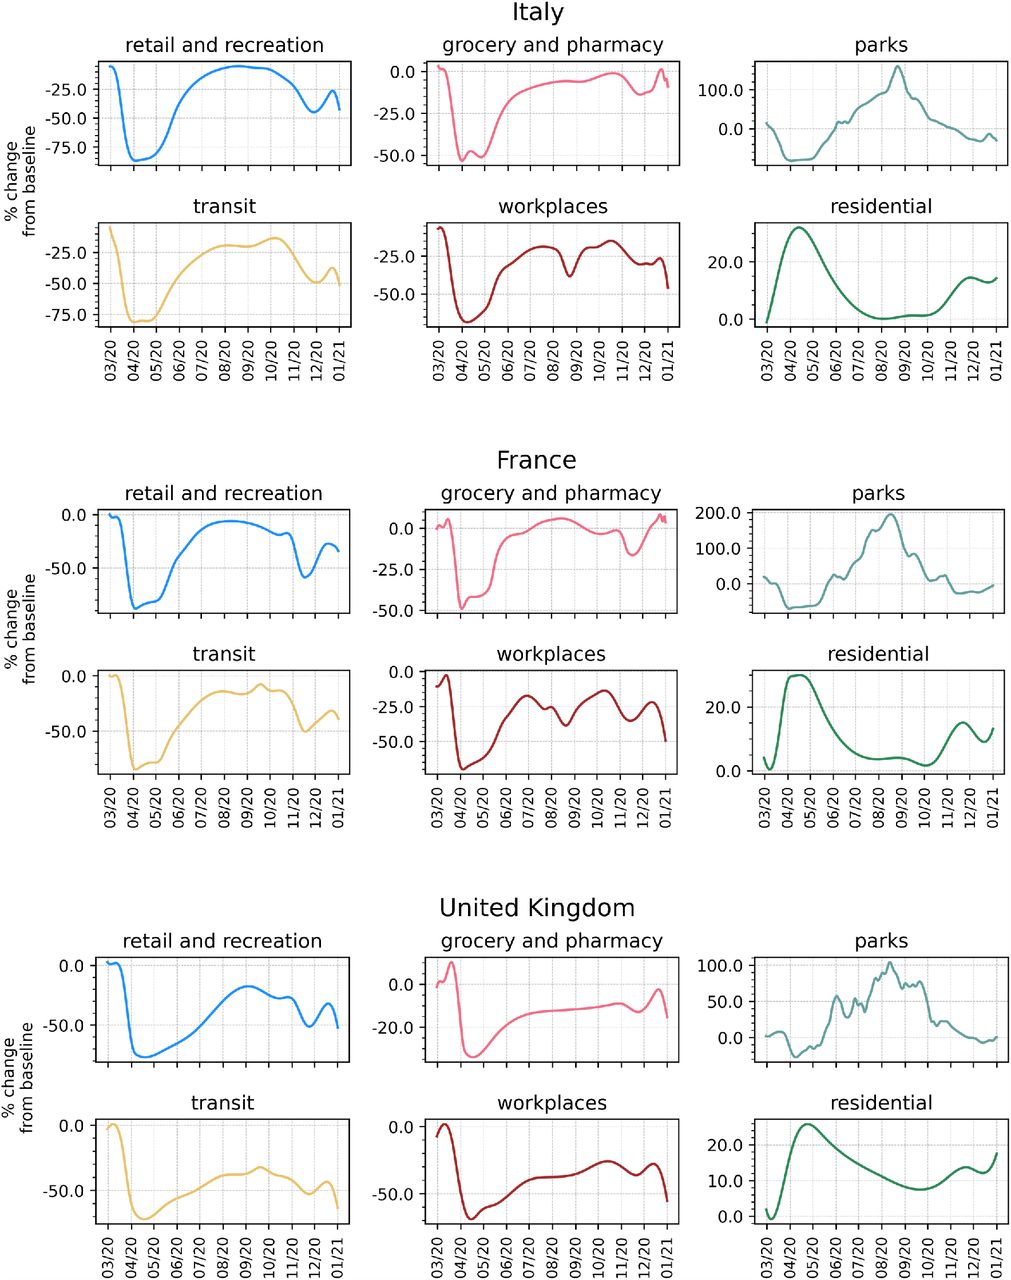
We display smoothed time series (two-weeks moving average) of mobility changes in different contexts according to the data provided by Google in the COVID-19 Community Mobility Report.
In matrix notation:

Then, we define the disease free equilibrium (DFE) for age group k as  . Indeed, the vaccination (and thus the behavioural dynamics) starts only after time tV and we suppose that the Rk << Nk. We also define the two matrices F and V as follows:
  and
and  . These can be written as:

The basic reproduction number is defined as R0 = ρ(FV −1), where ρ(·) indicates the s pectral radius.
First, we compute V −1. We recognize that V and F can be written in blocks as:  , with W, Y, Z diagonal, and
  . Thanks to the properties of block matrices, the inverse of V can be written as
  . Since the inverse of a diagonal matrix is obtained by replacing each element in the diagonal with its reciprocal, we obtain:

The product FV −1 can be easily computed thanks to the blocks structure of the matrices:

We are left with finding the spectral radius (i.e. largest eigenvalue) of FV −1. Using the property of block matrix determinants, the eigenvalue problem can be written as:

Where, in the last passage, we are neglecting the solution λ = 0. Therefore, finding the spectral radius of FV −1 reduces to finding the largest eigenvalue of  . Making explicit the form of

Where  is the contacts matrix weighted by the relative population in different age groups. Finally, we obtain
  .
.
A.4 Population demographic
In Figure 14 we represent the fraction and the number of individuals (in millions) in different age brackets for the three countries considered, Italy, France, and United Kingdom.
Acknowledgements
All authors thank the High Performance Computing facilities at Greenwich University. N.G. acknowledges support from the Doctoral Training Alliance. P.B. acknowledges support from Intesa Sanpaolo Innovation Center. The funders had no role in study design, data collection and analysis, decision to publish, or preparation of the manuscript.
References
- [1].↵
- [2].
- [3].
- [4].
- [5].↵
- [6].↵
- [7].↵
- [8].↵
- [9].
- [10].↵
- [11].↵
- [12].↵
- [13].↵
- [14].↵
- [15].↵
- [16].↵
- [17].↵
- [18].↵
- [19].↵
- [20].
- [21].↵
- [22].↵
- [23].↵
- [24].↵
- [25].↵
- [26].↵
- [27].
- [28].↵
- [29].↵
- [30].↵
- [31].
- [32].
- [33].
- [34].
- [35].
- [36].
- [37].↵
- [38].↵
- [39].↵
- [40].↵
- [41].↵
- [42].↵
- [43].↵
- [44].↵
- [45].↵
- [46].↵
- [47].↵
- [48].↵
- [49].↵
- [50].↵
- [51].↵
- [52].↵
- [53].↵
- [54].
- [55].
- [56].
- [57].
- [58].
- [59].
- [60].
- [61].
- [62].
- [63].↵
- [64].↵
- [65].↵
- [66].↵
- [67].↵
- [68].
- [69].↵
- [70].↵
- [71].↵
- [72].↵
- [73].↵
- [74].↵
- [75].↵
- [76].↵
- [77].↵
- [78].↵
- [79].↵
- [80].↵
- [81].↵


