
Abstract
Detailed characterizations of SARS-CoV-2 transmission risk across different social settings can inform the design of targeted and less disruptive non-pharmaceutical interventions (NPI), yet these data have been lacking. Here we integrate real-time, anonymous and privacy-enhanced geolocalized mobility data with census and demographic data in the New York City and Seattle metropolitan areas to build a detailed agent-based model of SARS-CoV-2 transmission. The aim is to estimate where, when, and how many transmission events happened in those urban areas during the first wave of the pandemic. We estimate that most infections (80%) are produced by a small number of people (27%), and that about 10% of events can be considered super-spreading events (SSEs), i.e. generating more than eight secondary infections. Although mass gatherings present an important risk for future SSEs, we find that the bulk of transmission in the first wave occurred in smaller events at settings like workplaces, grocery stores, or food venues. We also observe that places where the majority of transmission and SSEs happened changed during the pandemic and are different across cities, a signal of the large underlying behavioral component underneath them. Our results demonstrate that constant real-time tracking of transmission events is needed to create, evaluate, and refine more effective and localized measures to contain the pandemic.
Without effective pharmaceutical interventions, the COVID-19 pandemic has required the implementation of severe mobility restrictions and social distancing measures worldwide to slow down the propagation of SARS-CoV-2. From shelter in place orders to closing restaurants/shops or restricting travel, the rationale of those measures is to reduce the number of social contacts, thus breaking transmission chains, with the goal of mitigating the number of infections and protecting the health care system from being overwhelmed. Understanding how those interventions impact transmission of SARS-CoV-2 across diverse settings can help us devise better NPIs that pursue public health objectives while minimizing disruption to the economy, the education system, and other facets of everyday life.
Although it is by now clear that NPIs have helped to reduce the COVID-19 pandemic 1, most of the evidence is based on measuring the subsequent reduction in the case growth rate or secondary reproductive number. For example, econometric models were used to estimate the effect of the introduction of NPIs on the secondary reproductive number 2, 3. Other studies have shown directly (through correlations or statistical models 4) or indirectly (through epidemic simulations 5, 6) the relationship between mobility or individuals’ activity and number of cases. Unfortunately, most of the data used so far do not have the granularity required to assess how social contacts and SARS-CoV-2 transmission events are modified by NPIs 7.
This is especially important given the heterogeneous spreading of SARS-CoV-2. Overdispersion in the number of secondary infections produced by a single individual was an important characteristic of the 2003 SARS pandemic 8 and has been similarly observed for SARS-CoV-2 9. Several drivers of super-spreading events (SSEs) have been proposed: biological, due to differences in individuals’ infectiousness; behavioral, caused by unusually large gatherings of contacts; environmental, in places where the surrounding conditions facilitate spread 10. Transmissibility depends critically on the characteristics of the place where contacts happen, with many SSEs documented in crowded, indoor events with poor ventilation. A characteristic of this overdispersion is that most infections (around 80%) are due to a small number of people or places (20%), suggesting that better targeted NPIs or cluster-based contact tracing strategies can be devised to control the pandemic 11. Although several studies have provided insights on SSEs 7, 12, given their outsized importance for SARS-CoV-2, we need better information about where, when, and to what extent these SSEs happen and how they may be mitigated or amplified by NPIs.
In this paper we use a longitudinal database of detailed mobility and socio-demographic data to generate the daily contacts of 614,458 individuals in New York metropolitan area and 110,330 individuals in Seattle metropolitan area, during the period from Feb 15 to Jun 1 of 2020 (see Supp. Section 1). Rather than only the cities, we consider the metropolitan areas around New York City and Seattle (see Supp. Section 1). We chose those areas because of their large differences in the epidemiology of the COVID-19 pandemic as well as features such as size and density of the two populations. The NY metro area has a population of 20 million people, while the Seattle metro area has 3.8 million inhabitants. Moreover, the NY metro area has a higher density (5,438 people per km2, median by census tract) than Seattle (1,576 people per km2). Finally the number of reported COVID-19 cases/deaths in the NY area was very large (223 per 100,000) compared to that in the Seattle area (24 per 100,000). Individuals are chosen to be representative of the different census areas (Census Block Groups, see Figure 1). Contacts between individuals are weighted according to the time/probability of exposure between them in the different places around the metro areas. This defines a weighted temporal network consisting of four layers representing the physical/social interactions occurring in (1) the community, (2) workplaces, (3) households, and (4) schools, see Figure 1. The community and workplaces layers are generated using 4 months of data observed in the New York and Seattle metropolitan areas from anonymized users who have opted-in to provide access to their location data, through a GDPR-compliant framework provided by Cuebiq (see Supp. Section 1). In these layers, each individual in our synthetic population represents an anonymous individual of the real population. The data allows us to understand how infection can propagate in each layer by estimating co-location of individuals in the same setting at any given time. Settings are obtained from a large database of 445,496 locations in the New York and 69,906 in the Seattle from the Foursquare API. By measuring the amount of time people are colocated in the different layers, we construct the time-varying network of interactions ωijt between individuals i and j on the same day t in the education, community, work and household layers (see Figure 1 and Supp. Section 1 for more information about the data and layers). Our model covers all possible interactions in urban areas and not just foot traffic to commercial locations that people visit 7, something especially important given the relevant role of households, schools or workplaces in the transmission of the SARS-CoV-2.
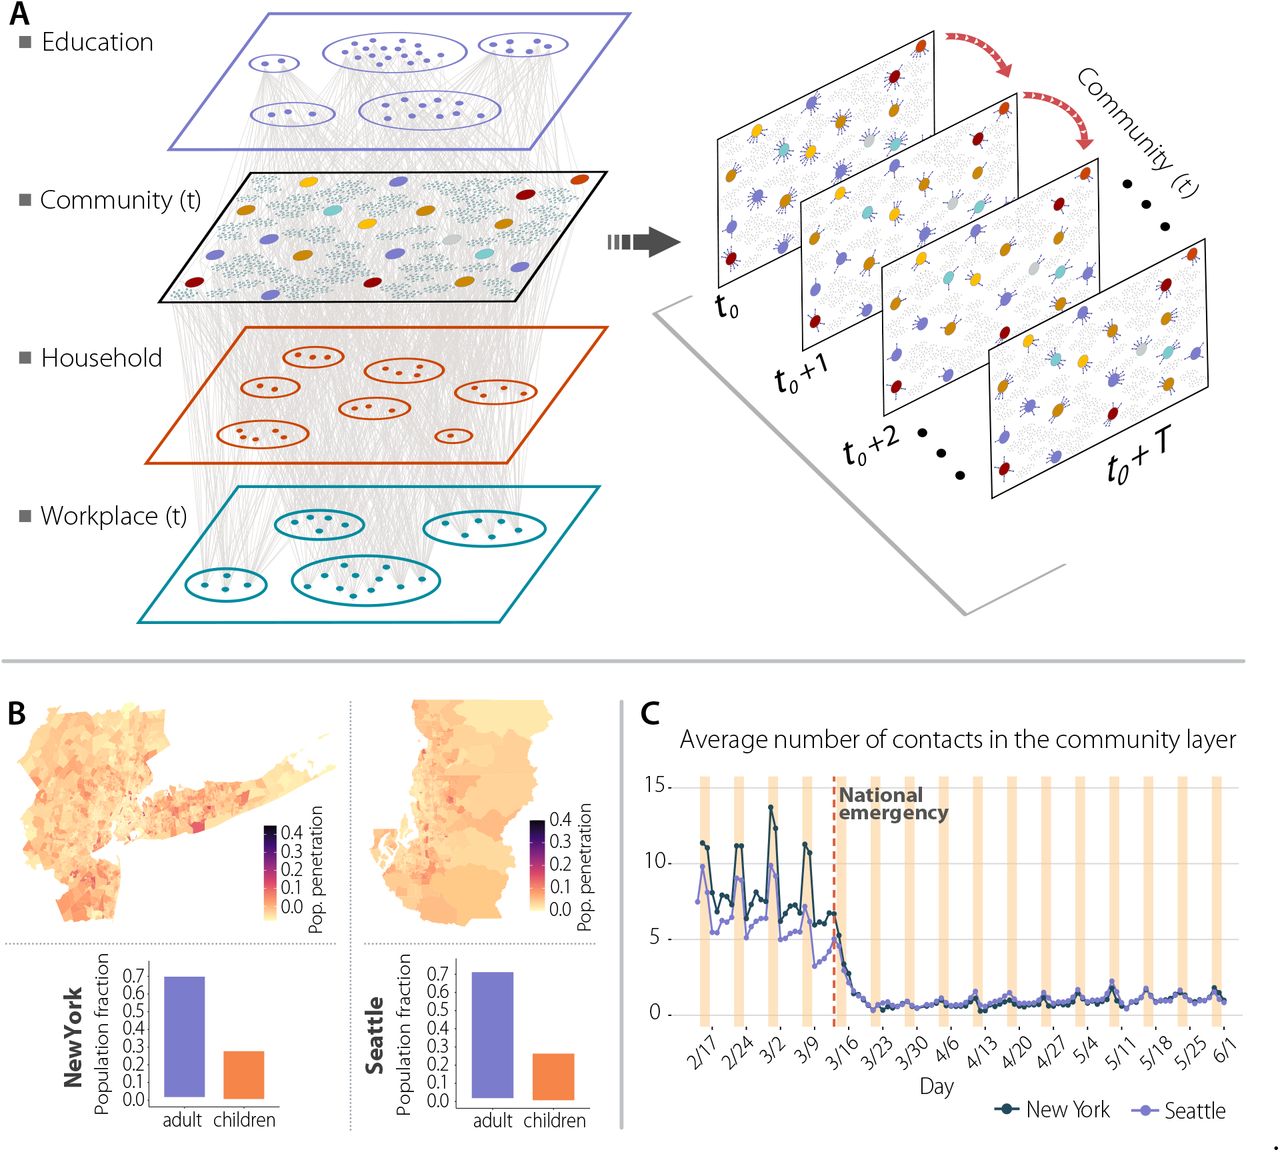
Panel a is a schematic illustration of the weighted multilayer and temporal network for our synthetic population built from mobility data. There are three different compartments, Schools and Households layers that are static over time, and the workplace and community layer has a daily temporal component. Panel b shows the geographic penetration of mobile devices from our mobility data compared to the total population for the New York and Seattle metropolitan areas. Panel c represents the average daily number of contacts in the community layer for both metropolitan areas.
To model the natural history of the SARS-CoV-2 infection, we implemented a stochastic, discrete-time compartmental model on top of the contact network ωijt in which individuals transition from one state to the other according to the distributions of key time-to-event intervals (e.g., incubation period, serial interval, time from symptom onset to hospital admission) as per available data on SARS-CoV-2 transmission (see reference 13 for details). In the infection transmission model, susceptible individuals (S) become infected through contact with any of the infectious categories (infectious symptomatic (IS), infectious asymptomatic (IA) and pre-symptomatic (PS)), transitioning to the latent compartment (L), where they are infected but not infectious yet. Latent individuals branch out in two paths according to whether the infection will be symptomatic or not. We also consider that symptomatic individuals experience a pre-symptomatic phase and that once they develop symptoms, they can experience diverse degrees of illness severity, leading to recovery (R) or death (D). The value of the basic reproduction number is calibrated to the weekly number of deaths (see Supp. Section 4 for further information on the calibration process and Supp. Section 7 for the robustness of our results towards different parametrization of the model).
1 Results
Impact of NPIs
Our data show clearly how the contact networks in the two metro areas have changed due to the introduction of NPIs during the week of March 15th to March 22nd, see Figure 1. A National Emergency was declared on March 13th, and the NY City School System announced the closure of schools in March 16th 14. NY City Mayor Bill de Blasio issued a “shelter in place” order in the city on March 17 15, and non-essential business were ordered to close or suspend all in-person functions in New York, New Jersey and Connecticut by March 22nd. As we can see in Figure 1 the individuals’ total number of contacts decreased dramatically from around 7 (in our community layer) to below 2. In Seattle, the reduction of contacts started one week earlier than in NY City, coinciding with earlier closing of some schools 16, and the Seattle mayor issuing a proclamation of civil emergency on March 3rd 17.
In Figure 2 we report numerical simulations of the epidemic curve that accurately reproduce the evolution of the prevalence (defined as the total number of asymptomatic and symptomatic cases) in both NY and Seattle metro areas, even though both cities were affected very differently by the epidemic in the first wave. The analysis clearly identifies the impact of the reduction in the number of contacts due to the implemented NPIs: both in NY and Seattle metro areas, Rt dropped below 1 one week after NPIs were introduced. In order to estimate the importance of timely implementations of NPIs in metropolitan areas, we have generated counterfactual scenarios in which the NPIs and the ensuing reduction in the number of contacts would have happened one week earlier or later than the actual timeline 18. The comparison between NY and Seattle is relevant, because we observed that the reduction in contacts in Seattle started to happen exactly one week before that in NY. To this end we have shifted in time the contact patterns around the week where NPIs where introduced in both cities. The results for these scenarios are reported in Figure 2d, where we see that a one week delay in introducing NPIs would have yielded a peak in the number of deaths two times larger than the actual one (0.7 deaths per 1,000 people compared to the 0.35 per 1,000). This 2x factor in one week delays is also observed in Seattle metro area and in the total prevalence in the metro area. Conversely, a one week earlier implementation of the NPIs timeline in NY area would have reduced the death peak by more than a factor of three, a result similar to that found using coarse-grained simulations at the county level 18.

(a) Weekly number of deaths in New York (NY) and Seattle (ST). The dots/triangles represent the reported surveillance data used in the calibration of the models. The solid (dashed) line represents the median of the model ensemble and the shaded areas the 95% C.I. of the calibrated model27. (b) Evolution of the effective reproduction number according to the output of the simulation. The solid (dashed) line represents the median of the model ensemble and the shaded areas the 95% C.I. of the model. (c) Estimated prevalence in our model (median represented with solid/dashed lines and 95% C.I with the shaded area) and values reported by the CDC (dots/triangles represent New York and Seattle data respectively)28. (d) Estimated number of deaths if the NPIs had been applied in New York one week earlier/later. Solid (dashed) lines represent the median of the model ensemble and the shaded areas the 95% C.I. (e) Estimated evolution of the effective reproduction number if the measures had been applied in New York one week earlier/later. Solid (dashed) lines represent the median of the model ensemble.(f) Estimated prevalence in New York (left) and Seattle (right) if the NPIs had been applied in New York one week earlier/later and in Seattle one week later. The height of the bars represent the median of the model ensemble, while the vertical error bars represent the 95% C.I. The dot/triangle shows the value reported by the CDC.
Taxonomy of transmission events
The high resolution of our dataset allows us to estimate the relevance of different settings and the effects of NPIs on the transmission dynamic of SARS-CoV-2. People spent different time in each layer and place before and after the introduction of NPIs (see Supp. Section 1). As a result, the number of infections varied significantly during the observed period. As we can see in Figure 3, before NPIs were introduced most infections took place in the community and workplace layers. Once restrictions were implemented on both cities on March 16th, as expected, the proportion of infections in the household layer is greatly increased, especially in the NY area. Probably because the number of cases overall was lower in Seattle, the number of infections in the workplace and household layers were comparable. We can further stratify data by venue type in the community layer as in Figure 3, by looking at the top 12 categories (see Supp. Section 1 for their definition) in terms of the number of total infections throughout the whole period. Before the NPIs were introduced, our model estimates that most of the infections in the community layer happened in Food/Beverage, Shopping, and Exercise venues. Also a significant number of infections happened in Art/Museums and Sport/Events venues. After the introduction of NPIs, the number of infections in Exercise, Sport/Events or Art/Museums venues decreases as expected. However, Food, Groceries and Shopping venues became the main community setting for transmission in both cities.
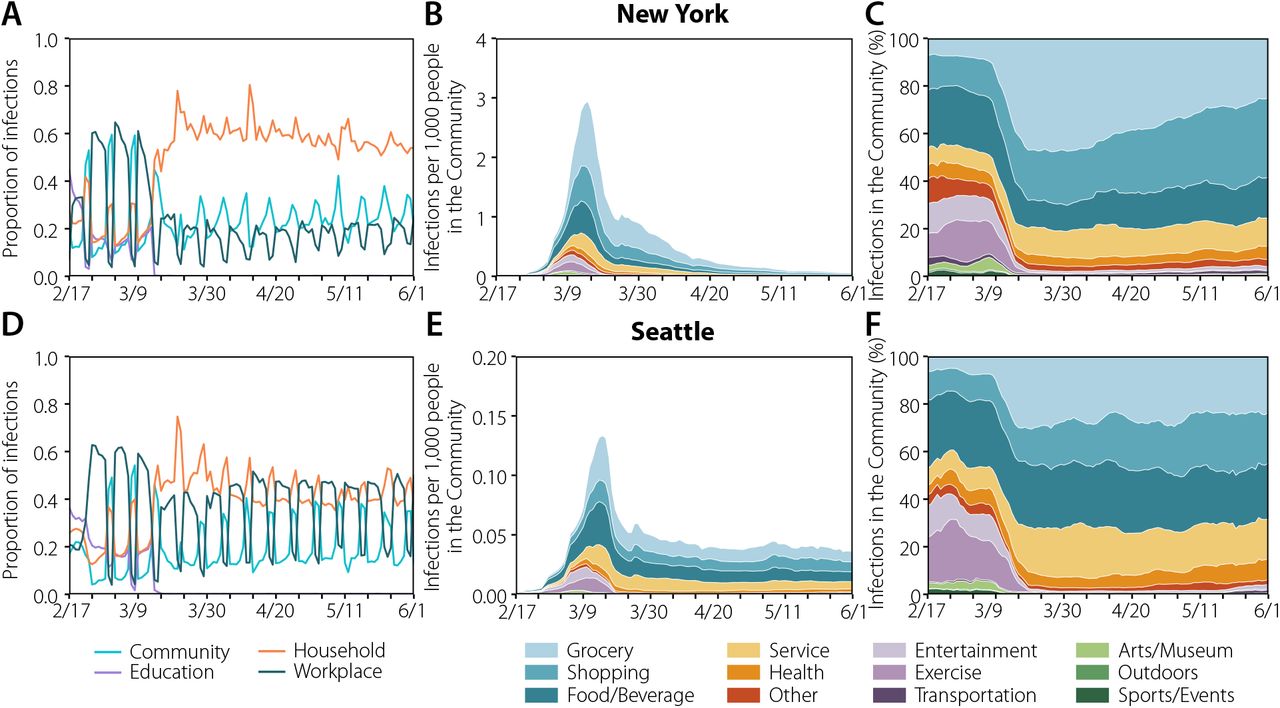
The plots in the left column represent the share of infections across layers in New York (a) and Seattle (d). In the middle column, the estimated location where the infections took place for New York (b) and Seattle (e) in the community layer. Note that the y-axis is 20 times smaller in Seattle. The evolution has been smoothed using a rolling average of 7 days. In the right column, the distributions are normalized over the total number of daily infections, showing how infections were shared across categories in the community layer. The evolution has been smoothed using a rolling average of 7 days.
Super-spreading events
Our agent-based simulations also allow us to follow the infection trajectory of each individual and how many secondary infections she generates. In Figure 4 we report the distribution of the number of secondary infections produced by each individual in the community layer only. As we can see the distribution is highly skewed and can be modeled by a negative binomial distribution with dispersion parameters (k) of 0.17 (NY) and 0.20 (Seattle), in agreement with the evidence accumulated from SARS-CoV-2 transmission data 9, 10, 19, 20. As a result, super-spreading events (SSEs) are likely to be observed. We define a transmission event as a SSE if the individual infects more than the 99-th percentile of a Poisson distribution with average equal to R (see 8 and Supp. Section 6 for further details), here corresponding to an infected individual infecting 8 or more others. Interestingly, if we compare the distribution of secondary infections produced before and after the introduction of NPIs, even though we see a clear reduction of SSEs, we still find a heterogeneous distribution of secondary infections. Thus, the NPIs did not prevent the formation of SSEs, but only significantly lowered their frequency.
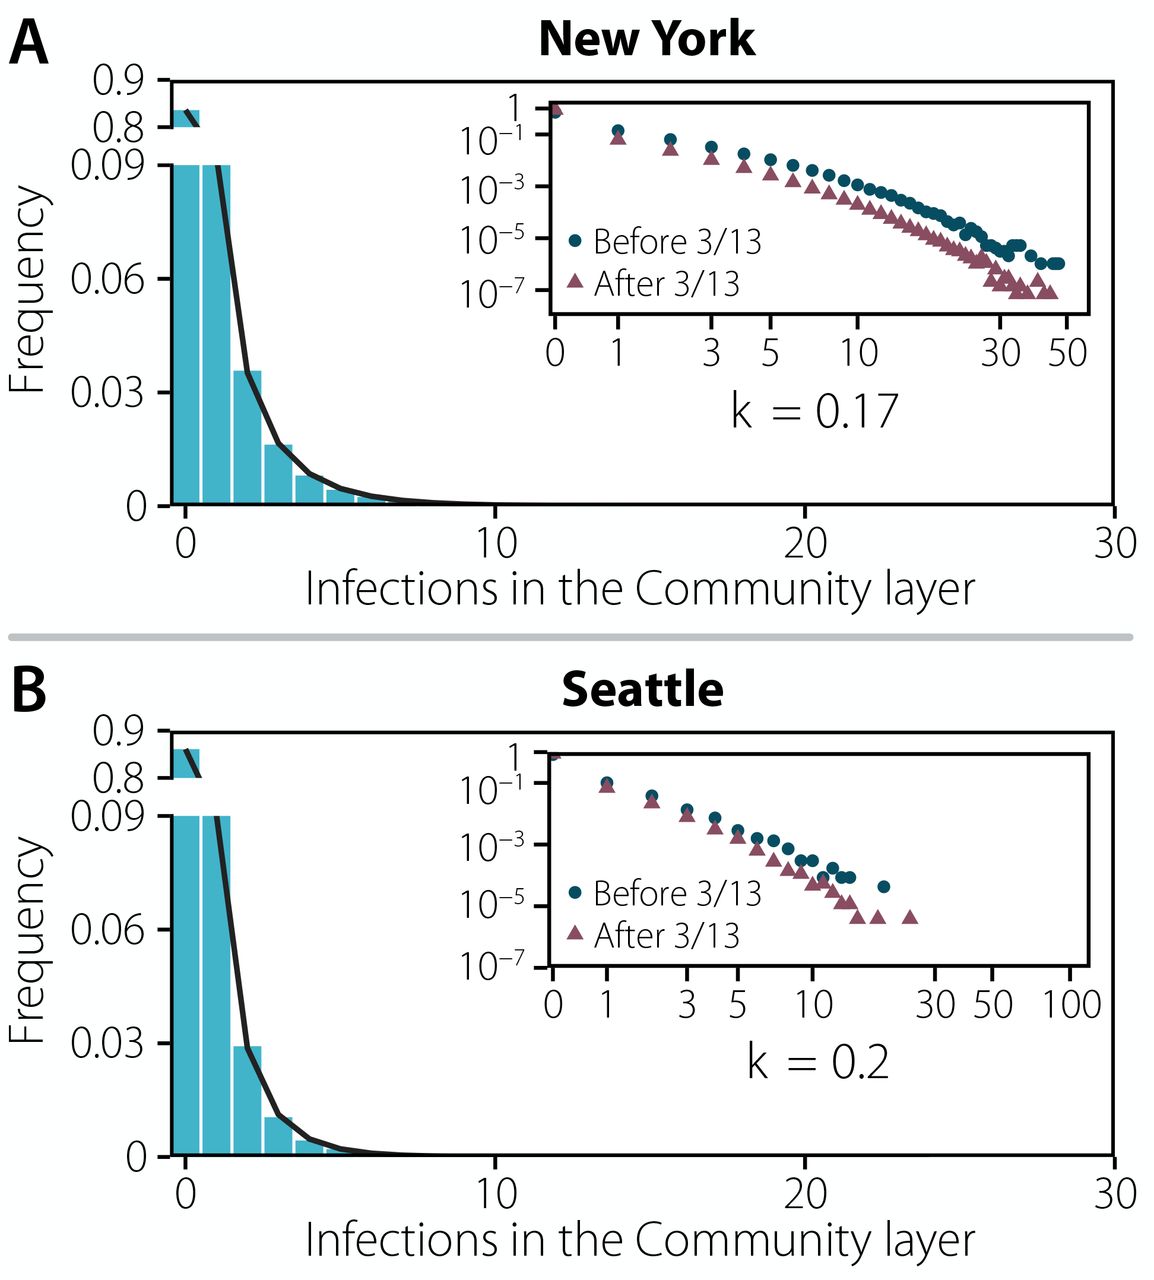
Distribution of the number of infections produced by each individual in New York (a) and Seattle (b) up to the declaration of National Emergency. The distribution is fitted to a negative binomial distribution yielding a dispersion parameter of k = 0.1694 [0.1690 − 0.1698] 95%CI and k = 0.1973 [0.1930 − 0.2016] 95%CI, respectively. In both plots the inset represent the same distribution in log-scale and distinguishing infections that took place before the declaration of National Emergency on 03/13 and after that date.
Consistent with this pattern of over-dispersion in the number of transmission events, we find that the majority of infections is produced by a minority of infected people: ∼ 20% of infected people were responsible for more than ∼ 85% of the infections in both metro areas (see Figure 8 in Supp. Material). However, note that a critical driver here of this phenomenon is that a large majority of people (85% in the community layer) do not infect any others in our simulations. Only a small fraction of infection events (0.08%) are made of 8 (or more) secondary infections.
Transmission events and SSEs did not happen equally in different settings or along time or geography. In Figure 5 we show the total number of infections produced in each category and the share of those infections that can be related to SSEs (see also Supp. Table 2). The combination of those two features define a continuous risk map in which places can be at different types of risk: (i) low contribution from SSEs and low contribution to the overall infections, such as Outdoor places; (ii) larger contribution from SSEs but low contribution to the overall infections, such as Sports/Events, Arts/Museum or Entertainment before NPI; (iii) large contribution to the overall infections but with low contribution from SSEs, such as Shopping or Food/Beverage after NPI; and (iv) large number of infections and with large contribution from SSEs, such as Grocery right at NPI. This classification has important implications from a public health perspective. For instance, venues in (ii) do not have a major contribution to the overall infections but might represent a challenge for contact tracing. Conversely, for categories in (iii) it might be easier to trace chains of infections but their total contribution is larger. Note that this definition is not static, but changes over time due to the restrictions imposed by authorities. Indeed, looking at the weekly pattern of infections (see Fig. 5) we observe how some categories might move to a different quadrant due to the behavior of individuals. Although SSEs and infections were more likely in Arts/Museum, Sport/Events in NY, and Entertainment and Grocery in both cities, Grocery category still greatly contributes to the total number of infections, but do not have as many SSEs after March 16. On the other hand, SSEs were rare before March 9 in Seattle, but their contribution doubled in the week of March 9-15 - when many individuals probably went for supplies amid fears of future restrictions. This observation includes implicitly a very important message: A place may not dangerous on its own; rather, the risk is a combination of both the characteristics of the place/setting and of the behavior of individuals who visit it. This is at variance with some studies which find that settings could play always the same role in the evolution of the pandemic 7.

Risk evolves with time as a function of the behavior of the population and policies in place. Top row: risk posed by each category per week, defined using the corresponding map below. Bottom row: the x axis represents the fraction of total infections that are associated with each category, while the y axis accounts for the share of those infections that can be attributed to SSEs in each category. This defines a continuous risk map in which places with few infections and low contribution from SSEs will be situated on the left bottom corner. Places where the number of infections is high but the contribution from SSEs is low are situated in the bottom right corner. Conversely, places with large contribution from SSEs but a low amount of infections are situated on the top left corner. Lastly, places with both large number of infections and an important contribution from SSEs are situated in the top right corner. The color associated to each tile in the top row is extracted from the position of the point in the plane defined in the bottom figure. The points in the bottom row show the evolution of the position of the categories Arts/Museum and Grocery for each week, with the arrows indicating the time evolution.
2 Discussion
Our results show the intertwined nature of human behavior, NPIs, and the evolution of the epidemics. Given the heterogeneous nature of human mobility, type of places and even urban physical environment, the COVID-19 epidemics had very disparate routes across settings, people and cities. Specifically, our results suggest that heterogeneous connectivity and behavioral patterns among individuals lead naturally to SSEs. In particular, the implemented partial or full closures over time of different settings (e.g., sport venues, museums, workplaces) had a dramatic effect in shaping the mixing patterns of the individuals outside the household 21, 22. As a consequence, also the settings responsible for the majority of transmission events and SSEs varied over time. In absolute terms, the food and beverage setting is estimated to have played a relevant role both in determining the number of transmission events and SSEs in the early epidemic phase; however, this setting was among the first targets of interventions and thus its contribution zeroed over time. On the other hand, settings such as grocery stores, which consistently provided a low absolute contribution to the overall transmission and SSEs, became, in relative terms, a source of SSEs events during the lockdown when most of other activities were simply not available. These findings suggest that there is room for optimizing targeted measures such as extending working time to dilute the number of contacts or the use of smart working aimed at reducing the chance of SSEs. That could be especially relevant to avoid local flare ups of cases when the reproduction number is slightly above or below the epidemic threshold.
Although the overall picture emerging from studying Seattle and New York is consistent, it is important to stress that each urban area might have specific peculiarities due to local transportation, tourism, or other economic drivers differentiating the cities life cycle. Our results suggest that a one-size-fits-all solution to minimize the spread of SARS-CoV-2 might have very different impact across cities. Furthermore, the results presented may not be generalized to rural areas. Though large parts of the Seattle metro area could be considered as rural, individual connectivity patterns may be differently constrained by the generally lower population density in some other parts of the country.
Our modeling analysis does not have the ambition to substitute field investigations, which remain the primary source of evidence. Some of the reported findings (e.g., the role of food and beverage venues) appear to be in agreement with epidemiological investigations 23, 24. Future empirical analyses could provide further validation of our findings. Our modeling investigation is based on real-time data on human mobility/activity that provides an indirect proxy for infection transmission. One of the strengths of this approach is that, differently from epidemiological investigations, the data can be retrieved in real time and longitudinally, thus allowing to quickly capture possible changes in the most relevant settings for transmission. Furthermore, our approach could help minimize the noisy and biased data collection related to massive transmission events 25.
To properly interpret our results, it is important to acknowledge the limit of the assumptions included in our modeling exercise. First, we have considered a decrease of the transmission probability in outdoors as compared to indoors settings. Although this choice is guided by empirical evidence and our results appear to be robust to this choice (see Supp. Table 7), further studies better quantifying the relative risk of indoor vs. outdoor transmission are warranted. Second, our model neglects to consider difference in the behavior that people follow when in contact with each other. It is indeed possible that contacts between relatives and friends have a larger chance of resulting in a transmission event as compared with interactions with strangers26. Third, we do not model nursing homes, which were severely hit by the COVID-19 pandemic across the globe. However, although they represent a key setting to determine COVID-19 burden in terms of deaths and patients admitted to hospitals and ICUs, they are possibly not central to capture the transmission dynamics of SARS-CoV-2 at the population level, which is the aim of this study. Finally, we do not consider differential infectiousness by age. Although evidence is accumulating supporting this assumption 26, this is another area where further epidemiological investigations would be welcome.
In conclusion, the majority of NPIs introduced in large urban areas in March were effective to dramatically slow the first wave of COVID-19. Closing down schools, businesses, workplaces and social venues, however, took (and still takes) an enormous toll on our economy and society. Our results and methodology allow for a real-time data-driven analysis that connects NPIs, human behavior and the transmission dynamic of SARS-CoV-2 to provide quantitative information that can aid in defining more targeted and less disruptive interventions not only at a local level, but also to assess whether local restrictions could trigger undesired effects at nearby locations not subject to the same limitations.
Data Availability
The data that support the findings of this study is available from Cuebiq through their COVI19 collaborative, but restrictions apply to the availability of these data, which were used under licenses for the current study, and so are not publicly available. Aggregated data used in the models are however available from the authors upon reasonable request and permission of Cuebiq. Other data used comes from the American Community Survey (5-year) from the Census.
Authors’ contributions
A.A., D.M-C., M.A., A.V., Y.M., and E.M. designed research; A.A. performed research with contributions from D.M-C. and M.B.; A.A., D.M-C., M.A., A.V., Y.M. and E.M analyzed the results. A.A. and E.M wrote the first draft of the manuscript; A.A., D.M-C., M.B., A.PyP., M.A., M.L., M.C., N.E.D., M.E.H., I.M.L., A.P., A.V., Y.M. and E.M. discussed results and edited the manuscript. All authors approved the final version.
Competing Interests
M.E.H. reports grants from the National Institute of General Medical Sciences during the conduct of the study; M.A. received research funding from Seqirus; A.V. reports grants and personal fees from Metabiota, Inc., outside of the submitted work; M.C. and A.PyP report grants from Metabiota, Inc., outside of the submitted work. The authors declare no other relationships or activities that could appear to have influenced the submitted work.
Acknowledgements
Y.M. thanks M. Clarin for help with the design of Figure 1. N.E.D., I.M.L., MEH, A.PyP. and A.V. acknowledge the support of NIH/NIAID R56-AI148284. M.C. and A.V. acknowledge support from Google Cloud Healthcare and Life Sciences Solutions via the GCP research credits program. E.M. acknowledges partial support by MINECO (FIS2016-78904-C3-3-P and PID2019-106811GB-C32). Y.M. acknowledges partial support from the Government of Aragon and FEDER funds, Spain through grant E36-20R (FENOL), and by MINECO and FEDER funds (FIS2017-87519-P). A.A. and Y.M. acknowledge support from Banco Santander (Santander-UZ 2020/0274) and Intesa Sanpaolo Innovation Center. The funders had no role in study design, data collection, and analysis, decision to publish, or preparation of the manuscript.


