
Abstract
COVID-19 patients may exhibit neuropsychiatric and neurological symptoms. Here we found that anxiety and cognitive impairment are manifested by 28-56% of COVID-19 convalescent individuals with mild respiratory symptoms and are associated with altered cerebral cortical thickness. Using an independent cohort, we found histopathological signs of brain damage in 25% of individuals who died of COVID-19. All of the affected brain tissues exhibited foci of SARS-CoV-2 infection and replication, particularly in astrocytes. We also found that neural stem cell-derived human astrocytes in vitro are susceptible to SARS-CoV-2 infection through a mechanism that involves spike-NRP1 interaction. SARS-CoV-2-infected astrocytes manifested changes in energy metabolism and in key proteins and metabolites used to fuel neurons and in the biogenesis of neurotransmitters, and elicited a secretory phenotype that reduces neuronal viability. Our data support the model where SARS-CoV-2 reaches the brain, infects astrocytes and consequently leads to neuronal death or dysfunction. These processes are likely to contribute to the structural and functional alterations in the brain of COVID-19 patients.
Main
COVID-19 is a disease caused by infection with the severe acute respiratory syndrome coronavirus 2 (SARS-CoV-2). Although the most commonly observed symptoms of COVID-19 are respiratory and related to pulmonary infection, a growing body of evidence has demonstrated that SARS-CoV-2 may have extrapulmonary effects 1, including in the central nervous system (CNS). Notably, over 30% of hospitalized COVID-19 patients manifest neurological and even neuropsychiatric symptoms 2,3, eventually presenting some degree of encephalitis 4. One study revealed that more than half of these hospitalized patients continue to exhibit neurological symptoms even after approximately three months from the acute stage 5. Impaired cognition was also confirmed in recovered patients after hospitalization 6–9. The neurological impairment is consistent with substantial damage to the nervous system 10.
Previous studies on Severe Acute Respiratory Syndrome (SARS) patients reported the presence of the SARS coronavirus in the brain tissue and cerebrospinal fluid of subjects who presented neurological symptoms 11–13. SARS-CoV-2 RNA was also detected in the cerebrospinal fluid of patients with meningitis 14–16. Moreover, alterations in the cerebral cortical region compatible with viral infection 17, loss of white matter and axonal injury 18 have all been reported in COVID-19 patients.
In line with the potential neurotropic properties of the SARS-CoV-2, recent evidence demonstrated the presence of viral proteins in human brain regions of COVID-19 patients and in the brain of K18-ACE2 transgenic mice infected with SARS-CoV-2 19,20. The presence of SARS-CoV-2 in the human brain has been associated with significant astrogliosis, microgliosis and immune cell accumulation 19. Further indicating the ability of SARS-CoV-2 to infect cells of the CNS, Song and colleagues showed that SARS-CoV-2 infects human brain organoid cells in culture. Despite the accumulating evidence, little is known about the cellular and molecular mechanisms involved in SARS-CoV-2 infection of the brain and the consequent repercussion to brain structure and functionality. To gain further insights into the neuropathological and neurological consequences of COVID-19 and possible cellular and molecular mechanisms, we performed a broad translational investigation associating clinical and brain imaging features of COVID-19 patients with neuropathological and biochemical changes caused by SARS-CoV-2 infection in the CNS. We found that astrocytes are the main sites of viral infection and replication at the CNS. SARS-CoV-2-infected astrocytes exhibited marked metabolic changes resulting in reduction of metabolites used to fuel neurons or to build neurotransmitters. Infected astrocytes also secrete an unidentified factor that leads to neuronal death. These events might be responsible for neuropathological alterations and neuropsychiatric symptoms observed in COVID-19 patients.
Results
Neuropsychiatric symptoms in convalescent COVID-19 patients correlate with altered cerebral cortical thickness
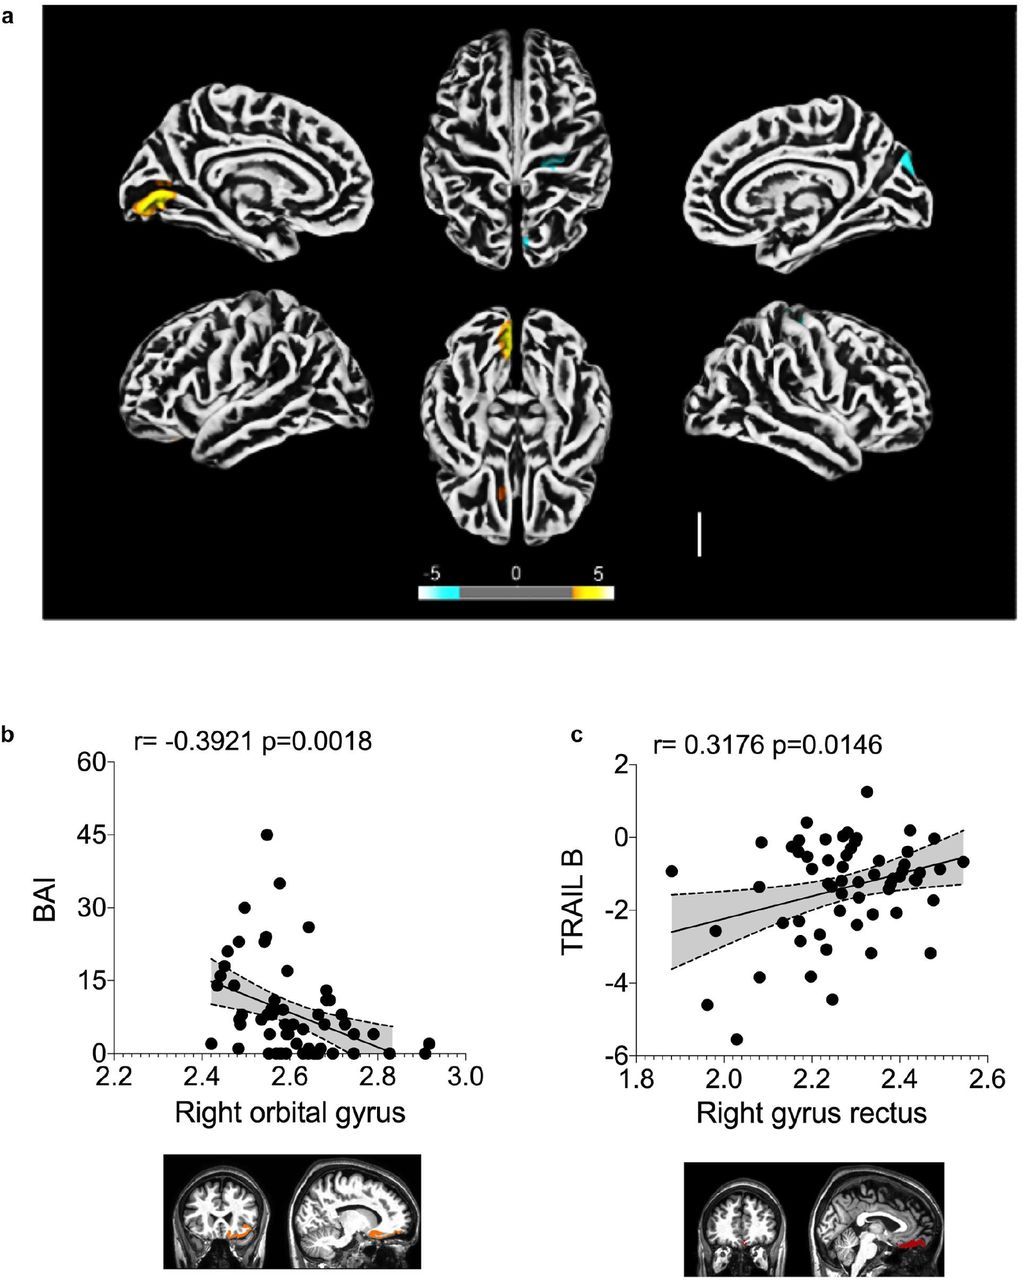
To explore the possibility of brain damage in COVID-19 patients and dissociate it from the indirect consequences of the severe stage of the disease, we performed cortical surface-based morphometry analysis using high-resolution 3T MRI of 81 subjects diagnosed with COVID-19 who had mild respiratory symptoms and did not require hospitalization or oxygen support. The analysis was performed within a median interval of 54 days after SARS-CoV-2 detection by RT-qPCR and the subjects were compared to 145 healthy volunteers (Supplementary Table 1 and 2). The analysis revealed areas of reduced cortical thickness in the left lingual gyrus, calcarine sulcus - including the cuneus - and olfactory sulcus - including the rectus gyrus (Fig. 1a). In contrast, increased thickness was detected in the central sulcus - including the precentral and postcentral gyrus - and superior occipital gyrus (Fig. 1a), which can be associated with vasogenic edemas 21. A subgroup of these individuals (n = 61) were subjected to neuropsychological evaluation for anxiety (Beck Anxiety Inventory, BAI), depression (Beck Depression Inventory, BDI), logical memory (Wechsler Memory Scale), cognitive functions (TRAIL Making Test) and fatigue (Chalder Fatigue Questionnaire, CFQ). These tests were performed between 21 and 120 days after diagnosis (median of 59 days). Symptoms of anxiety were identified in approximately 28% of the subjects, and 20% of individuals presented symptoms of depression (Extended Data Fig. 1a). Abnormal performances were observed in nearly 28% of participants on logical memory and approximately 34% and 56% on TRAIL A and B, respectively (Supplementary Table 3 and Extended Data Fig. 1b). We also correlated the changes in cortex thickness with the neuropsychological evaluation. We identified a negative correlation between BAI and cortical thickness of orbitofrontal regions (adjusted for CFQ) (Fig. 1b and Supplementary Table 4) and a positive correlation between TRAIL B and cortical thickness of the right gyrus rectus (Fig. 1c and Supplementary Table 5). We additionally identified significant partial correlations between logical memory (immediate recall test, adjusted for BAI, BDI and CFQ) and cortical thickness of regions associated with language (Supplementary Table 6). These results suggest that a thinner cortex in these areas is associated with poor performance on this verbal memory task. Overall, our findings indicate major alterations in cortical structure associated with neuropsychiatric symptoms in COVID-19 patients with mild or no respiratory symptoms.

The subgroup of individuals who performed neuropsychological evaluation presented a median age of 37.8 years (range 21-63 years), 16 years of education (range 6-24 years), and 59 days of the interval from their diagnosis of COVID-19 (range 21-120 days). The median values of BDI (range 0-36), and also of BAI (0-45) were 6 points. The median score of CFQ-11 was 16 (range 0-32). a) Presence of anxiety (BAI) and depression (BDI) symptoms. b) Performance on the logical memory (LM) test (Wechsler Memory Scale) and cognitive function tests (TRAIL Making Test A and B).

a) Surface-based morphometry using high-resolution 3T MRI. Yellow represents areas of decreased cortical thickness: left lingual gyrus, calcarine sulcus (and cuneus), and olfactory sulcus (and rectus gyrus). Blue represents areas of increased cortical thickness: central sulcus (precentral and postcentral gyrus) and superior occipital gyrus. Representative image of the analysis of 81 subjects tested positive for SARS-CoV-2 (who had mild respiratory symptoms and did not require hospitalization or oxygen support) compared to 145 healthy volunteers (without diagnosis of COVID-19). The analysis was performed within a median interval of 54 days. b) Correlation between anxiety scores (BAI) and right orbital gyrus thickness. The data depicts Pearson’s correlation coefficient. c) Correlation between TRAIL B performance scores and right gyrus rectus thickness. Data depict Pearson’s correlation coefficient and region of interest in representative images.
SARS-CoV-2 infects and replicates in human brain astrocytes of COVID-19 patients
Brain alterations in COVID-19 patients could be a consequence of inflammatory or hemodynamic changes secondary to peripheral infection or could be caused by the ability of SARS-CoV-2 to invade the CNS and compromise cell viability and brain function. Although exacerbated inflammation and cardiovascular dysfunction have been well-characterized in COVID-19 patients who progress to the severe stages of the disease 22, the degree of infection of the CNS by SARS-CoV-2 remains elusive. We performed a minimally invasive autopsy via endonasal trans-ethmoidal access to obtain brain samples from 26 individuals who died of COVID-19. Initially, we performed an unbiased histopathological analysis of hematoxylin and eosin-stained brain sections in order to find features of brain alterations. In our analyses, we observed alterations consistent with necrosis and inflammation in 25% of the brain tissues from these individuals (5 out of 26; Supplementary Table 7). A deeper analysis revealed a strong predominance of senile changes such as corpora amylacea, lipofuscin deposits and parenchymal retraction around the vessels and the meninges. As brain sampling was performed via transsphenoidal by intranasal puncture, the alternating white and gray matter was observed.
Moreover, the intraparenchymal inflammatory process was minimal, but present, represented by lymphocytes and perivascular microglia proliferation. In two cases, more intense inflammation is observed, delimiting tiny inflammatory aggregates, associated with endothelial hyperplasia or gemistocytic astrocytes. In addition, the cases with nasal epithelium sampled together with brain puncture have demonstrated adaptive epithelial changes with cell balonization of the most superficial cells. Few cases showed multifocal small areas of liquefaction necrosis (Fig. 2a and Extended Data Fig. 2a).
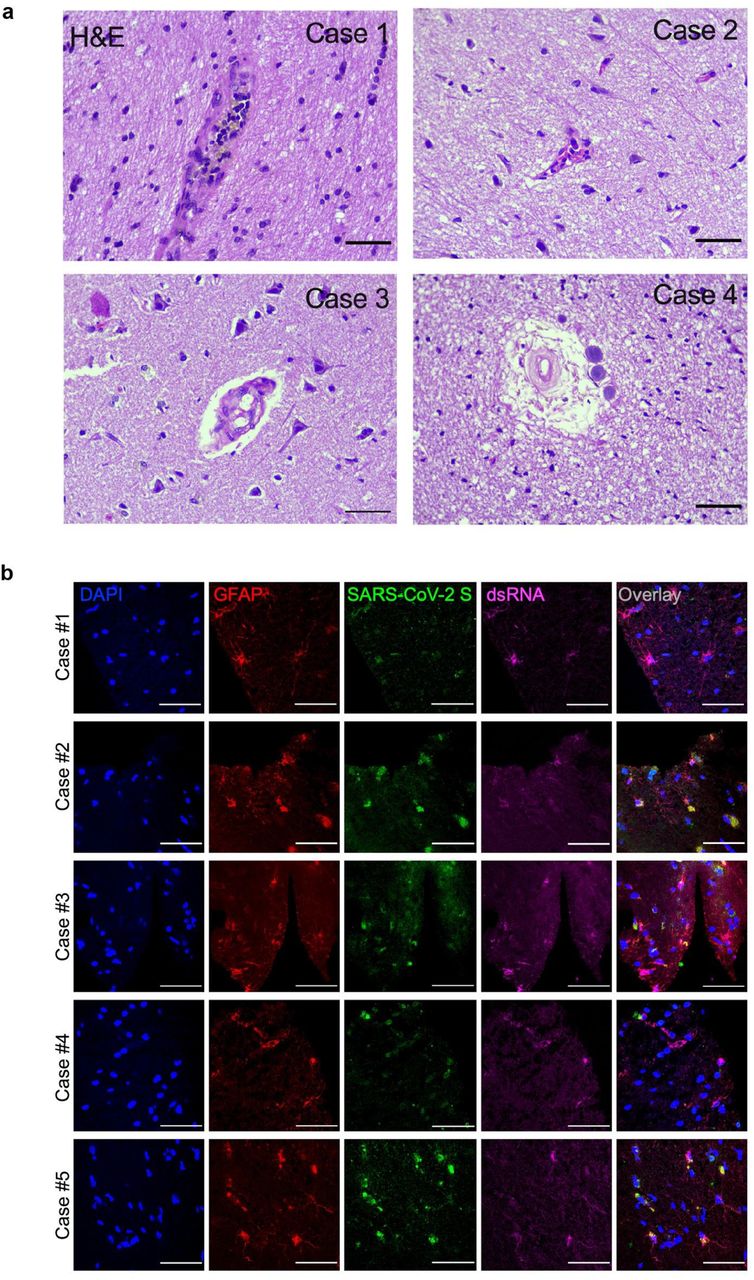
a) Histopathological alterations revealed by H&E images of postmortem brain tissue from individuals who died of COVID-19. Samples from 26 individuals were analyzed and 5 showed alterations. Case 1: intraparenchymal cerebral vessel with margination of inflammatory cells through endothelium; Case 2: focal infiltration of inflammatory cells – diapedesis; Case 3: intraparenchymal vascular damage; Case 4: perivascular edema and senile corpora amylacea. b) Representative confocal images of the brain tissues of 5 COVID-19 patients who manifested histopathological alterations. Staining of glial fibrillary acidic protein (GFAP, red), double-stranded RNA (dsRNA, magenta), SARS-CoV-2-S (green), and nuclei (DAPI, blue). Images were acquired with 630x magnification. Scale bar indicates 50 µm.

a) Histopathological H&E images of postmortem brain tissue from individuals who died of COVID-19. Five out of 26 individuals showed signs of brain damage asrepresented in the images by I) areas of necrosis, cytopathic damage (I, i.e., enlarged, hyperchromatic, atypical-appearing nuclei), vessels with margination of leukocytes and thrombus (II), and immune cells infiltrate (III). Images were acquired with 400x magnification. Scale bar indicates 50 µm. b) Viral load in brain tissues from the five COVID-19 patients who manifested histopathological alteration in the brain as compared to samples from SARS-CoV-2-negative controls (n=5 per group). c) Representative confocal images of the brain tissue of one COVID-19 patient who manifested histopathological alterations. Immunofluorescence targeting glial fibrillary acidic protein (GFAP, red), double-stranded RNA (dsRNA, magenta), SARS-CoV-2-S (green), and nuclei (DAPI, blue). Images were acquired with 630x magnification. Scale bar indicates 50 µm. d) Percentage of SARS-CoV-2-S positive cells in this tissue. e) Percentage of GFAP-positive vs. Unidentified cells, Iba1 and NeuN among infected cells. Ten fields/cases were analyzed. f) Pearson’s correlation coefficient demonstrating colocalization of SARS-CoV-2-S and dsRNA within GFAP-positive cells. Data shown as mean ± SEM. P-values were determined by two-tailed unpaired tests with Welch’s correction (b) or ANOVA one-way followed by Tukey’s post hoc test (e).*P < 0.05 compared to the Ctrl-group; **** P < 0.0001 compared to Unidentified cells, Iba1 and NeuN groups.
Next, we sought to evaluate the presence of SARS-CoV-2 in those five brain samples which presented histopathological alterations. Notably, SARS-CoV-2 genetic material and spike protein were detected in all of these five samples (Fig. 2b,c). In average, SARS-CoV-2 spike protein was detected in 37% of the cells in the brain tissues (Fig. 2d), the majority of these SARS-CoV-2 spike-positive cells (i.e., 65.93%) being astrocytes (GFAP+ cells; Fig. 2e and Extended data Fig. 2b). Hence, about 25% of the cells in the brain samples of the five COVID-19 patients we analyzed were infected astrocytes. We also detected SARS-CoV-2 spike protein in neurons (NeuN+ cells; Fig. 2e and Extended Data Fig. 3a), but not in microglia (Iba-1+ cells; Fig. 2e and Extended Data Fig. 3b). The specificity of anti-spike antibodies was validated in brain tissue of COVID-19 free cases and in SARS-CoV-2-infected Vero cells (Extended Data Fig. 4a-b). Additionally, the presence of SARS-CoV-2 spike protein correlated with the presence of double-stranded RNA (dsRNA) in the cells (Fig. 2c,f), indicating replicative virus in the brain tissue 23.

a-b) Representative immunostaining and confocal analysis from brain slices from autopsies of COVID-19 patients (n=5). The image depicts staining for: b) nuclei (DAPI, blue), NeuN (red, neuron marker), dsRNA (magenta), and SARS-CoV-2-S (green); and c) nuclei (DAPI, blue), ionized calcium-binding adaptor molecule 1 (Iba1, red, microglia marker), dsRNA (magenta), and SARS-CoV-2-S (green). Images were acquired with 630x magnification. Scale bar indicates 50 µm.
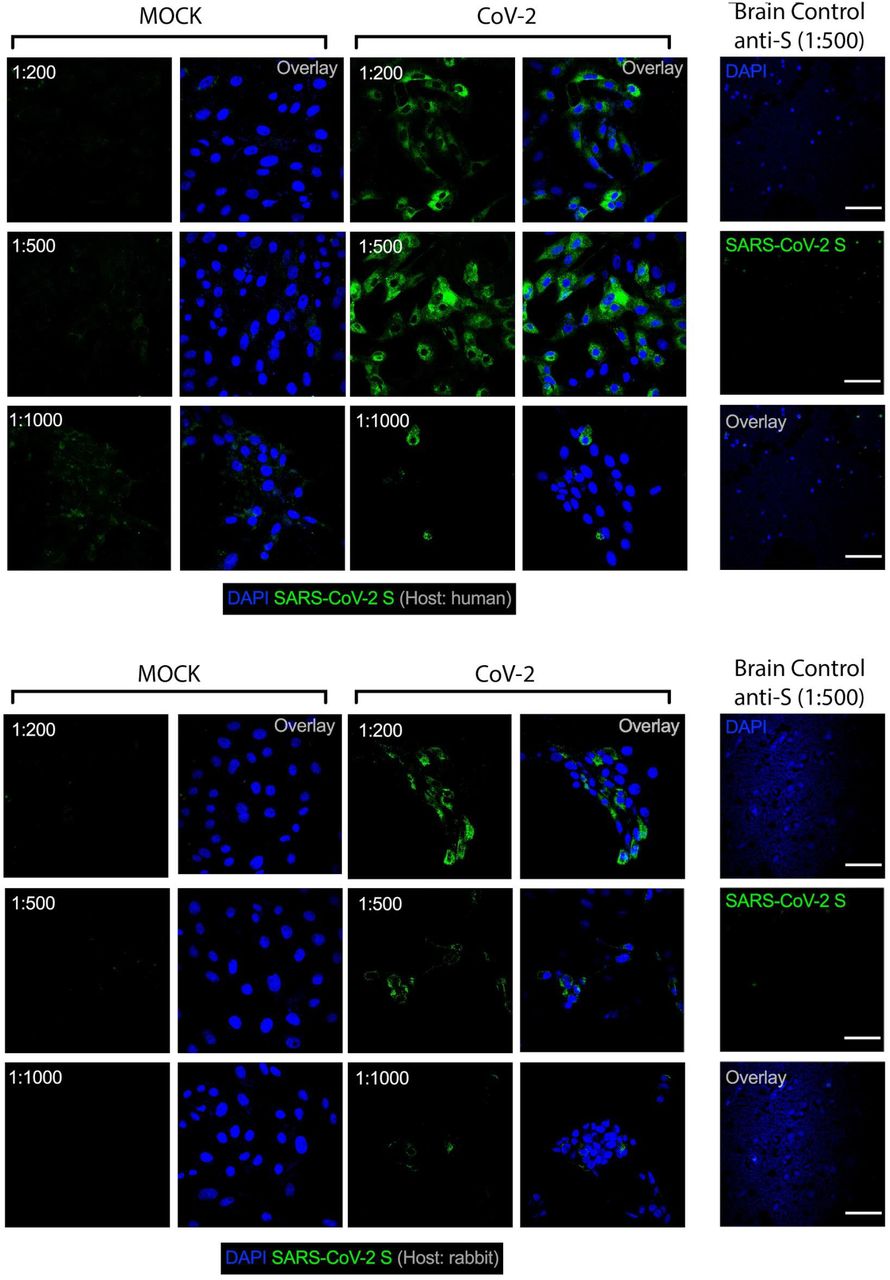
Representative immunostaining and confocal analysis in SARS-CoV-2 infected Vero cells and brain slices from control cases (Non-COVID-19) staining with different titrations for anti-S antibodies (1:200, 1:500 and 1:1,000). Immunofluorescence images show: a) nuclei (DAPI, blue), SARS-CoV-2-S (green, human chimeric monoclonal anti-SARS-CoV-2 Spike S1, GeneScript, clone HC2001, cat. A02038) and b) nuclei (DAPI, blue), SARS-CoV-2-S (green, rabbit polyclonal anti-SARS-CoV-2 Spike, Rhea Biotech, cat. IM-0828). Images were acquired with 630x magnification at the same laser intensity. Scale bar indicates 50 µm.
In order to obtain further evidence of the susceptibility of human astrocytes to SARS-CoV-2 infection, neural stem cell-derived human astrocytes (cell line BR1) were exposed to the virus and the viral load was determined up to 48 h after infection (Fig 3a). In agreement with what we have found in the postmortem brain samples, we confirmed that SARS-CoV-2 infect human astrocytes (Fig. 3b-e) as the viral genetic material (Fig. 3b) and the spike protein were detected in infected cells (Fig. 3c,d). Notably, we also found the presence of dsRNA in SARS-CoV-2-infected astrocytes in vitro, but not in mock-infected control cells suggesting viral replication in these cells (Fig. 3c,e). We also observed that SARS-CoV-2 infection reduced human astrocytes viability by 25% after 48 h and 72 h post-infection (Fig. 3f). Finally to confirm the susceptibility of human astrocytes to SARS-CoV-2 infection, we used replication-competent pseudotyped vesicular stomatitis virus (VSV), in which the glycoprotein gene (G) of VSV was replaced by the full-length SARS-CoV-2 spike (S), containing a eGFP reporter (VSV-eGFP-SARS-CoV-2)24. Our data revealed that human astrocyte cultures are susceptible to VSV-eGFP-SARS-CoV-2 infection, supporting that human astrocytes are susceptible to SARS-CoV-2 infection (Fig. 3g,h). Altogether, these results indicate that human astrocytes are permissive cells for SARS-CoV-2 infection and might represent a site for virus replication in the CNS.

a) Human neural stem cell-derived astrocytes were infected in vitro with SARS-CoV-2 (MOI 1) for 1 h, washed, and harvested 24 h after infection. b) Immunostaining for GFAP (red), double-stranded RNA (dsRNA, magenta), SARS-CoV-2-S (green), and nuclei (DAPI, blue). Images were acquired with 630x magnification. Scale bar indicates 50 µm. c) SARS-CoV-2 viral load detection in astrocyte cell pellet (n = 6 replicates) using RT-PCR. d) Percentage of infected astrocytes. The data depicts SARS-CoV-2-S and DAPI stained cells (100 fields were analyzed). e) Frequency of cells containing replicating viruses. f) Astrocyte viability upon SARS-CoV-2 infection was assessed using luminescence-based cell viability assay determining the number of live cells by quantification of ATP at 24, 48 and 72 hours post infection (CellTiter-Glo® Luminescent Cell Viability Assay). g) Percentage of infected cells with SARS-CoV-2 pseudotyped (VSV-eGFP-SARS-CoV-2) at 24, 48 and 72 hours post-infection. h) Staining for DAPI (nuclei, blue), GFAP (astrocytes, red) and eGFP (virus, green) in astrocytes infected with SARS-CoV-2 pseudotyped (VSV-eGFP-SARS-CoV-2) at 24, 48 and 72 hours post-infection. The data represents the percentage of dsRNA-stained cells into SARS-CoV-2-S positive cells (10 fields were analyzed). Data are representative of at least two independent experiments performed in triplicate or quadruplicate and shown as mean ± SEM. P-values were determined by two-tailed unpaired tests with Welch’s correction (e) and by one-way ANOVA followed by Tukey’s post (f and g). **P < 0.01; *** P < 0.001; **** P < 0.0001 compared to the mock group.
NRP1 is required for infection of astrocytes by SARS-CoV-2
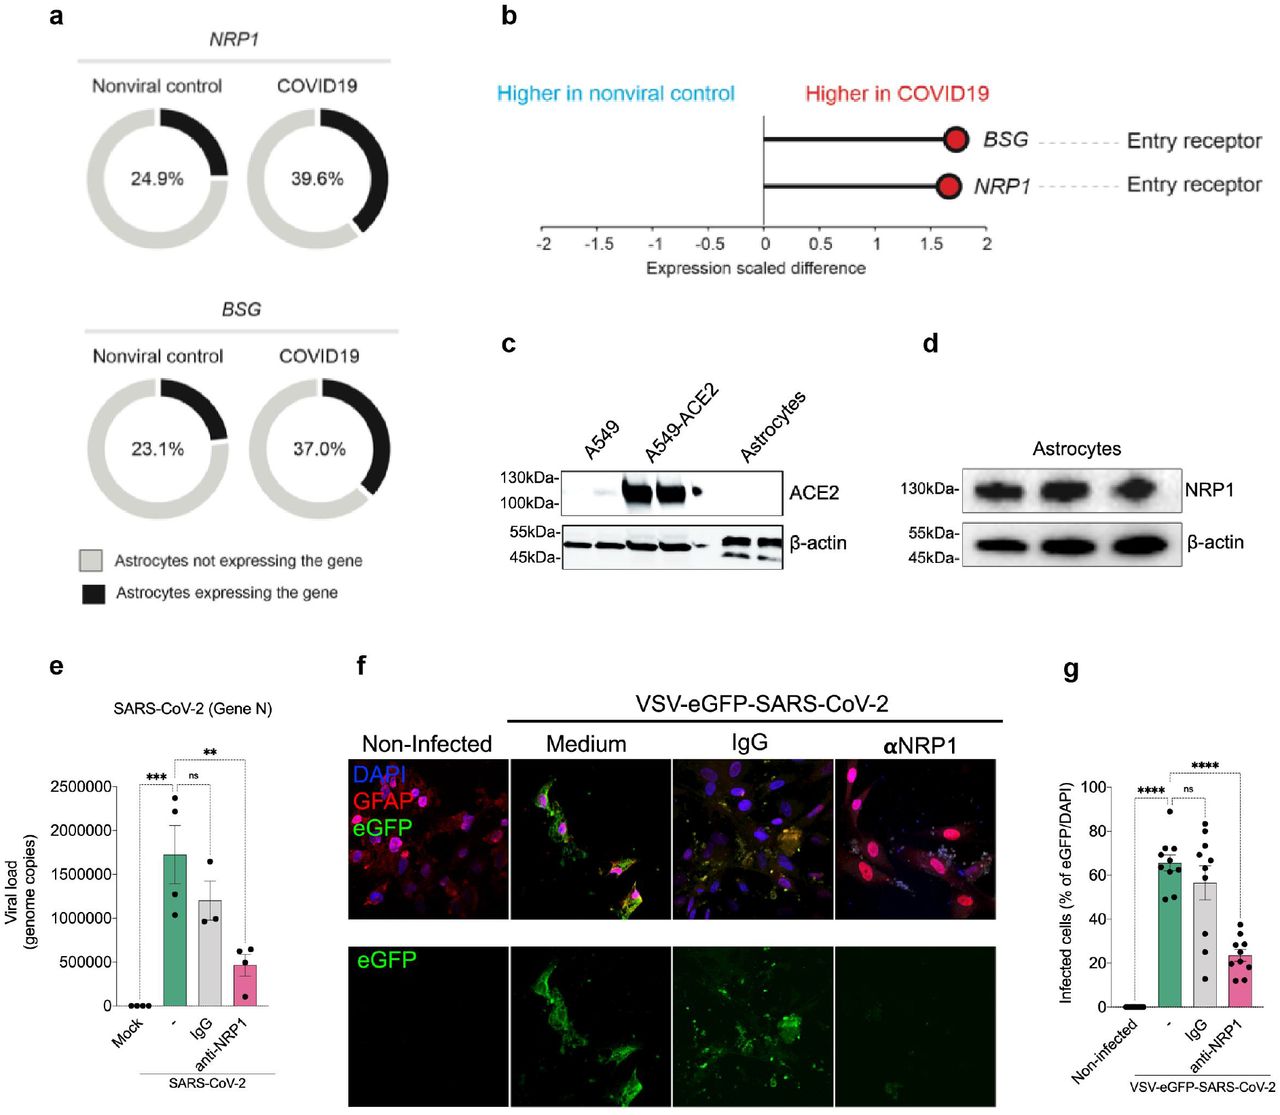
Since astrocytes are susceptible to SARS-CoV-2 infection, we searched for the entry mechanism through the identification of the cellular receptor. For that, initially we used a publicly available dataset of single-cell RNAseq from brain samples of COVID-19 patients 25 to analyse the expression of classical SARS-CoV-2 receptors such as ACE2 as well as alternative receptors, NRP1 and BSG 26–28. These analyses revealed that ACE2 mRNA was undetected in astrocytes (data not shown), confirming other studies 19,25. On the other hand, astrocytes do express detectable levels of NRP1 and BSG mRNA (Fig. 4a,b). We also found that the expression of NRP1 and BSG mRNA is increased in astrocytes from COVID-19 patients compared to controls (Fig. 4a,b). Furthermore, the percentage of astrocytes expressing these receptors is higher in the patients (Fig. 4a,b). Since the binding of SARS-CoV-2 spike to BSG remains controversial 29, we decided to further explore the possible role of NRP1. Firstly, we performed western blotting using cultured neural stem cell-derived astrocyte extracts to evaluate whether the single-cell RNAseq data was recapitulated in our in vitro model and confirmed at the protein level. We confirmed that human astrocytes do not express ACE2, whereas they do express NRP1 (Fig. 4c,d and Extended data Fig. 5). For ACE2 expression, we used A549 transduced with ACE2 as positive control. In order to verify the role of NRP1 in the mechanism of SARS-CoV-2 infection in astrocytes, we pre-incubated these cells with a neutralizing NRP1 antibody. We observed that the NRP1 antibody inhibited infection of astrocytes by SARS-CoV-2 (Fig. 4e). Further supporting the participation of NRP1 for the infection of human astrocytes by SARS-CoV-2, we found that VSV-eGFP-SARS-CoV-2 infection of cultured astrocytes was also inhibited by the neutralizing NRP1 antibody (Fig. 4f,g). These results support the notion that SARS-CoV-2 infects human astrocytes by interacting with the NRP1 receptor.


a) Percentage of cells expressing entry receptor genes in astrocytes of COVID-19 patients compared to astrocytes of non-infected controls. b) BSG and NRP1 are differentially expressed in astrocytes of COVID-19 patients compared to astrocytes of non-infected controls. The x-axis shows the average expression difference (scaled) between COVID-19 patients and non-infected controls. (c-f) Immunoblot analysis of ACE2 (c) and NRP1 (d) using extract of non-infected neural stem cell-derived astrocytes. Beta-actin was used as loading control. To control for ACE2 expression, we used A549 cells overexpressing or not ACE2. e) Neural stem cell-derived astrocytes were pre-incubated with a neutralizing NRP1 antibody and then harvested 24 hours post infection to measure SARS-CoV-2 viral load. f) Astrocytes were stained for DAPI (nuclei, blue), GFAP (astrocytes, red) and eGFP (virus, green). Cells were pre-incubated with the NRP1 neutralizing antibody and then assessed 48 hours after infection with the SARS-CoV-2 pseudotyped virus (VSV-eGFP-SARS-CoV-2). g) Percentage of infected cells. Images were acquired with 630x magnification. Scale bar indicates 50 µm. Data are representative of at least two independent experiments performed in triplicate and shown as mean ± SEM. P-values were determined by one-way ANOVA followed by Tukey’s post (e and g). **P < 0.01; *** P < 0.001; **** P < 0.0001 compared to the mock group.
Proteomic and metabolomic changes in SARS-CoV-2-infected human astrocytes
In order to identify downstream mechanisms triggered by SARS-CoV-2 infection and possibly involved in the changes observed in the brain tissues of COVID-19 patients, we analyzed the proteome of SARS-CoV-2-infected human astrocytes (Fig. 5a). Liquid chromatography-mass spectrometry (LC/MS)-based shotgun proteomics revealed 170 differentially expressed proteins in SARS-CoV-2-infected astrocytes compared to mock-control cells, being 68 upregulated and 102 downregulated (Extended data fig. 6a). A group of the differentially expressed proteins compose a molecular signature able to distinguish infected astrocytes from mock-controls (Fig. 5a). Moreover, pathway enrichment and interactome analyses revealed that these proteins are involved in a wide range of biological processes and predicted regulatory networks affected by SARS-CoV-2 infection (Fig. 5b). Pathways involved in carbon metabolism are among the most enriched and include “Glycolysis/Gluconeogenesis” and the “Pentose Phosphate Pathway”, indicating altered glucose metabolism (Fig. 5c).

a) Volcano plot representing all the differentially expressed proteins found in astrocytes after SARS-CoV-2 infection. b) Top 15 enriched pathways by KEGG-database of differentially expressed proteins in postmortem brain tissue from patients who died with COVID-19. Dot size represents the number of proteins related to the respective cell type and the p value adjusted by the false discovery rate (FDR)

a) Hierarchical clustering of differentially expressed proteins of human neural stem cell-derived astrocytes were infected in vitro with SARS-CoV-2 (MOI 0.1) for 1 h, washed thoroughly and harvested after 24 h. Mock was used as a control. b) Reactome functional interaction network of differentially regulated genes of human neural stem cell-derived astrocytes infected with SARS-CoV-2. Seven different colors show 7 protein clusters of enriched pathways specified by color and the arrows represents the protein-protein interaction and the downstream activation or inhibition related with the gene modulation, showing how some pathways can be affected by SARS-CoV-2 infection (p<0.05 calculated based on binomial test). c) Network of proteins found differentially regulated in SARS-COV-2-infected Astrocytes and their respective pathways, enriched according to KEGG database. The pathways are represented by gray circles and their size is proportional to the number of proteins differentially regulated; proteins are represented as the smallest circles, colored according to their fold change. d) Cell type-enrichment analysis using the dataset generated by postmortem brain tissue from patients who died of Covid-19. Dot size represents the number of proteins related to the respective cell type and the p value adjusted by the false discovery rate (FDR). e) KEGG-enrichment analysis of differentially expressed proteins in SARS-CoV-2 infected astrocytes vs. mock as compared to postmortem brain tissue from COVID-19 patients vs. controls. Dot size represents the number of proteins related to the respective cell type and the p value adjusted by the false discovery rate (FDR).
We have also conducted LC/MS proteomics with a different set of samples consisting of 12 postmortem brain samples from COVID-19 patients vs. 8 SARS-CoV-2-negative controls. We identified 656 differentially expressed proteins - 117 downregulated and 539 upregulated. Pathways associated with neurodegenerative diseases, carbon metabolism and oxidative phosphorylation are enriched in these samples (Extended data fig. 6b). Notably, astrocytic proteins were the most enriched ones among the differentially expressed proteins, consistent with the higher frequency of infected astrocytes observed in COVID-19 postmortem brains (Fig. 5d). Proteins found differentially expressed in SARS-CoV-2-infected astrocytes and in postmortem brain tissue samples were also commonly associated with glycolysis/gluconeogenesis, carbon metabolism, the pentose phosphate pathway (Fig. 5e). Collectively, our data indicate that SARS-CoV-2 infects astrocytes in the CNS, affecting the energy metabolism and modulating proteins associated with neurodegeneration.
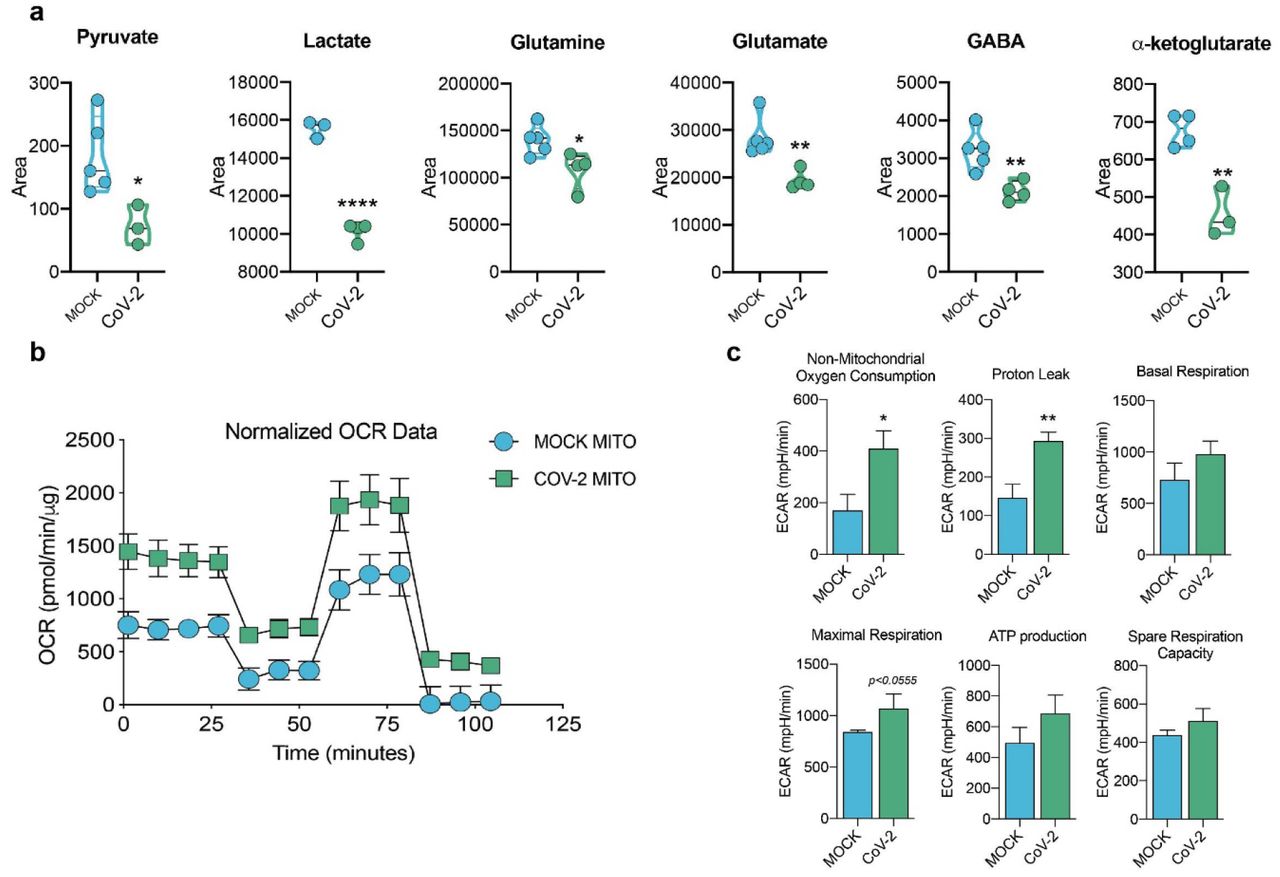
Since there are significant proteomic alterations associated with metabolic pathways, we sought to investigate whether the infection of human astrocytes would impact the levels of key metabolites involved in energy metabolism. LC/MS-based metabolomic analysis of SARS-CoV-2-infected astrocytes showed marked changes in metabolic intermediates of glycolysis and anaplerotic reactions, indicating remodeling of astrocyte metabolism (Fig. 6a). This phenomenon was marked by the decrease in pyruvate and lactate, which are downstream metabolites of the glycolytic pathway, as well as a reduction in glutamine and intermediates of glutamine metabolism such as glutamate, GABA and alpha-ketoglutarate (Fig. 6a). On the other hand, there were no significant changes in the tricarboxylic acid cycle (TCA cycle) intermediates (Extended data Fig.7). SARS-CoV-2 infected-astrocytes bioenergetics was further characterized by Seahorse Extracellular Flux analysis, showing increased respiration in infected cells (Fig. 6b).

Human neural stem cell-derived astrocytes were infected in vitro with SARS-CoV-2 (MOI 0.1) for 1 h, washed thoroughly and harvested after 24 h. Mock was used as a control. a) High-resolution mass spectrometry quantification of pyruvate, lactate, glutamine, glutamate, GABA, and a-ketoglutarate in SARS-CoV-2 infected astrocytes vs. mock. The integration area of each peak was used to calculate the violin plot graph and unpaired t-test with Welch’s correction was used for statistical comparison. b) Oxygen consumption rate (OCR) of SARS-CoV-2 infected astrocytes vs. mock. SeaHorse Flux Analysis using the MitoStress test where basal respiration was measured followed by determination of oligomycin-, FCCP-, and rotenone/antimycin-induced respiration. Data are representative of at least two independent experiments performed in triplicate (metabolomics analysis) or quintuplicate (SeaHorse Flux Analysis), and shown as mean ± SEM. P values were determined by two-tailed unpaired with Welch’s correction. *P < 0.05; **P < 0.01; **** P < 0.0001 compared to mock.
This was because of an increase in both mitochondrial (maximal respiration) and non-mitochondrial oxygen consumption in SARS-CoV-2-infected astrocytes; the former was linked to higher proton leak indicating increased uncoupled respiration (Fig. 6b,c). Together, these results demonstrate increased metabolic activity in SARS-CoV-2-infected astrocytes and a reduction of metabolites used by these cells to support neuronal metabolism and function.
Conditioned medium of SARS-CoV-2-infected astrocytes reduces neuronal viability
Astrocytes are essential in the control of brain homeostasis not only because they are the main energy reservoirs of the brain 30 but also due to their important role in the protective response to cell damage triggered by infection or sterile inflammation 31,32. There is evidence that astrocytes secrete undetermined neurotoxic factors 31–33 and are also involved in the uptake, synthesis and distribution of brain metabolites 34,35. Thus, we investigated whether neuronal viability could be indirectly affected by a conditional medium from SARS-CoV-2-infected astrocytes. To test that, we cultured either NSC-derived neurons or differentiated SH-SY5Y neurons in SARS-CoV-2-infected astrocytes conditioned medium or control medium (Fig. 7a).

a) Human NSC-derived neurons and SH-SY5Y neuronal cell line were cultured for 24 h in the presence of the conditioned medium of SARS-CoV-2-infected astrocytes from mock (ACM CTL) or SARS-CoV-2 (ACM CoV-2) infected cells. b) Cellular viability as measured by apotracker/fixable viability stain (FVS) staining and analysed by flow cytometry. Representative gating strategies. c) Representative dot-plots of neuronal viability. d) Percentage of live or death cells of NSC-derived neurons and e) SH-SY5Y cells. Live cells (gray bars) represents double-negative population, early apoptosis (purple bars) and late apoptosis (pink bars) show apotracker+/FVS- and double-positive cells, respectively, and necrosis (green bars) is apotracker-/FVS+. f) SARS-CoV-2 viral load detection in differentiated SH-SY5Y neurons using RT-PCR. Data are representative of at least two independent experiments performed in triplicate, and shown as mean ± SEM. P values were determined by one-way ANOVA followed by Tukey’s post. ***P < 0.001; ****P < 0.0001 compared to the Mock-group.
The conditioned medium increased in 45.5% and 22.7% the rate of apoptosis in NSC-derived neurons and SH-SY5Y neurons respectively (Fig. 7b-e and Extended data Fig. 8). Notably, the direct exposure of either NSC-derived neurons or SH-SY5Y neurons to SARS-CoV-2 did not reduce cell viability (Fig. 7d,e). It is noteworthy that SARS-CoV-2 genetic material was not detected in SH-SY5Y neurons incubated with SARS-CoV-2-infected astrocytes conditioned medium (Fig. 7f), ruling out that neuronal death was due to infectious particles present in the conditioned medium. These results suggest that SARS-CoV-2-infected astrocytes release soluble factors which reduce neuronal viability.
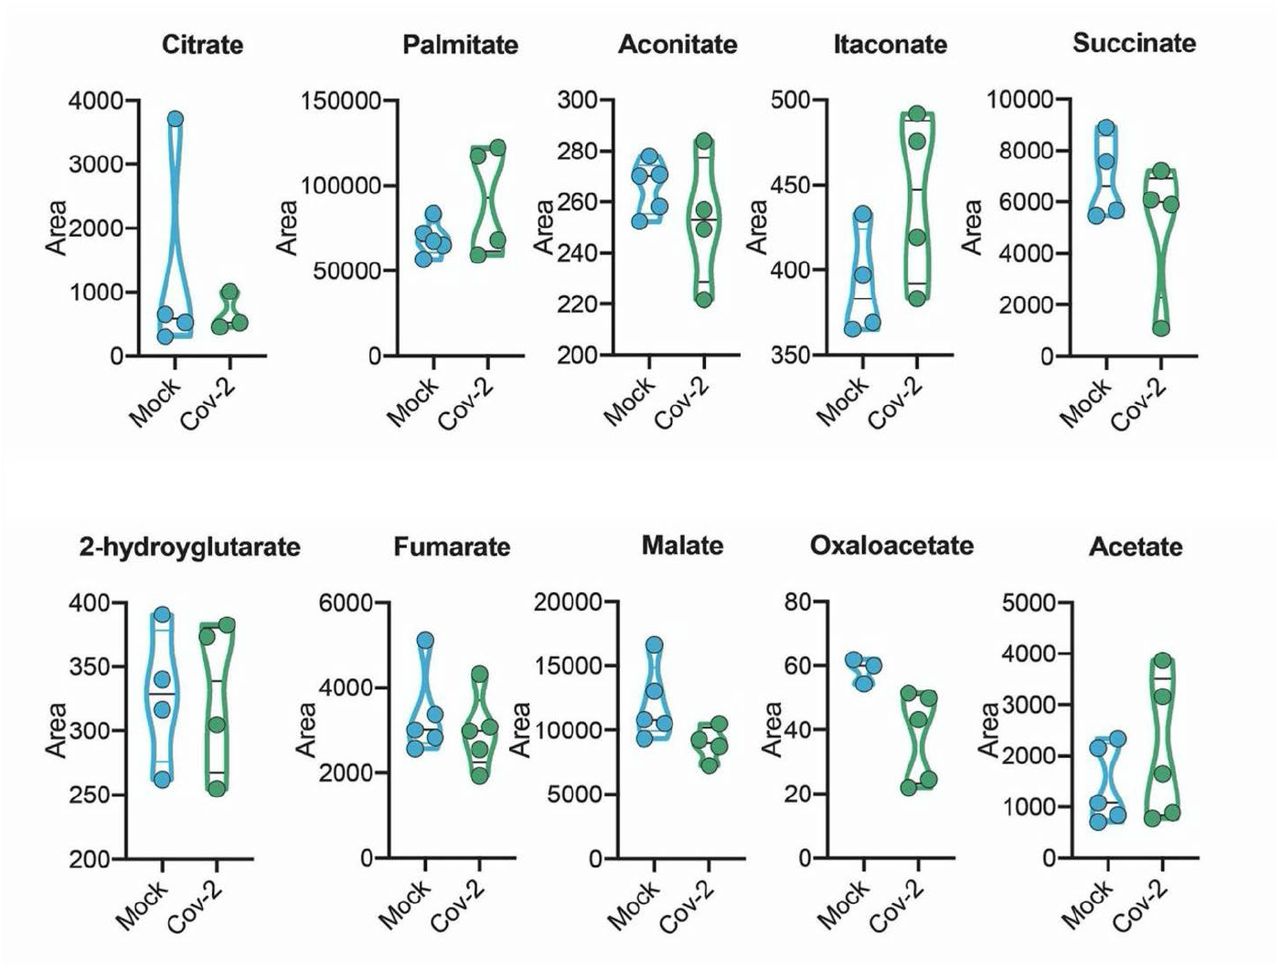
Human neural stem cell-derived astrocytes were infected in vitro with SARS-CoV-2 (MOI 0.1) for 1 h, washed thoroughly and harvested after 24 h. Mock was used as a control. High-resolution mass spectrometry quantification of citrate, palmitate, acetate, fumarate, succinate, oxaloacetate, and malate in SARS-CoV-2 infected astrocytes vs. mock. The integration area of each peak was used to calculate the violin plot graph and unpaired t-test with Welch’s correction was used for statistical comparison.
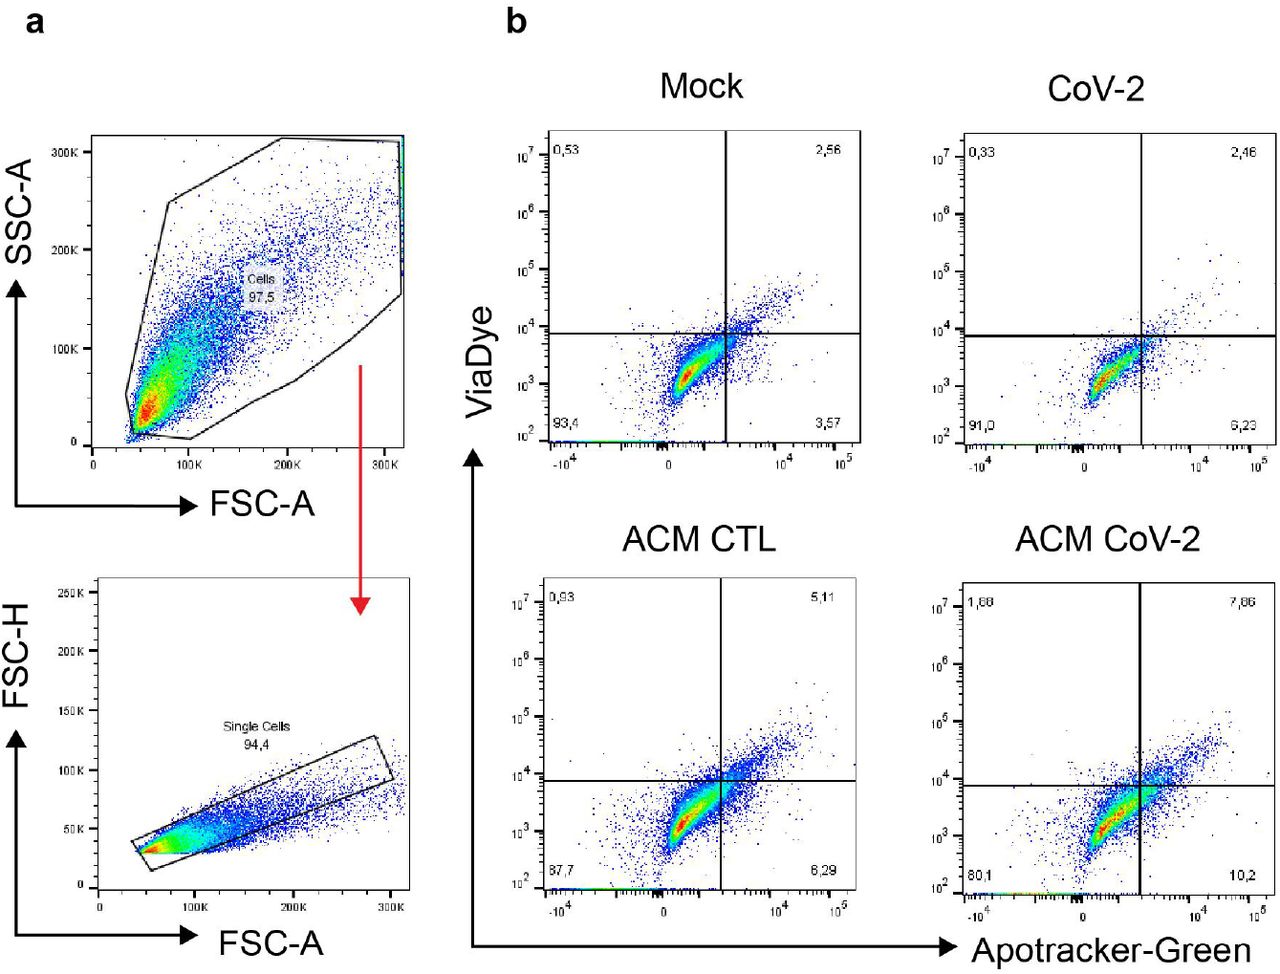
SH-SY5Y differentiated was cultured for 24 h in the presence of the conditioned medium of SARS-CoV-2-infected astrocytes from mock (ACM CTL) or SARS-CoV-2 (ACM CoV-2) infected cells. Cellular viability as measured by apotracker/fixable viability stain (FVS) staining and analysed by flow cytometry. a) Representative gating strategies. b) Representative dot-plots of neuronal viability.
Discussion
Our study evidences structural and functional alterations in the brain tissue of COVID-19 patients which correlate with neuropsychiatric and neurological dysfunctions. This study and other reports showing alterations in brain structure and the manifestation of neurological symptoms in COVID-19 patients 36,37 raise a debate on whether these clinical features are consequence of peripheral changes or the potential ability of the virus to invade the CNS. Our findings support the latter, at least in part, as we detect SARS-CoV-2 in the brain tissue collected from patients who died of COVID-19. The potential of SARS-CoV-2 to infect brain cells has been demonstrated using in vitro models such as stem cell-derived neural cells and cerebral organoids 20. Viral particles have also been found in the brain 19, localized in the microvasculature and in neurons 20, as well as in the choroid plexus 38 and meninges 39.
However, the magnitude of this infection and its distribution in the brain tissue had not been demonstrated. Here we show that astrocytes are the main foci of infection - and possibly replication - of SARS-CoV-2 in COVID-19 patients’ brains, as evidenced by the detection of the viral genome, the SARS-CoV-2 spike protein and dsRNA in both, postmortem brain tissues and in vitro astrocytes. These findings are in line with recent evidence (posterior to ours) showing that astrocytes of primary human cortical tissue and stem cell-derived cortical organoids are susceptible to SARS-CoV-2 infection40. We still cannot conclude whether SARS-CoV-2 completes its replication cycle in astrocytes, warranting further experiments.
While ACE2 is the most well-characterized cellular receptor for the entry of SARS-CoV-2 in the cell through the interaction with the viral spike protein, other receptors have also been identified as mediators of infection41. According to our data and others 19, astrocytes do not express ACE2, whereas we found higher expression of NRP1. This receptor is abundantly expressed in the CNS 26,27,42, particularly in astrocytes (Fig. 4d), and blocking its availability using neutralizing antibodies reduces SARS-CoV-2 infection in these cells. These results indicate that SARS-CoV-2 infects in vitro astrocytes via the NRP1 receptor, to be proven in vivo.
To understand the consequences of SARS-CoV-2 infection in NSC-derived astrocytes, we searched for changes at the proteome in a non-hypothesis-driven fashion. SARS-CoV-2 infection resulted in substantial proteome changes in several biological processes, including those associated with the energy metabolism, in line with previous reports in other cell types infected with SARS-CoV-2 43–45. Noteworthy, proteins differentially expressed in COVID-19 postmortem brains are enriched for astrocytic proteins, supporting our own findings that these must be the most affected cells by SARS-CoV-2 infection in the human brain. COVID-19 postmortem brain differentially expressed proteins also enriched for oligodendrocyte, neuron, and Schwann cell markers, although less significantly compared to astrocytes. Our proteomics data also evidenced changes in components of carbon metabolism pathways in both in vitro infected astrocytes and postmortem brain tissues from COVID-19 patients. These pathways were particularly associated with glucose metabolism.
Since astrocyte metabolism is key to support neuronal function, changes in astrocyte metabolism could indirectly impact neurons. Astrocytes support neurons metabolically by exporting lactate 46. One of the most critical alterations caused by SARS-CoV-2 infection in astrocytes is the decrease in pyruvate and lactate levels. Moreover, intermediates of glutamine metabolism such as glutamate and GABA are decreased in SARS-CoV-2-infected astrocytes. On the other hand, there were no significant changes in the intermediates of the TCA cycle.
Together with the increased oxygen consumption rate in SARS-CoV-2-infected astrocytes, these results suggest that glycolysis and glutaminolysis are being used to fuel carbons into the TCA cycle to sustain the increased oxidative metabolism of infected astrocytes. Importantly, astrocyte-derived lactate and glutamine are required for neuronal metabolism35,47 and synthesis of neurotransmitters such as glutamate and GABA, respectively 48. Astrocytes play a vital role in neurotransmitter recycling, a crucial process for the maintenance of synaptic transmission and neuronal excitability. This is especially important for glutamatergic synapses since proper glutamate uptake by astroglia prevents the occurrence of excitotoxicity 49. Upon this uptake, glutamine synthetase converts glutamate to glutamine, which can then be transferred back to neurons, thus closing the glutamate-glutamine cycle. This is also true for GABAergic synapses, where the neurotransmitter GABA is taken up by astrocytes and metabolized first to glutamate and then to glutamine 50. Moreover, astrocytes are responsible for maintaining glutamate levels in the brain. Hence, given the importance of the coupling between astrocytes and neurons, astrocytic alterations in glucose and glutamine metabolism are expected to compromise neuronal function, affecting neuronal metabolism and synaptic function and plasticity 51.
In addition to the metabolic changes observed in SARS-CoV-2-infected astrocytes that may impact neuronal dysfunction, we also found that SARS-CoV-2 infection elicits a secretory phenotype in astrocytes that results in increased neuronal death. Our data points to the release of one or more still unidentified neurotoxic factors by SARS-CoV-2-infected astrocytes. A similar phenomenon has been observed when astrocytes are activated by inflammatory factors 31,52.
Neuronal death may explain, at least partially, the alterations in cortical thickness found in COVID-19 patients. A recent study with 60 recovered patients and 39 healthy controls also identified gray matter abnormalities 97 days after the onset of the disease, with increased volume in some areas of the brain 5. While that study analyzed hospitalized patients, we evaluated individuals that did not have to be hospitalized (i.e., had mild respiratory symptoms), and nevertheless, we observed notable alterations of cortical thickness. Importantly, some of these alterations correlated with symptoms of anxiety and impaired cognition, which is consistent with previous literature 53,54. Since one of the hypotheses for the neuroinvasive mechanism of SARS-CoV-2 is via the olfactory nerves 55, we speculate that the associations between BAI and TRAIL B scores and structural alterations in the orbitofrontal region may be a result of the action of the virus in this cortical area, closely related to the olfactory nerves.
Our findings are consistent with a model in which SARS-CoV-2 is able to reach the CNS of COVID-19 patients, infects astrocytes and secondarily impairs neuronal function and viability. These changes might contribute to the alterations of brain structure as observed here and elsewhere, thereby resulting in the neurological and neuropsychiatric symptoms manifested by some COVID-19 patients. Our study comes as a cautionary note that interventions directed to treat COVID-19 should also envision ways to prevent SARS-CoV-2 invasion of the CNS and/or replication in astrocytes.
Material and Methods
Brain imaging and neuropsychological evaluation
Participants
Eighty-one patients (60 women, median 37 years of age) previously infected with SARS-CoV-2 were enrolled prospectively for this study after signing an informed consent form approved by the local Ethics Committee. These individuals presented mild symptoms during the acute phase and did not require hospitalization or oxygen therapy. They had a median interval of 54 days (range 16-120 days) between their RT-PCR exam and the day of MRI scanning and interview. For cortical thickness analysis, we included one hundred and forty-five controls (103 women, median 38 years of age) 56 from our Neuroimaging databank, given the difficulties and risk of recruiting healthy volunteers during the pandemic. The outpatients and healthy controls were balanced for age (p=0.45) and sex (p=0.65). The neuropsychological evaluations and neuroimaging analyses were approved by the Research Ethics Committee of the University of Campinas (CAAE: 31556920.0.0000.5404) and all subjects signed a consent form to participate.
Neuropsychological evaluation
We performed neuropsychological evaluations of sixty-one of these patients. They were tested for symptoms of anxiety using the Beck Anxiety Inventory (BAI) and symptoms of depression using the Beck Depression Inventory (BDI) 57. Symptoms of anxiety were confirmed for those with a BAI higher than 10 points, and depression symptoms defined for those with minimum of 14 points on the BDI. In terms of depression, subjects were categorized with mild (BDI 14-19), moderate (20-35) and severe (36-63) symptoms. Anxiety symptoms were considered mild (BAI 11-19), moderate (20-30) and severe (31-63). We evaluated verbal memory (immediate and delayed episodic memory) using the Logical Memory subtest from the Wechsler Memory Scale (WMS-R) 58, in which the examiner verbally presents two stories, and each story includes 25 pertinent pieces of information. Subjects are required to recall details of each story immediately after its presentation and again after 20 minutes. To evaluate other cognitive functions, we applied the TRAIL Making Test (TMT), which is subdivided into two steps. Step A assesses processing speed and visual search in a task that requires ascending connection order of 25 numbers, randomly arranged. Step B evaluates alternating attention and cognitive flexibility in a task associated with shifting rules in an ascending sequence of 25 numbers. A training stage is applied to both steps. We calculated z-scores for the results of these tests based on Brazilian normative data 58,59. For each test, the function was categorized as preserved (z-score > −0,99, including average, high average, above average, and exceptionally high scores), low average score (z-score between −1 and −1.5); below-average score (z-score between −1.51 and −2); and exceptionally low score (z-score < −2) 60,61. The Chalder Fatigue Questionnaire (CFQ-11) 62 was used to evaluate fatigue in these subjects; they were instructed to answer 11 questions (measured on a Likert scale 0-3), which yields a global score out of 33.
Neuroimaging analysis
We obtained the structural, 3D, T1-weighted images from a 3T Achieva-Philips MRI scanner (voxel size: 1×1×1 mm, TE = 3.2 ms, TR = 7 ms, matrix = 240×240×180, flip angle = 8 and FOV = 240×240 mm2) 56,57. We performed imaging analysis with the CAT12 toolbox (http://www.neuro.uni-jena.de/cat/, version r1711) within SPM12 (http://www.fil.ion.ucl.ac.uk/spm/, version 7487) using MATLAB 2017b to extract Cortical Thickness (CT) maps, according to the default parameters. The T1 images were initially spatially registered and segmented into gray matter, white matter and cerebrospinal fluid. Finally, we calculated the cortical thickness using the projection method described by Dahnke et al. 63. For voxelwise analysis of extracted maps, we used CAT12/SPM12 tools for an independent T-test (comparing COVID-19 patients and healthy controls), including age and sex as covariates. The results displayed were corrected for multiple comparisons using False Discovery Rate (FDR) 64 correction (p<0.05). For anatomical identification, we used the “Destrieux Atlas 2009” 65. Cortical parcellation was performed with standard CAT12 tools to extract the cortical thickness of regions of interest for correlations with neuropsychological scores. We used SPSS 22 for statistical analysis of clinical and neuropsychological variables. The FDR procedure was applied to adjust p-values for multiple comparisons (when necessary) with R software 66.
Postmortem brain samples from COVID-19
Twenty-six individuals who died from complications related to COVID-19 were autopsied with an ultrasound-guided, minimally invasive approach using endonasal trans-ethmoidal access. Brain tissue samples were collected and fixed using a 10% neutral buffered formalin solution. After fixation, the tissue was embedded in a paraffin block and sectioned into slices with a thickness of 3 μm. The sections were stained by H&E and immunofluorescence. For proteomic analysis, twelve COVID-19 patients were autopsied using the same approach. Brain tissue samples were collected and macerated in a lysis buffer (100 mM Tris-HCl, pH 8.0, 150 mM NaCl, 1 mM EDTA, 0.5% Triton X-100) prior to trypsin digestion. The autopsy studies were approved by the National Commission for Research Ethics (CAAE: 32475220.5.0000.5440 and CAAE: 38071420.0.1001.5404).
Generation of human astrocytes (hES-derived)
Differentiation of glial progenitor cells was performed from neural stem cells (NSC) derived from pluripotent human embryonic stem cells (hES, cell line BR-1) 67, according to the method published by Trindade, 2020 68. NSCs were cultured in plates coated with Geltrex Matrix (Thermo Fisher Scientific, MA, USA) using 1:1 Neurobasal™/Advanced DMEM/F12 medium and 2% neural induction supplement. Upon reaching 50% confluence, the medium was changed to DMEM/F12 (Dulbecco’s Modified Eagle Medium/F12), 1% N2 supplement, 1% fetal bovine serum (FBS), and 1% Penicillin-Streptomycin and maintained at 37°C in humidified air with 5% CO2 for 21 days. At this stage, cells were considered glial progenitor cells (GPCs). Subsequently, GPCs were plated at low density (30-40% confluence) on Geltrex coated plates and treated with DMEM/F12 medium, 1% GlutaMAX Supplement, 10% FBS and 1% penicillin-streptomycin.
The differentiation medium was replaced every 2-3 days. After 4 weeks of differentiation, the cells were considered mature astrocytes. The cells were plated on Geltrex-coated coverslips at a density of 4×10⁴ cells for immunostaining assays; and 25×104 cells for viral load, proteomic and metabolomic analysis. All products used for cell culture are from Thermo Fisher Scientific, MA, USA. Noteworthy, the characterization of BR1 cultured cells lineage as astrocytes cells has been previously described elsewhere 67–70. Additionally, our internal control showed that about 97% of the neural stem cell-derived astrocyte culture expresses GFAP (Extended Data Fig. 9a,b).
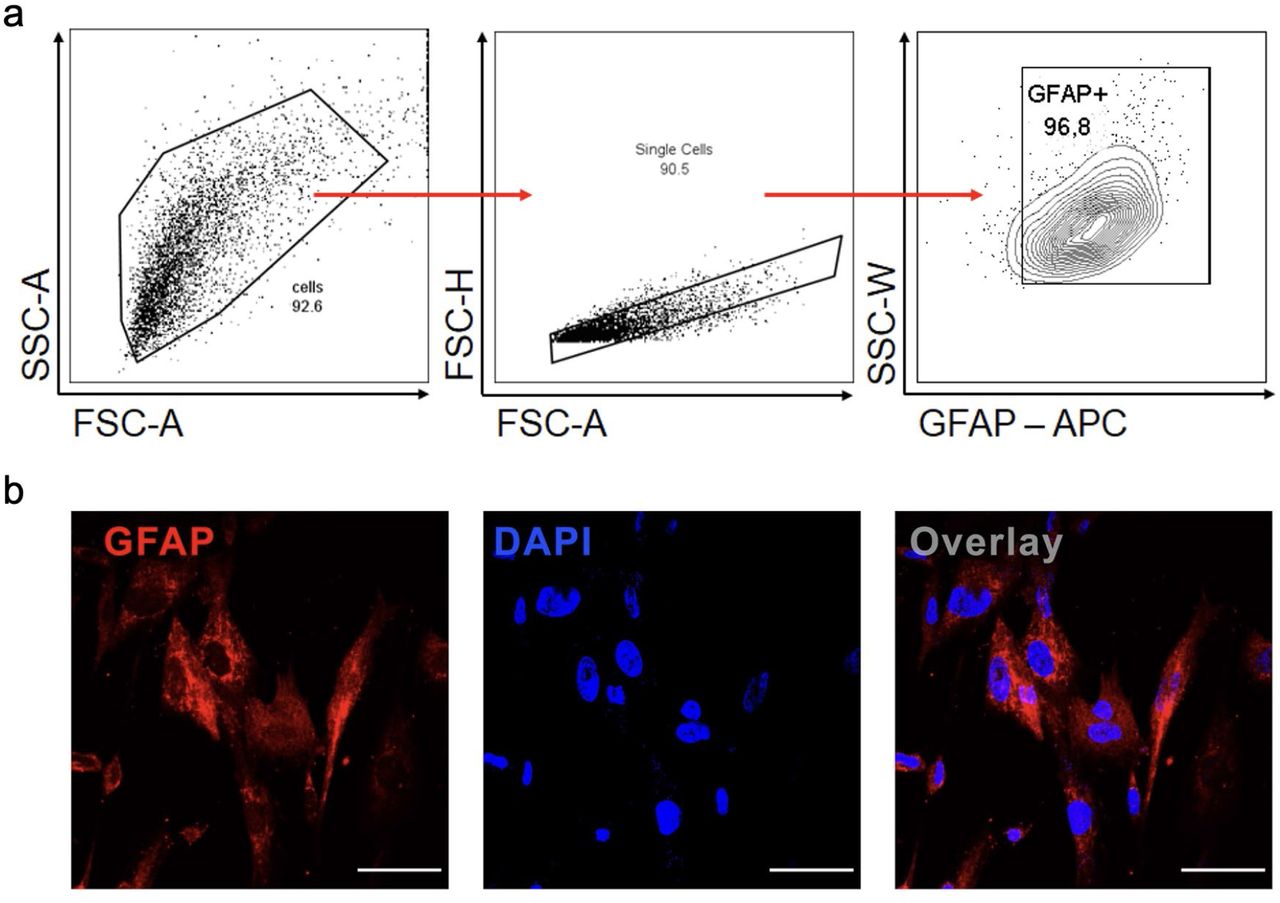
Cells were trypsinized for FACS analysis and incubated with antibodies against GFAP. a) Cells were analyzed and the results were plotted as SSC-A vs GFAP (APC). The percentage of positive cells is indicated in the representative contour plot. b) Staining for GFAP (red) and nuclei (DAPI, blue). Images were acquired with 630x magnification. Scale bar indicates 50 µm.
Virus strain
The HIAE-02-SARS-CoV-2/SP02/human/2020/BRA (GenBank accession number MT126808.1) virus strain was used for all in vitro experiments. The virus was isolated from the first confirmed case of COVID-19 in Brazil and kindly donated by Prof. Dr. Edison Durigon (ICB-USP). VSV-eGFP-SARS-CoV-2 was engineered and donated by Sean P.J. Whelan (Department of Medicine, Washington University School of Medicine, St. Louis, MO, USA) for experiments of SARS-CoV-2 entry 24. Viral stock was propagated in Vero CCL-81 cells (ATCC) cultivated in DMEM supplemented with 10% heat-inactivated FBS and 1% of penicillin and streptomycin (Gibco, Walthmam, MA, USA), and incubated at 37°C with 5% CO2 atmosphere. Viral titer was determined by the plaque-forming assay using Vero cells.
In vitro infection
Astrocytes were infected with SARS-CoV-2 for 1 hour using an MOI of 0.1 (proteomics, metabolomics, gene expression, viral load, bioenergetics assays and flow cytometer analysis) and 1 (immunostaining experiments) under gentle agitation at room temperature. After viral adsorption, cells were washed twice with phosphate-buffered saline (PBS) and incubated with DMEM/F12 supplemented with 10% FBS, 1% GlutaMAX and 1% penicillin and streptomycin for 24 hours at standard culture conditions (37°C and 5% CO2 atmosphere). The experiments of SARS-CoV-2 entry were performed using SARS-CoV-2 (MOI 1.0) and VSV-eGFP-SARS-CoV-2 pseudotyped particles (MOI 1.0) in presence of NRP1 neutralizing antibody (BD Bioscience, Cat. 743129, Clone U21-1283). We used anti-IgG2b as antibody control (Biolegend, Cat. 406703, Clone RMG2b-1). Astrocytes cells were harvested according to the experiment: immunostaining, proteomics and metabolomic analysis, gene expression analysis and viral load, bioenergetics test and flow cytometer analysis.
Immunostaining and confocal microscopy
Brain sections from autopsies and astrocyte cell cultures were fixed with 10% neutral buffered formalin solution or 4% paraformaldehyde (PFA), respectively. Subsequently, the samples were incubated with primary antibodies: mouse monoclonal anti-GFAP Alexa Fluor 488 (EMD Millipore, clone GA5, cat. MAB3402X, 1:400), human chimeric monoclonal anti-SARS-CoV-2 Spike S1 (GeneScript, clone HC2001, cat. A02038, 1:500), rabbit polyclonal anti-SARS-CoV-2 Spike (Rhea Biotech, cat. IM-0828, 1:200), mouse monoclonal anti-double stranded RNA J2 (dsRNA, SCICONS English & Scientific Consulting Kft., clone J2-1909, cat. 10010200; 1:1,000), rabbit polyclonal anti-IBA1 (FUJIFILM Wako Pure Chemical Corporation, cat. 019-19741, 1:1,000) and rabbit monoclonal anti-NeuN (Abcam, clone EPR12763, cat. Ab128886, 1:1,000). The slides were washed twice with TBS-T (Tris-Buffered Saline with Tween 20) and incubated with secondary antibodies donkey anti-mouse IgG AlexaFluor 647 (Thermo Fisher Scientific; cat. A32787; 1:800) or AlexaFluor 488 (Abcam; cat. ab150061; 1:800), donkey anti-rabbit IgG AlexaFluor 488 (Abcam; cat. ab150065; 1:800) or AlexaFluor 594 (Abcam; cat. ab150076; 1:800) and goat anti-human IgG FITC (Rhea Biotech, cat. IC-3H04, 1:400). Controls were performed for secondary antibody fluorescence. Antibodies for detecting SARS-CoV-2 in human brain tissue and human astrocytes in vitro were first validated on SARS-CoV-2-infected and non-infected Vero cells. In addition, we validated the antibodies in brain sections from control (Non-COVID-19).
Nuclei were stained with DAPI (Life Technologies; cat. D1306; 1:1,000). Images were acquired by an Axio Observer combined with an LSM 780 confocal device (Carl Zeiss) with 630x magnification and Z-stack (0.15μm) for brain sections. Colocalization analysis between GFAP and SARS-CoV-2 S1 or GFAP and dsRNA were quantified using the Fiji/ImageJ software. To determine colocalization, we used a ratio of GFAP:SARS-CoV-2 and GFAP:dsRNA in each sample by analyzing Pearson’s correlation coefficient.
Western Blot
Astrocytes cell culture samples were collected in RIPA Buffer (Sigma Aldrich, Cat. R0278) with protease and phosphatase inhibitors (Cell Signaling, Cat. 5872S). Protein content was quantified using a BCA protein assay kit (Sigma Aldrich, Cat. BCA1). Extracts were separated by 10% SDS-PAGE acrylamide gel electrophoresis and transferred to nitrocellulose membranes. After transfer, the membranes were incubated at 4°C with a blocking buffer. The membranes were incubated in 5% BSA solution (Sigma Aldrich, Cat. A7906) and Tween 20 at 0.1% (Sigma Aldrich, Cat. P2287) containing rabbit anti-ACE2 polyclonal antibody (1:2000, Abcam, Cat. ab15348) or rabbit anti-NRP1 monoclonal antibody (1:1000, Abcam, clone EPR3113 Cat. ab81321) overnight. Next, the membranes were incubated with anti-rabbit polyclonal antibody (1:5000, Invitrogen, Cat. 31460) for 1 h. Beta-actin (Cell signaling, clone 8H10D10, Cat. 3700S) was used as loading control. The membranes were detected with an ECL system (Millipore, Cat. WBULS0500) and Chemidoc imaging systems (Bio-Rad Laboratories).
Single cell transcriptomic analysis
We analyzed single-cell transcriptomic data from the brain of patients with COVID-19 and non-viral controls. The data was generated by Yang et al. 25 and publicly available at https://twc-stanford.shinyapps.io/scRNA_Brain_COVID19. The dataset was downloaded and the RDS file was imported into R environment version v3.6.3. Astrocyte cells were filtered based on cell type annotations provided by original authors. To calculate the percentage of cells expressing BSG and NRP1, cell frequency was calculated considering cells with gene count >= 1 in the RNA essay for each gene (BSG and NRP1). Cells that met this criteria of minimum expression were considered as expressing the respective gene. Differential expression analysis was conducted using FindMarkers function in Seurat with the Wilcoxon test comparing COVID-19 Astrocyte cells vs Non-viral Astrocyte cells. Specifically, genes were calculated considering minimum percent expression of genes in cells of 5% and Average Log Fold Change above 0.1. Genes were considered differentially expressed if the adjusted p-value was below 0.05.
Proteomics sample preparation, LC-MS/MS analysis and data processing
Astrocytes infected with SARS-CoV-2 and a mock control were collected in biological triplicates. Cells were chemically lysed with Lysis Buffer: (100 mM Tris-HCl, 1 mM EDTA, 150 mM NaCl, 1% Triton-X, protease and phosphatase inhibitors) and mechanically lysed with an ultrasonication probe in 3 cycles of 20s each with 90% of frequency. The total protein extract was quantified by BCA, according to the manufacturer’s instructions (Thermo Fisher Scientific, MA, USA). 30 µg of total protein extract from each sample was transferred to a Microcon-10 Centrifugal Filter, with 10 kDa cutoff, for FASP protein digestion 71. Proteins were reduced (10 mM DTT), alkylated (50 mM IAA) and digested overnight by trypsin at 37°C in 50 mM ammonium bicarbonate (AmBic), pH 8.0. One the following day the peptides were recovered from the filter in 50 mM AmBic, and trypsin activity was quenched by adding formic acid (FA) to a final concentration of 1% (v/v), after that the peptides were concentrated in a SpeedVac and stored at −80°C until use.
Digested peptides were resuspended in 0.1% FA. LC-MS/MS analysis was performed in an ACQUITY M-Class System (Waters Corporation, Milford, MA) coupled online to a Synapt G2-Si mass spectrometer (Waters Corporation, Milford, MA). 1 μg of peptides were loaded onto a trapping column (Symmetry C18 5 μm, 180 μm × 20 mm, Waters Corporation, Milford, MA) and subsequently separated in the analytical column (HSS T3 C18 1.8 μm, 75 μm × 150 mm; Waters Corporation, Milford, MA). For gradient elution, 0.1% FA was used as eluent A and Acetonitrile-FA (99.9% ACN:0.1% FA) as eluent B. Reversed phase gradient was carried out over 120 minutes, with a linear gradient 3 - 60% acetonitrile over 90 min at 300 nL/min. In the Synapt G2-Si, the peptide spectra were acquired by ion mobility-enhanced data-independent acquisition (HDMSe). Mass spectrometry analysis was performed in “Resolution Mode”, switching between low (4 eV) and high (25–60 eV) collision energies, using a scan time of 1.0 s per function over 50–2000 m/z. The wave velocity for ion mobility separation was 1.000 m/s and the transfer wave velocity was 175 m/s. A [Glu1]-Fibrinopeptide B Standard (Waters Corporation, Milford, MA) was used as the reference lock mass compound. Each sample was run in three technical replicates.
The raw data from each experiment were processed in Progenesis QI for proteomics (Waters Corporation, Milford, MA). Tandem mass spectra were searched against the Homo sapiens proteome database (UNIPROT Protein reviewed release 2020-04), using tolerance parameters of 20 ppm for precursor ions and 10 ppm for product ions. For peptide identification, carbamidomethylation of cysteines was set as a fixed modification, oxidation of methionines as a variable modification, 2 missed cleavages, and a false discovery rate (FDR) < 1%. Protein identification was performed using a minimum of 1 fragment ion matched per peptide, a minimum of 3 fragment ions per protein and a minimum of 1 peptide per protein.
Label-free quantitative analysis was carried out using the relative abundance intensity normalized by all peptides identified. The expression analysis was performed considering the technical replicates for each experimental condition, following the hypothesis that each group is independent. Proteins with ANOVA (p) ≤ 0.05 between the groups were considered differentially expressed.
Bioinformatic Analysis
Proteomic data visualization was performed in house with Python programming language (v. 3.7.3). Proteins differentially regulated (p < 0.05) were submitted to systems biology analysis in R (v. 4.0) and Cytoscape environments 72. While performing Over Representation Analysis (ORA), proteins were enriched using ClusterProfiler R package 73, CellMarker Database 74, and Kyoto Encyclopedia of Genes and Genomes (KEGG 75). For the Network analysis, it was run by Reactome Cytoscape Plugin 76 for module detection and enrichment pathway analysis.
Metabolomics sample preparation, UPLC-MS/MS analysis and data processing
The medium was washed twice with PBS at physiologic pH, then the cells were collected with 600 μL of methanol. Samples were dried and stored at −80 °C until the metabolite extraction step. Volumes of 473 μL of water, 600 μL of methanol, and 1168 μL of chloroform were added, and then the tubes were shaken vigorously for 2 minutes. Subsequently, samples were centrifuged for 5 minutes at 13,000 x g. The aqueous supernatant and the organic phase (lower phase) were collected and dried for 60 and 40 min (respectively) in a vacuum concentrator. All samples were stored at −80 °C until analysis by UPLC-MS/MS.
The samples were resuspended in 100 μL of methanol: water mixture (1:1) and for each analysis, 4 μL of the sample was injected. Sample separation was performed by hydrophobic interaction liquid chromatography (HILIC) using an Acquity UPLC® BEH amide column (1.7 µm, 2.1 mm x 100 mm). The mobile phases used for the separations were ACN: H2O (80:20) as mobile phase A and ACN: H2O (30:70) as mobile phase B, both phases containing 10 mM of ammonium formate and 0.1% of ammonium hydroxide. The separation was then performed by a gradient from 99% to 1% buffer A over 7 min. The column was returned to 99% buffer A for 2 min for re-equilibration before the next injection for a total run time of 10 min. Data acquisition was performed in negative mode and the instrument was operated in MSe mode in the m/z range of 50–800 Da, with an acquisition time of 0.1 s per scan.
The raw files were preprocessed by Progenesis QI software by Waters®, and identification was executed using multiple data banks. Identification of the metabolites of interest was carried out manually by spectral features, and the identification level 3 was obtained according to Schrimpe-Rutledge et al. 77 using 5ppm as the error cutoff. The integration area of each peak was used to calculate the violin plot graph and an unpaired t-test with Welch’s correction was used for statistical comparison. All analyses were performed using GraphPad Prism 8.0 software (San Diego, CA, USA) and a significance level of p ≤ 0.05 was adopted.
RNA extraction, gene expression analysis and viral load
Total RNA extraction was performed using TRI Reagent according to the manufacturer’s instructions (Sigma, St Louis, USA). RNA concentration was determined by a DeNovix spectrophotometer and RNA integrity was assessed by visualization of 28S and 18S ribosomal RNA on a 1% agarose gel. Reverse transcription was performed with 0.5 µg of RNA using a GoScript Reverse Transcriptase Kit (Promega, Madison, WI, USA) according to the manufacturer’s instructions. qPCR was performed using astrocyte cDNA diluted 1:10 and the qPCR SybrGreen Supermix (Qiagen, Valencia, CA, USA) containing forward and reverse primers in RNAse-free water. All reactions were performed in a CFX384 Touch Real-Time PCR Detection System (Biorad, Hercules, CA, USA) and cycling conditions were set as follows: 50°C for 2 min; 95°C for 10 min; (95°C for 15s; 60°C for 1 min) x 40 cycles. To evaluate primer specificity, a melting curve analysis was performed by heating samples from 65°C to 99°C (1°C increment changes at 5s intervals). All sample measurements were performed in duplicate. Primers were designed with PrimerBlast and used at the concentration of 200 nM. Data were normalized to the expression of 18S (Fwd 5’ CCCAACTTCTTAGAGGGACAAG 3’; Rev 5’ CATCTAAGGGCATCACAGACC 3’) and the relative quantification value of each target gene was determined using a comparative CT method 78. For virus detection, SARS-CoV-2 nucleocapsid N1 primers were used as previously described (Fwd 5’ CAATGCTGCAATCGTGCTAC 3’; Rev 5’ GTTGCGACTACGTGATGAGG 3’) 79,80. A serial dilution of SARS-CoV-2 was used as a standard curve. Data were expressed as mean ± SEM. Statistical significance analysis was calculated by two-tailed unpaired Student’s t-test. All analyses were performed using GraphPad Prism 8.0 (San Diego, CA, USA) and a significance level of p ≤ 0.05 was adopted.
Astrocyte bioenergetics
Astrocytes were plated on Seahorse XF-24 plates at a density of 1.5×10⁴ cells per well and incubated in complete culture medium for two days at 37°C in 5% CO2. 24 hours before the experiment, cells were either infected by SARS-CoV-2 (MOI 0.1) or not infected (MOCK). One day post-infection, the culture medium was changed to Seahorse Base medium (supplemented with 1 mM pyruvate, 2 mM glutamine, and 10 mM glucose) and cells were incubated at 37°C in a non-CO2 incubator for 1 hour. OCR (Oxygen Consumption Rate) was measured over the course of the experiment under basal conditions and after the injections of oligomycin (1 µM), FCCP (5 µM) and antimycin A/rotenone (100 nM/1 µM). Protein concentration was determined for each well to normalize the data. Data were expressed as mean ± SEM of at least two independent experiments performed in quintuplicate. Statistical significance analysis was calculated by two-tailed unpaired Student’s t-test. All analyses were performed using GraphPad Prism 8.0 software (San Diego, CA, USA) and a significance level of p ≤ 0.05 was adopted.
CellTiter-Glo® Luminescent Cell Viability Assay
Astrocyte death caused by SARS-CoV-2 infection was measured using ATP quantification by a luminescence assay (Promega, Madison, WI, USA; G7572). The CellTiter-Glo® Luminescent Cell Viability Assay determines the number of viable cells in culture through quantitation of ATP levels, which reflect the presence of metabolically active cells. Astrocytes were infected with SARS-CoV-2 and harvested after 24, 48 and 72 hours. After that, astrocytes were washed and the CellTiter-Glo® Reagent was added in the cells, following the manufacturer’s instructions (Promega; G7572). The luminescent signals were obtained using a FlexStation 3 (Molecular Devices, CA, USA) (BioTek, Winooski, VT).
Differentiation of the SH-SY5Y Human Neuroblastoma Cell Line
The SH-SY5Y cell line was cultivated with DMEM/F12 medium, 10% FBS and 1% penicillin-streptomycin. at 37°C in humidified air with 5% CO2. The SH-SY5Y were plated and upon reaching 25-30% confluency, the medium was changed to the neuronal differentiation medium, which consists of DMEM/F12 with 1% FBS and 10 µM retinoic acid (RA, Sigma Aldrich). The differentiation medium was replaced every 2-3 days during 2 weeks. This protocol is one of the most commonly used for neuronal differentiation of SH-SY5Y cells 81–83. SH-SY5Y cells are more closely related to adrenergic neurons, but they also express dopaminergic markers83.
NSCs differentiation into neurons
The human NSC-derived neurons were cultivated following the protocol described by Thermo Fisher Scientific 84–86. NSCs were plated on geltrex-coated plates and maintained with NEM medium at 37°C in humidified air with 5% CO2. Upon reaching 40% confluency, the medium was changed to the neuronal differentiation medium, which consists of DMEM/F12 and Neurobasal medium (1:1) with 1% B27 supplement (Thermo Fisher Scientific, Carlsbad, CA, USA) and 1% Glutamax (Thermo Fisher Scientific, Carlsbad, CA, USA). The medium was changed every four days for 20 days and was performed by the removal of half of the content and addition of this same volume of fresh medium. Factors secreted by the differentiating cells are important for a successful differentiation. These cells and protocols have been extensively characterized elsewhere 84–86. We tested the neuronal markers synaptophysin, MAP-2, β-tubulin; and astrocyte marker GFAP in NSC-derived neurons using FACS analysis. The results demonstrated that 75.9%, 99.9%, 8.1% and 99% of the NSC-derived neurons express synaptophysin, MAP-2, GFAP and β-tubulin, respectively, indicating a bonafide neuronal phenotype (Extended data Fig. 10).

The cells were trypsinized for FACS analysis and incubated with antibodies against synaptophysin, MAP-2, GFAP and β-tubulin. Cells were analyzed and the results were plotted as SSC-A vs. Synaptophysin, MAP-2, GFAP and β-tubulin. The percentage of positive cells is indicated in the representative contour plot.
Exposure of neurons with astrocyte conditioned medium
Astrocytes, human NSC-derived neurons and SH-SY5Y cells were cultured separately in standard conditions until complete differentiation. Next, astrocytes were infected either with MOCK or SARS-CoV-2 (MOI 0.1) and after 24 hours, the medium was removed and cells were washed with PBS and cultured for 24 hours. The media of NSC-derived or SH-SY5Y neurons were removed and replaced by the conditioned medium of SARS-CoV-2-infected astrocytes or control medium for 24 hours. After incubation, cells and the medium were collected for Flow Cytometry Analysis, following the described procedure below.
Flow cytometer analysis
The expression of GFAP, Synaptophysin, MAP-2 and β-tubulin was evaluated through FACS analysis. Astrocytes and NSC-derived neurons were collected and stained with BD Horizon™ Fixable Viability Stain 510 for 30 min at 4°C. Primary antibodies anti-GFAP (Abcam; cat. Ab7260); anti-Synaptophysin (D35E4) XP Rabbit mAb (Cell Signaling; cat. #5461); anti-MAP2 (Abcam; cat. ab32454); Anti-Tubulin, beta III isoform, C-terminus (Milipore; cat. #MAB1637) diluted in BD Perm/WashTM buffer were added to the cells and incubated for 1h at 4°C (1:500). Secondary antibodies donkey anti-mouse IgG AlexaFluor 594 (Cell Signalling; cat. 8890S), donkey anti-rabbit IgG AlexaFluor 647 (Abcam; cat. ab15006) and donkey anti-goat IgG AlexaFluor 488 (Abcam;cat. ab150129) diluted in BD Perm/WashTM buffer were added and incubated for 30 min at 4°C (1:250). Cells were washed with BD Perm/WashTM buffer, and then transferred to polypropylene FACS tubes. Analysis was carried out on a FACSymphony -Becton & Dickinson (San Diego, CA, USA)
The viability of human NSC-derived and SH-SY5Y neurons was determined 24 h after incubation with the conditioned medium of SARS-CoV-2-infected astrocytes or control medium. The percentage of live (Apotracker-/FVS510-), necrotic (Apotracker-/FVS510+), early (Apotracker+/FVS510-) and late (Apotracker+/FVS510+) apoptotic cells was determined by flow cytometry (FACSymphony -Becton & Dickinson, San Diego, CA, USA), after labeling with fixable viability stain (FVS510, BD Biosciences, #564406) and ApotrackerTM Green (BioLegend, #427403). Data were analyzed using FlowJo software (BD Biosciences). Data are representative of at least two independent experiments performed in triplicate and are shown as mean ± SEM. P values were determined by ANOVA one-way followed by Tukey’s post hoc test.
Data availability
The mass spectrometry proteomic data have been deposited to the ProteomeXchange Consortium via the PRIDE 87 partner repository with the dataset identifier PXD023781 and 10.6019/PXD023781.
Data Availability
The mass spectrometry proteomic data have been deposited to the ProteomeXchange Consortium via the PRIDE partner repository with the dataset identifier PXD023781 and 10.6019/PXD023781.
Author Contributions
F.C., V.C.C. and F.P.V. designed the majority of the experiments, performed the experiments, analyzed data and contributed to writing the manuscript. P.H.V. performed metabolomic analysis. A.G.F.V., A.S.L.M.A., C.B-T., G.S.Z., G.R.-O., L.C.a, V.M.S-C., A.C.C., contributed to the study design, performed experiments and data interpretation. F.C., A.C.C., A.G.F.V., A.S.L.M.A., C.B-T., G.S.Z., V.M.S-C., performed cell culture and cell differentiation, flow cytometry and RT-PCRs analysis. A.S.L.M.A., A.C.C., P.L.P., D.A.T.T., G.F.S., S.P.M., R.G.L., J.F., M.R., N.B.S., M. C.M., R.E.M.P.S., performed SARS-CoV-2 In vitro infections and BSL-3 work. R.G.L., G.P.R., T.L.K., G.G.D., J.A.G., P.B.R., N.B.S. performed experiments and discussed the data. V.C.C., G.R.O., L.C., performed all proteomic experiments and systems biology analysis in silico. R.B.J., L.S.S., M.H.N., I.K.A., M.R.B., M.K.M.A., J.R.S.J., L.L.D., M.E.P.C.S., I.M.P.S., E.D.R., S.M.G., L.H.L.S., V.B., B.M.C., F.C. and C.L.Y. recruited patients, performed brain imaging and clinical assessments; G.L. performed statistical analysis. T.M., A.D-N., L.F.F.S., M.D., P.S. collected human postmortem brain samples, assessed clinical files and discussed the data. M.N.B., S.B., L.S., A.F. collected human postmortem brain samples and performed histological analysis. F.P.V., B.M.S.M., G.M.A., E.M.S.F., I.M.P., B.M.S.S., R.M.G., M.N.B., S.B., L.S., R.M.M.V., R.M., J.C.A-F., E.A., A.S., F.Q.C., T.M.C., performed immunofluorescence analysis, RT-PCR analysis, histological and morphological analysis. I.M.S.C., H.I.N., performed RNAseq single-cell bioinformatic analysis. A.S.V., A.D., M.A.R.V., C.D.M., S.K.R., A.S.F., P.M.M.M-V., J.L.P.M., conceived experiments, data interpretation, provided material and revised the paper. M.A.M., T.M.C., D.M.S., provided the funding for the study; formulated the hypothesis, designed experiments, analyzed data and wrote the manuscript with input from all authors. D.M.S., T.M.C. conceived and supervised the study.
DECLARATION OF INTERESTS
Authors declare no competing interests
COVID-19 patient characteristics
Acknowledgements
We thank Edison Durigon for providing the SARS-CoV-2. We thank Gabriela Lopes Vitória, Elzira E. Saviani and Paulo Baldasso for technical support. The authors would like to thank FAPESP (São Paulo Research Foundation; grants 2020/04746-0; 2020/04860-8; 2017/25588-1; 2019/00098-7; 2014/10068-4; 2020/04919-2; 2013/08216-2; 2020/05601-6; 2020/04860-8; 2019/11457-8; 2013/07559-3; 2013/07607-8), Fundo de Apoio ao Ensino, Pesquisa e Extensão (FAEPEX) Unicamp - Grant number: 2274/20, the Brazilian National Council for Scientific and Technological Development - CNPq, and the Coordenação de Aperfeiçoamento de Pessoal de Nível Superior – Brazil (CAPES). The authors wish to thank Bradley J. Smith, MSc for English review support.
References
- 1.↵
- 2.↵
- 3.↵
- 4.↵
- 5.↵
- 6.↵
- 7.
- 8.
- 9.↵
- 10.↵
- 11.↵
- 12.
- 13.↵
- 14.↵
- 15.
- 16.↵
- 17.↵
- 18.↵
- 19.↵
- 20.↵
- 21.↵
- 22.↵
- 23.↵
- 24.↵
- 25.↵
- 26.↵
- 27.↵
- 28.↵
- 29.↵
- 30.↵
- 31.↵
- 32.↵
- 33.↵
- 34.↵
- 35.↵
- 36.↵
- 37.↵
- 38.↵
- 39.↵
- 40.↵
- 41.↵
- 42.↵
- 43.↵
- 44.
- 45.↵
- 46.↵
- 47.↵
- 48.↵
- 49.↵
- 50.↵
- 51.↵
- 52.↵
- 53.↵
- 54.↵
- 55.↵
- 56.↵
- 57.↵
- 58.↵
- 59.↵
- 60.↵
- 61.↵
- 62.↵
- 63.↵
- 64.↵
- 65.↵
- 66.↵
- 67.↵
- 68.↵
- 69.
- 70.↵
- 71.↵
- 72.↵
- 73.↵
- 74.↵
- 75.↵
- 76.↵
- 77.↵
- 78.↵
- 79.↵
- 80.↵
- 81.↵
- 82.
- 83.↵
- 84.↵
- 85.
- 86.↵
- 87.↵


