
Abstract
Corona Virus Disease 2019 (COVID-19) started in Wuhan province of China in November 2019 and within a short time, it was declared as a worldwide pandemic by World Health Organisation due to very fast worldwide spread of the virus. In the absence of any vaccine, various mitigation measures were used. In the past, the effect of temperature and humidity on the spread of the virus was studied for a very early phase of the data with mixed results. We studied the impact of COVID-19 on the maximum temperature and relative humidity of a place using Indian states as test cases for SIR, SIRD, and SEIR models. We used a linear regression method to look for any dependency between the effective reproduction number with the maximum temperature and relative humidity. Most of the states showed a correlation with the negative slope between the effective reproduction number with the maximum temperature and the relative humidity. It indicates that the effective reproduction number goes down as maximum temperature or relative humidity rise. But, the regression coefficient R2 was low for these correlations which means that the correlation is not strong.
1 Introduction
Corona Virus Disease 2019 (COVID-19) started in Wuhan province of China in November 2019 and within a short time, it infected millions of people worldwide [2, 3, 4]. The disease is caused by severe acute respiratory syndrome coronavirus named SARS-CoV-2 [32]. World Health Organisation recognised the disease as pandemic [35, 32].
In India, the first case was reported on 30 January 2020 [33]. Till 31st May 2020, India had 190609 total confirmed cases which were highest in Asia [30] and the fourth-highest number of confirmed cases in the world [30]. Study with India is interesting as it is the world’s second largest population with about one sixth of the world’s total population [34]. During the above mentioned period, India had 91852 recoveries, 1 migration, and 5408 death [19]. From 24th March, India imposed a few lockdowns in a staged manner. We have limited our study till 31st May as from first June India started phased unlocking [5] and various other parameters contributed after that in the spread of the virus.
The spread of an epidemic depends on a large number of factors. Earlier, it was found that humidity is one of the driving factors to explain the seasonality of influenza [27]. Shaman & Kohn [27] studied the effect of relative and absolute humidity on the transmission of the influenza virus. They have shown 50% of the influenza virus transmission variability can be explained by absolute humidity but they restrict the observation with limited data.
At the beginning of the spread of the disease, it was widely believed that summer will cause the virus to reduce [8]. Experimental results of other coronaviruses also indicated that the virus may be less effective with rising temperature and humidity [9]. There were a few studies to investigate the dependency of transmission of COVID-19 on temperature and humidity [28, 1, 9, 17, 18, 16, 21] using early data of COVID-19 pandemic which show contradictory results. Using very early data of 100 Chinese cities, Wang et al. [28] found that high temperature and high humidity significantly reduce the transmission of COVID-19 while Bhattacharjee [1] concluded the opposite using initial data from four of the most affected places from China and five of the most affected places in Italy. A rigorous study was necessary with a large amount of data to effectively study the effect of temperature and humidity on the spread of coronavirus.
In the present paper, we investigate the influence of maximum air temperature and relative humidity on effective contact rate and reproduction number [26] of COVID-19. We studied the effective reproduction number R(t) for different states of India till 31st May 2020.
In Section 2, we summarised different mathematical models of the pandemic. We highlighted the SIR model in Subsection 2.1. Subsection 2.2 carried a brief introduction of the SIRD model. A short introduction of the SEIR model was given in Subsection 2.3. In Section 3, we presented our findings. The temperature dependence of the effective reproduction number was discussed in the Subsection 3.1 and the humidity dependence of effective reproduction number R(t) was discussed in Subsection 3.2. In Section 4, we discussed the implication of our findings and Section 5 we summarised our result.
2 Mathematical models
Different mathematical models were designed to simulate the effect of the disease from different perspectives [22, 23, 25, 20, 21, 12]. These helped us to get an idea about the spread rate of the disease over the population. Here we study the most common SIR, SIRD, and SEIR models. The spread rate depends on a large number of parameters such as mean incubation time [1, 6], mean infectious period, social distancing, and risk of international spread [7, 36]. The most important part of these models is to calculate the basic reproduction number (R0) which is the contagiousness of the diseases. R0 determines the average number of people can be affected by a single infected person over a course of time. R0 > 1 indicates that the spread is increasing, R0 = 1, indicates that the spread is stable and R0 < 1, indicates that the spread is expected to stop. We studied the effective reproduction number ℝ(t) for India using different models. We also studied the evolution of ℝ(t) using the same models for different individual states of India. In Figure 1, we have shown the variation of ℝ(t) for India, using three different models.
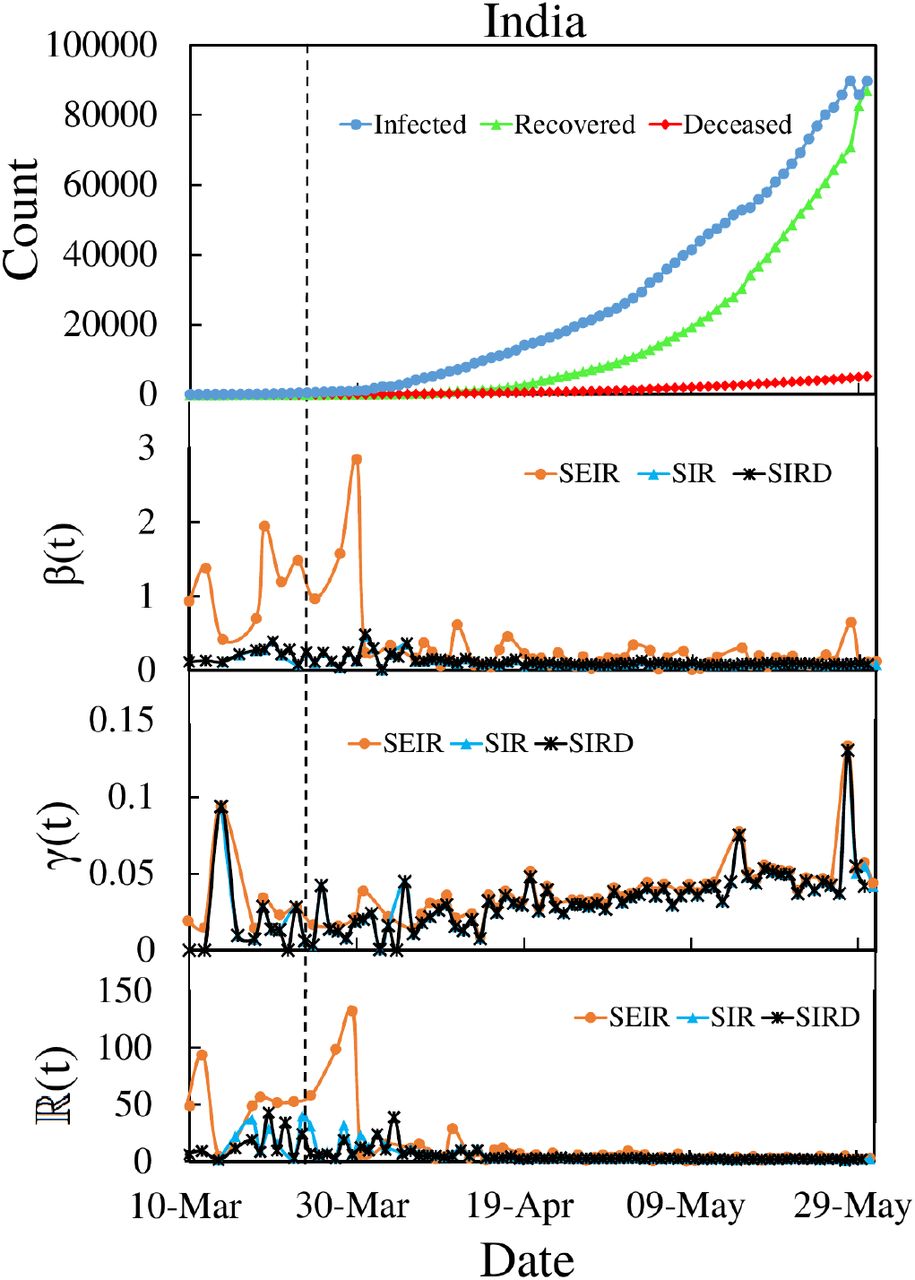
Variation of different parameters with time for India. First row: Variation of the number of infected, recovered, and deceased individuals with time. Second row: Variation of effective contact rate (β(t)) with time. Third row: Variation of recovery rate (γ(t)) with time. Fourth row: Variation of effective reproduction number (ℝ(t)) with time. The time of the imposition of the first lockdown is shown with a dotted vertical line.
2.1 SIR model
There exists a lot of models for analyzing the spread of an epidemic in a large population. The Susceptible-Infected-Recovered (SIR) model [14] is the simplest compartmental model that can describe the evolution of the epidemic at the population level. We used this model to study the different time dependent parameters like recovery rate (γ), contact rate (β), and effective reproduction number (ℝ).
At any time t, S(t) be the total number of susceptible individuals, I(t) be the total number of infected individuals, and R(t) be the total number of recovered (till a given time) individuals from the epidemic.
We shall mostly deal with the fractions:

If the total population is N, then the SIR model can be expressed as


Finally, in discrete form, the equation (1), (2) and (3) can be written as


From Eq (5) we can write

The basic reproduction number R0 can be given by

The effective reproduction number ℝ(t) can be given by

In Figure 1, we have shown various parameters for the SIR model. In the second and third row, the variation of effective contact rate (βSIR(t)) and the variation of recovery rate (γSIR(t)) were shown. The fourth row represented the variation of effective reproduction number (ℝSIR(t)) for the SIR model.
In Figure 2, we have shown the variation of different parameters for the SIR model for few selected Indian states. In the second and third row, the variation of βSIR(t) and the variation of γSIR(t) were shown. The fourth row showed the variation of effective reproduction number (ℝSIR(t)) for the SIR model.

Variation of different parameters for four Indian states Delhi, Rajasthan, Gujarat, and Uttar Pradesh. First row: Variation of the total number of infected, recovered, and deceased individuals with time. Second row: Variation of effective contact rate β(t) with time using three different models. Third row: Variation of recovery rate γ(t) with time using three different models. Fourth row: Variation of the effective reproduction number ℝ(t) with time using three different models. Fifth row: Variation of maximum temperature Tmax with time. Sixth row: Variation of maximum relative humidity RHmax with time.
For the study of SIR, SIRD, and SEIR models, we assumed that the total population N was the same throughout the study. It was also assumed that those individuals, who have recovered from the disease can not become infected again. For a few special cases, βn and corresponding ℝn may be negative for a certain value of n [12] which are not physical. For a few particular days, the value of ℝn was very high which may bias the correlation studies in later Sections. We have not used these values for our study.
2.2 SIRD model
The SIRD model [20] is the modified version of the SIR model. We used this model to study the different time dependent parameters like recovery rate (γ), contact rate (β), and effective reproduction number (R). At any time t, S(t) be the total number of susceptible individuals, I(t) be the total number of infected individuals, R(t) be the total number of recovered, D(t) be the total number of deceased individuals from the epidemic.
Here, β is the contact rate and γ is the recovery rate and α is the mortality rate. We shall mostly deal with fractions:  . From conservation law s(t)+i(t)+r(t)+d(t)=1
The SIRD model can be expressed as


We use the discrete form of the equations (10) to (13).
From Eq (11) we can write

The effective reproduction number ℝ(t) can be given by

In Figure 1, we have shown various parameters for the SIRD model. In the second and third rows, the variation of effective contact rate (βSIRD(t)) and the variation of recovery rate (γSIRD(t)) were shown. The fourth row represented the variation of effective reproduction number (ℝSIRD(t)) for the SIRD model.
In Figure 2, we have shown a variation of different parameters for the SIRD model for few selected Indian states. In the second and third row, the variation of effective contact rate (βSIRD(t)) and the variation of recovery rate (γSIRD(t)) were shown. The fourth row represents the variation of effective reproduction number (ℝSIRD(t)) for the SIRD model.
2.3 SEIR model
The Susceptible-Exposed-Infectious-Removed (SEIR) model [15] is the most studied one. The SEIR model is a variant of the SIR model (Section 2.1). At any time t, S(t) be the total number of susceptible individuals, E(t) be the total number of exposed individuals, I(t) be the total number of infected individuals, and R(t) be the total number of removed (recovered or deceased till a given time) individuals from the epidemic. In the SEIR model, we considered the average incubation period 1/σ as a constant.
The parameter β is the product of the average number of contacts per person and per unit time by the probability of disease transmission in contact between susceptible and infectious individuals. γ is the recovery rate. The compartment E of the exposed individuals in the SEIR model makes the model slightly more delicate. The SEIR model is a compartmental model used to understand the mathematical modeling of infectious diseases in a large population. If N is the total population size then in fraction form  ,
,
Conservation of the total number of individuals, we have the relation

For any time t ≥ 0, the SEIR model can be expressed by the differential equations


We use the discrete form of equations (16) to (19).
Now we use equation (17) to find βn

Using Eq(17), Eq(18) and Eq(20) we can show

The effective reproduction number ℝ(t) can be given by

In Figure 1, we have shown various parameters for the SEIR model. In the second and third rows, the variation of effective contact rate (βSEIR(t)) and the variation of recovery rate (γSEIR(t)) were shown. The fourth row represented the variation of effective reproduction number (ℝSEIR(t)) for the SEIR model.
In Figure 2, we have shown the variation of different parameters for the SEIR model for few selected Indian states. In the second and third row, the variation of effective contact rate (βSEIR(t)) and the variation of recovery rate (γSEIR(t)) were shown. The fourth row showed the variation of effective reproduction number (ℝSEIR(t)) for the SEIR model.
3 Result
We studied the evolution of effective reproduction number ℝ(t) for India using three different models. For our study, we used the time series data for infected, recovered, and deceased individuals of COVID-19 [11]. To study the dependency of ℝ(t), β(t), γ(t) on the temperature and humidity variation [31] of a state, we used temperature and humidity of the capital of the corresponding state as representative. We restricted our study for states for which the number of infected individuals was greater than 1000 till 31st May. In the first row of Figure 1, we have shown the daily variation of the number of infected, recovered, and deceased individuals. In the second row of Figure 1, we have shown the variation of the effective contact rate β(t) for three different models. The SEIR model fluctuates at the beginning of the pandemic but the value of β(t) is close for SIR and SIRD models. In the third row of the figure, we have shown the variation of recovery rate γ(t) with time which is close for the three models and varies between 0 to 0.15. In the fourth row of Figure, we have shown the variation of ℝ(t) for three different models. The SEIR model showed more fluctuation at the beginning of the study. But, since we restricted our study of temperature and humidity dependency (in Section 3.1 and 3.2) with effective reproduction number for individual states for the time when the number of infected was more than 50 individuals, the initial time where βSEIR and ℝSEIR fluctuate was not be used for our study.
We have studied the evolution of different parameters for different Indian states using three different models. In Figure 2, we have shown an example of the variation of different parameters for four states Delhi, Rajasthan, Gujarat, Uttar Pradesh. In Figure 2, the first row showed the variation of the number of infected, recovered and deceased individuals with time, the second row showed the variation of effective contact rate β(t) with time, the third row showed the variation of recovery rate γ(t) with time, the fourth row showed the variation of effective reproduction number ℝ(t) with time and the fifth and the sixth rows showed the variation of maximum air temperature Tmax and maximum relative humidity RHmax respectively.
3.1 Temperature dependence of ℝ (t)
We studied the variation of effective reproduction number ℝ(t) on temperature for different states of India. The linear regression method [10] is used to find the regression coefficient R2 which is the goodness of fit for linear regression models. Table 1 showed the result of the linear regression method for three different models. The positive sign indicated the correlation between effective reproduction number (ℝ(t)) and maximum temperature (Tmax) with a positive slope and the negative sign indicated a correlation between ℝ(t) and temperature with a negative slope. It should be noted that the correlation with negative slope indicated that the effective reproduction number (ℝ(t)) will decrease with the increase of the temperature.
Value of regression coefficient R2 using different models for different states of India from ℝ (t) vs Tmax plot.
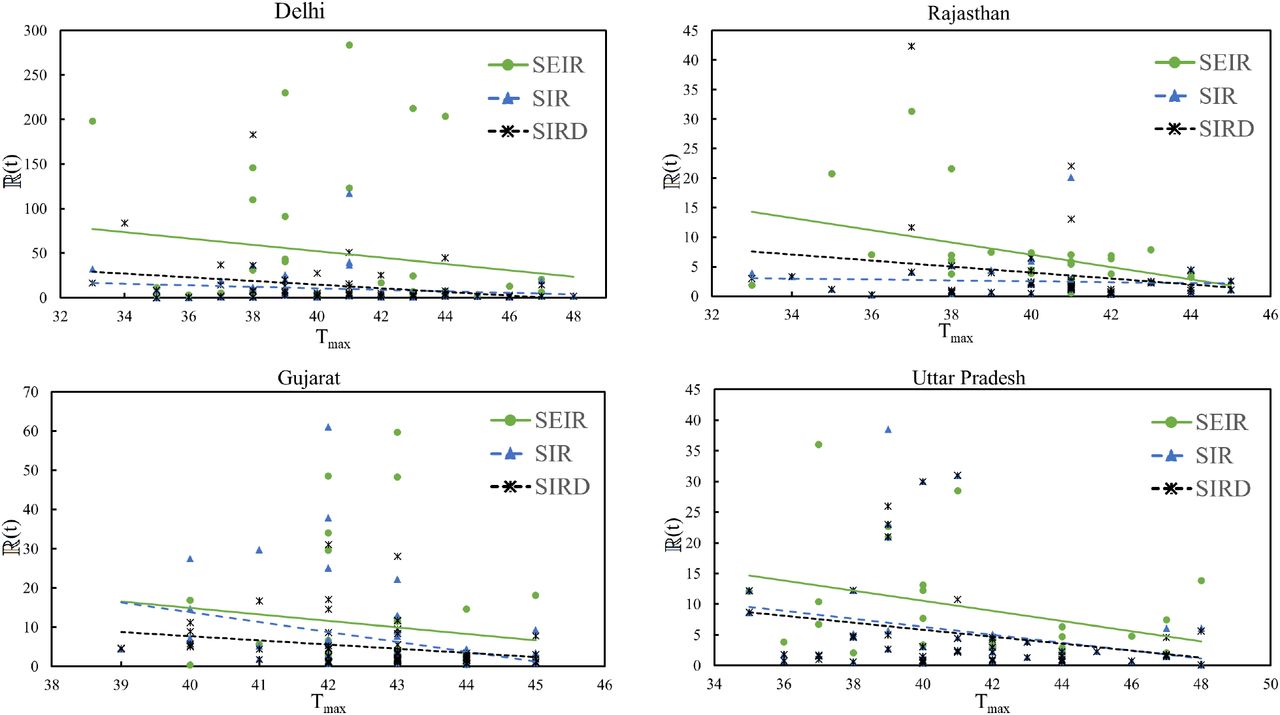
Table 1 indicated the correlation between effective reproduction number with maximum air temperature was not strong and for different states of India, correlations with positive and negative slopes were found. For nine states out of fourteen states, we have found a correlation with negative slopes for all three models, and for only two states (Karnataka and West Bengal) we have found a correlation with positive slopes for all three models. The states Andhra Pradesh, Bihar, Delhi, Gujarat, Madhya Pradesh, Punjab, Rajasthan, Tamil Nadu, and Uttar Pradesh showed a correlation between ℝ(t) and maximum air temperature Tmax with a negative slope for all the three models. For the remaining states in the table, we saw mixed results between different models. Figure 3 represented the variation of effective reproduction number ℝ(t) with maximum temperature Tmax for four representative states Delhi, Rajasthan, Gujarat, and Uttar Pradesh. All four states showed a correlation with the negative slope between effective reproduction number ℝ(t) and maximum air temperature Tmax for all the three models. For the state Assam, the number of infected individuals crossed 50 after the second week of May resulting less number of points in correlation study. So, we did not include it in the table.

Variation of effective reproduction number ℝ(t) with maximum temperature Tmax for four different Indian states Delhi, Rajasthan, Gujarat, and Uttar Pradesh.
3.2 Humidity dependence of R(t)
Humidity also plays a crucial role as a driving environmental parameter on the spread of a virus. We also investigated whether there is any dependence of relative humidity on the spread rate of COVID-19. We studied the variation of effective reproduction number ℝ(t) with maximum relative humidity (RHmax). The linear regression method was used to find the parameter R2. We summarised the result of variation of the effective reproduction number (ℝ(t)) with the maximum relative humidity (RHmax) for different states of India in the Table 2. The table indicated that there was a correlation with negative a slope for seven states Delhi, Gujarat, Jammu and Kashmir, Maharashtra, Rajasthan, Tamil Nadu, and Uttar Pradesh for all the three models and we have found a correlation with a positive slope for three states Andhra Pradesh, Punjab, West Bengal for all three models. The rest of the states in the Table 2 showed a mixed correlation for different models. Figure 4 represents the variation of the effective reproduction number ℝ(t) with RHmax for four representative states Delhi, Rajasthan, Gujarat, and Uttar Pradesh. All four states showed a correlation with a negative slope between ℝ(t) and RHmax for all the three models.
Value of regression coefficient R2 using different models for different states of India for ℝ (t) vs RHmax plot.

Variation of effective reproduction number ℝ(t) with maximum relative humidity RHmax for four different Indian states Delhi, Rajasthan, Gujarat, and Uttar Pradesh.
4 Discussion
In the absence of any vaccine, different mitigation measures were used to control the spread of the disease like lockdown, using masks, personal hygiene, restriction of movement, etc. So, it was difficult to identify the effect of a single parameter on the spread of the disease.
It should be noted that except for Kerala and Maharashtra, for all other states we have used data from dates when strict lockdown measures were in place since we have used only dates when the infected number for an individual state is more than 50 and we restricted our study till 31st May as India started stepped unlocking from 1st June [5]. So, during the almost whole span of the study, the lockdown was imposed over India.
In India, the lockdown was started on 24th March. Figure 1 showed that the average value of β(t) and ℝ(t) in India for all models went down after the imposition of lockdown. The average value of β(t) for SIR and SIRD before the lockdown was 0.23 and 0.22 respectively, while the average value of β(t) after lockdown went down to 0.11 and 0.12 respectively. For the SEIR model, the value of β(t) went down from 1.15 to 0.28. The value of ℝ(t) also went down for all the models. For the SIR model, it changed from 19.7 to 5.2, and for SIRD model ℝ(t) went down from 15.4 to 4.6. So, it is clear that lockdown helped to control the spread of the disease.
For the study of the correlation between the maximum temperature and effective reproduction number, the SIR model showed a maximum correlation (13.9%) with a negative slope for the state Andhra Pradesh, whereas the SIRD model showed a maximum correlation (13.5%) for the same state. The SEIR model showed a maximum correlation (15.9%) with a negative slope for the state Rajasthan for ℝ(t) vs Tmax plot. The SEIR model was showing a higher correlation coefficient compared to SIR and SIRD. For all of SIR, SIRD, and SEIR models, 10 states out of 14 states were showing correlation with a negative slope. Among the states showing correlation with negative slopes for all three models, the median values of R2 for SIR, SIRD, and SEIR models were 6.7, 6.4, and 7.5 respectively. The corresponding mean values were 7.2%, 6.7%, and 7.4%.
For the study of the correlation between the relative humidity and effective reproduction number, the SEIR model showed a maximum correlation (21.3%) with a negative slope for the states Rajasthan, whereas the SIR and SIRD models showed maximum correlations with negative slope 13.4% and 17.7% for the states Tamilnadu and Gujarat respectively. For the SIRD and SEIR models, 9 out of 14 states showed a correlation with negative slope whereas, for the SIR model, 8 out of 14 sources showed a correlation with a negative slope for ℝ(t) vs RHmax plot. The SEIR model was showing a higher correlation coefficient compared to SIR and SIRD models. Among the 7 states showing correlation with negative potential for all states, the median values of R2 for SEIR, SIR, and SIRD models were 9.4, 8.0, and 7.0 respectively. The corresponding mean values were 10.8%, 7.1%, and 7.5%. The correlation coefficient was close for SIR and SIRD models.
5 Conclusion
We studied the relation between effective reproduction number with maximum temperature and relative humidity of a place using Indian states as a test case. We used the time when most of the states were in lockdown to minimise the effect of other parameters. We used SIR, SIRD, and SEIR models to calculate the effective reproduction number of a place. The linear regression method was used to look for any dependency between effective reproduction number with maximum temperature and relative humidity. Most of the states showed correlation with a negative slope between effective reproduction number with maximum temperature and relative humidity for all three models which indicate that the effective reproduction number tends to go down when maximum temperature and relative humidity increase. But, the regression coefficients R2 is low for these correlations which indicates that the correlation is not strong. Lockdown also played a crucial role in controlling the spread of the virus.
Data Availability
We have used data from https://github.com/datasets/covid-19


