
Abstract
In response to the novel coronavirus disease 2019 (CoViD-19) pandemic, national and local institutions have issued public-health orders to slow the spread of the disease. Comparing CoViD-19 trends over time and place may thus provide important public health insights about the impact of different strategies. To aid these comparisons, we illustrate the properties of 3 comparative indicators of CoViD-19 mortality using estimates and projections for the world’s most affected areas. We first demonstrate how a Crude CoViD-19 Death Rate (CCDR) incorporates the temporal dimension of CoViD-19 mortality. We also show how the advantage of the indirectly age-standardized Comparative CoViD-19 Mortality Ratio (CCMR). Finally, we calculate declines in life expectancy at birth that translate CoViD-19 mortality projections into an easily interpretable metric. Projections used to illustrate this yields a .6-year decline in life expectancy at birth for the U.S.A., for instance, which would be twice the largest single-year decline in life expectancy at birth induced by HIV/AIDS (between 1992 and 1993) or the total decline induced by opioid overdoses (between 2014 and 2017). Data about the pandemic are changing too rapidly to draw any conclusion from the current values of the indicators, however, and there are multiple reasons to expect substantial revisions of these projections.
Background
As of April 26, 2020, close to 3 million cases of the novel coronavirus disease 2019 (CoViD-19) had been reported worldwide, with more than 200,000 deaths attributed to the disease according to Johns Hopkins University’s Center for Systems Science and Engineering (CSSE).1 The most frequently cited of several online tools that have been developed to track the fast expanding pandemic, the CSSE interactive dashboard maps the location and number of confirmed CoViD-19 cases, deaths, and recoveries for all affected countries.
The CCSE numbers illustrate a public health emergency developing at a very fast pace. In response, national and local institutions have issued public-health orders to slow the spread of the disease and “flatten the curve” so that the number of infected individuals in need of intensive care peaks at a level lower than local hospital capacity. Comparing CoViD-19 trends over time and place may thus provide important public health insights about the strategies that have succeeded in reducing the need for emergency hospitalizations and, eventually, the CoViD-19 death toll. The number of reported cases seems to represent only a small, varying fraction of the actual number of cases,2 depending in particular on variable testing capacities. Deaths attributed to CoViD-19 provide a more reliable basis for comparative assessments. As the HIV pandemic made clear,3 a pandemic is more reliably tracked with mortality data. While the current CoViD-19 death toll is also undercounted due to cause-of-death mis-diagnostics and delays in reporting deaths at home and nursing homes, this death undercount is of a much smaller magnitude than the case undercount and can be expected to decline further over time.
The United States currently has the highest estimated number of CoViD-19 deaths, having surpassed Italy, which had earlier surpassed China. Obviously, comparing the number of deaths in countries home to 60 million (Italy), 330 million (U.S.A.) or 1.4 billion (China) people makes little sense. Dividing the number of CoVid-19 deaths by the population size, a comparative table on the CSSE website displays vastly different ratios: from .33 deaths per 100,000 people in China, to 16.43 in the United States and to 43.66 in Italy (as of April 26, 2020.)1 Considering the countries with at least 1,000 deaths, the largest ratio appears to be in Belgium, with 6,917 deaths but a ratio of 60.56 deaths per 100,000 people at the time.
While comparing the number of deaths to the population size is a necessary first step in comparing CoVid-19 mortality across countries, this ratio does not possess several desirable properties. First, it does not integrate the time dimension, that is, it does not differentiate between a number of deaths recorded in periods of different durations. In particular, while the ratio may appear small in comparison to the Crude Death Rate (CDR, in the order of 850 deaths per 100,000 person-year in the U.S.A.), the CDR includes deaths for one year whereas most of the CoViD-19 deaths registered to date occurred in the last 2 months. Second, the ratio does not control for the age distribution of the population, whereas strong variations in CoViD-19 mortality by age are already well established. Finally, national-level indicators mask important within-country differences. In China, the vast majority of deaths originated in one Province (Hubei), with a population size roughly equivalent to the national population of Italy. In the U.S.A., the epidemic might be better studied as several epidemics of variable timing and intensity than as one national epidemic. With about 6% of the U.S. population, the State of New York State had close to half of the CoViD-19 deaths reported in the country by the end of April.
Methods and Data
To address these shortcomings, this article illustrates the properties of 3 comparative indicators of CoViD-19 mortality. First, the Crude CoViD-19 Death Rate (CCDR) is simply a period death rate, structured like the Crude Death Rate (CDR), that is, expressed in deaths per person-year.
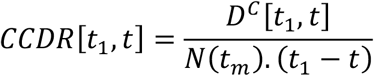
This indicator only requires an estimate or a projection of the cumulative number of CoViD-19 deaths in a given population by time t, DC[t1,t], the time of the first CoViD-19 death in the area, t1, and the size of the population at some point tm within that timeframe, N(tm).
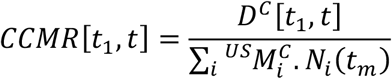
Second, the Comparative CoViD-19 Mortality Ratio (CCMR) is an indirectly age-standardized measure, structured like the Comparative Mortality Ratio (CMR):4
 where
where  is the CoViD-19 death rate specific to age group i in the U.S.A. and Ni(tm) is the size of the age group in the population. This indicator was selected because the calculation of (directly) age-standardized CoViD-19 mortality rates requires a breakdown of CoViD-19 deaths by age. Such a breakdown was only available for a limited number of countries.5 Among those, the Center for Disease Control (CDC) weekly breakdown of CoViD-19 deaths by age for the U.S.A. included the largest number of registered deaths6 and was selected as the standard.
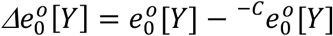
The third indicator translates the cumulative number of deaths due to CoViD-19 in the population during a reference period into an estimated decline in life expectancy at birth for the population for that reference period. This calculation requires previously projected life table functions for the period (i.e., not including CoViD-19 mortality). With life tables typically available for single or multiple calendar-year periods only, the difference can be calculated for a single calendar year:
 where
where  represents life expectancy at birth previously projected for the calendar year Y (i.e., not including CoViD-19 mortality) and
  represents its new projected value accounting for projected CoViD-19 mortality.
Details on the calculation of these three indicators are described in the online supplementary materials of this article. To illustrate the properties of these indicators, we calculate their values for a weekly updated set of cumulative CoViD-19 mortality estimates, from Johns Hopkins University’s CSSE,1 and projections, from the Institute for Health Metrics and Evaluation (IHME).7 Specifically, we calculate the CCDR and CCMR for the period starting on the date of the first CoViD-19 deaths reported in the population8 and ending on the reference date of the estimates or projections for Hubei Province (China), 14 Countries and 9 States in the U.S.A.—all Countries and States with over 1,000 estimated deaths due to CoViD-19 as of April 20th, 2020. Hubei Province and these 14 countries jointly accounted for 85% of the global CoViD-19 deaths reported on the CSSE dashboard at the time (IHME projections were only available for 13 of the countries and the U.S. States). Finally, we calculate the difference in life expectancy at birth in each of the 13 Countries for calendar year 2020.
Results
We now briefly describe the properties of the 3 indicators using calculations from the most recent weekly dataset (May 15, Table 1). We first point out a few additional insights from calculating the period CCDR at the level of a Province (China) or State (U.S.A.) rather than merely at the Country level. For instance, whereas the ratio of estimated number of CoViD-19 deaths/population size in China is far smaller than in most other countries, the current value of CCDR for Hubei Province remains smaller but somewhat comparable to those in some of the other areas considered here (e.g., a little over half the value in California). The CCDR values for U.S. States also confirm stark differences in their CoViD-19 mortality so far, with the value in the State of New York nearly twice the highest value for a Country (Belgium). With a combined population size of 52.3 million, thus comparable to the size of a large European Country, the 5 Northeastern U.S. States (Connecticut, Massachusetts, New Jersey, New York & Pennsylvania) also exhibit a higher FDTD CCDR than any European Country.
Comparative CoViD-19 Mortality Indicators by Country, Province & State (ranked by FDTD CCMR estimate)
As opposed to a simple ratio of CoViD-19 deaths over population size, the period CCDR controls for the duration of the period to which the cumulative count of deaths pertains. This is illustrated by the fact that CCDR values are typically higher for estimated than for projected mortality, whereas the simple ratio can only increase over time. The period CCDR thus provides a better picture of the temporal distribution of deaths. At this time, the IHME projections only yields higher CCDR values for the period ending on August 4, 2020 than the current CSSE estimates in Pennsylvania and Brazil, where IHME predicts a substantial future increase in mortality. The CCDR also makes it easier to compare with mortality indicators available for calendar years: its value for the State of New York (825.0 deaths per 100,000 person-year), for instance, exceeds the State’s most recent annual CDR estimate available for all causes combined (7.827 deaths per 1,000 person-year for 2017).9
Relative to the CCDR, the CCMR has the additional advantage of controlling for the age distribution of the different populations. As European countries have “older” age distributions, their CCMR values relative to the U.S.A. (by design equal to 1 for the estimation period) are thus lower than the ratio of their CCDR to the U.S. CCDR. The highest current CCDR for a Country (Belgium) is about 4 times its value for the U.S.A., but Belgium’s CCMR for the same period is 2.93. The opposite happens for Hubei Province and other Countries in Asia (Iran and Turkey) and South America (Brazil), whose population is “younger” than the U.S. population. The CCMR for Hubei Province is .27, close to the values for Germany (.31) or California (.35). For the same reason, Iran—whose CCDR value is less than a third of the U.S.A.—has a CCMR of .70 relative to the U.S.A., close to the CCMR values for Switzerland and Canada.
According to IHME projections, the Countries with the highest CCMR by early August would be Brazil (1.34) and Belgium (1.27), still substantially lower than the highest value for the State of New York (3.03). Across countries, these projections translate into declines in life expectancy at birth for 2020 of nearly a year (.976) in Belgium and about .8 in Brazil, .7 in Spain, Sweden and the United Kingdom, .7 in France, Italy, and the U.S.A.
Discussion
The results above are used to illustrate the properties of the 3 proposed indicators and the limitations of considering CoViD-19 mortality differences across Countries only. To summarize, in order of increasing data requirements, the period CCDR incorporates the temporal dimension of CoViD-19 mortality. The CCMR (indirectly) standardizes for differences in population age distribution. Relative to the U.S.A., age standardization lowers the CoViD-19 mortality assessment in European Countries and raises it in Asian and South American countries. An age-standardized indicator as well, the decline in life expectancy at birth translates CoViD-19 mortality projections into an easily interpretable metric. A decline of .3 of a year in life expectancy at birth, currently projected in at least 10 countries, would be comparable to the decline in life expectancy at birth during the last two public health crises in the U.S.A.: a decline from 75.8 in 1992 to 75.5 years in 1993 (AIDS mortality) and from 78.9 years in 2014 and 78.6 years in 2017 (opioid-overdose mortality).10 However, the decline would be induced by mortality changes over a more condensed time scale in the case of the CoViD outbreak.
More importantly, data about the pandemic are changing too rapidly to draw any conclusion from the current values of the indicators. Based on a single set of estimates and projections, this set of results fails to express the uncertainty surrounding future projections and even current estimates. To take a single example, on April 29, 2020, the Global Epidemic and Mobility Model (GLEAM) used by researchers at Northeastern University projected between 60,000 and 121,000 CoViD-19 deaths in the U.S.A. by May 12, 2020 under the “mitigated” scenario with stay-at-home policy.11 Other models suggested even higher numbers for the same period, whereas the IHME projected 68,000 deaths by August 4, 2020.12 Moreover, at the moment none of these models can predict the likelihood of a second wave of infections later in the year.
The standardized indicators could be further refined by also considering sex differences in CoViD-19 mortality. At the time the derivation of the indicators was developed, the CDC reported deaths by age and deaths by sex separately.13 Because population sex ratios tend to vary less than their age distributions, we prioritized accounting for age differences. The CDC now tabulates CoViD-deaths by both sex and age-group become, which allows for CCMR and differences in life expectancy estimation that jointly standardize on both dimensions. The eventual decline in life expectancy will also depend on the “downstream” effects of the pandemic and mitigating policies, which may affect mortality from other causes. While mortality rates from some causes may well decline (e.g., motor-vehicle injuries), mortality rates from other causes are likely to increase, especially in places where hospitals’ intensive-care capacities became saturated by the surge in CoViD-19 emergency hospitalizations. Current CDC estimates on excess deaths seem to indicate the latter.14
The rapidly evolving understanding of CoViD-19 mortality requires frequent updates and flexibility. In order to update our indicators regularly, we are running a weekly web-scraping tool to extract the CDC breakdown of CoViD-19 deaths, and both estimated and projected number of CoViD-19 deaths. To allow for customized calculations derived for different periods and populations or from different data sources, we are making both our web-scraping script and spreadsheet for deriving the indicators available on a Github repository.15 Our own weekly results updates and occasional methodological updates will be added to the repository as well.
Data Availability
All data are available online and can be accessed directly or through a web scraping routine that we provide at https://github.com/statsccpr/ind-cov-mort
https://www.arcgis.com/apps/opsdashboard/index.html#/bda7594740fd40299423467b48e9ecf6
Acknowledgment
The authors benefited from facilities and resources provided by the California Center for Population Research at UCLA (CCPR), which receives core support (P2C-HD041022) from the Eunice Kennedy Shriver National Institute of Child Health and Human Development (NICHD).


