
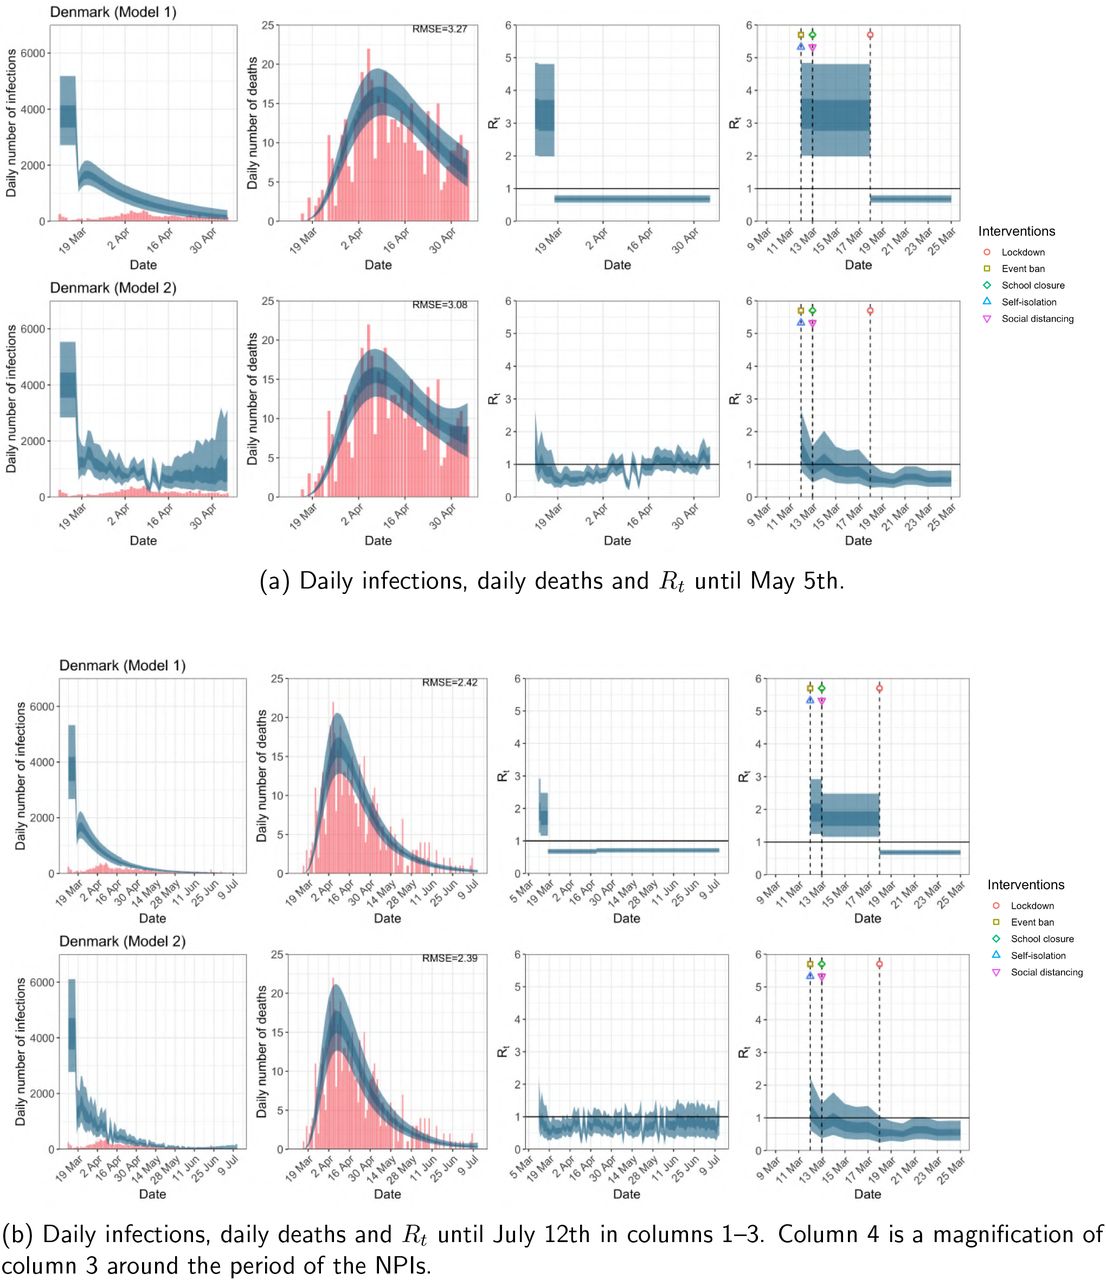
Figure A.5:
Denmark. The start time for the plots is 10 days before 10 deaths are recorded. Observed counts of daily infections and daily deaths are shown in red, and their corresponding 50% and 95% CIs are shown in dark blue and light blue respectively.