
Abstract
Obsessive-compulsive disorder (OCD) affects ∼1% of the population and exhibits a high SNP-heritability, yet previous genome-wide association studies (GWAS) have provided limited information on the genetic etiology and underlying biological mechanisms of the disorder. We conducted a GWAS meta-analysis combining 53,660 OCD cases and 2,044,417 controls from 28 European-ancestry cohorts revealing 30 independent genome-wide significant SNPs and a SNP-based heritability of 6.7%. Separate GWAS for clinical, biobank, comorbid, and self-report sub-groups found no evidence of sample ascertainment impacting our results. Functional and positional QTL gene-based approaches identified 249 significant candidate risk genes for OCD, of which 25 were identified as putatively causal, highlighting WDR6, DALRD3, CTNND1 and genes in the MHC region. Tissue and single-cell enrichment analyses highlighted hippocampal and cortical excitatory neurons, along with D1- and D2-type dopamine receptor-containing medium spiny neurons, as playing a role in OCD risk. OCD displayed significant genetic correlations with 65 out of 112 examined phenotypes. Notably, it showed positive genetic correlations with all included psychiatric phenotypes, in particular anxiety, depression, anorexia nervosa, and Tourette syndrome, and negative correlations with a subset of the included autoimmune disorders, educational attainment, and body mass index.. This study marks a significant step toward unraveling its genetic landscape and advances understanding of OCD genetics, providing a foundation for future interventions to address this debilitating disorder.
Introduction
Obsessive-compulsive disorder (OCD) is a chronic psychiatric illness that affects approximately 1% of the population (Fawcett, 2020) and is characterized by obsessions and compulsions that vary in type and severity as well as over time across individuals. OCD is responsible for profound personal and societal costs (World Health Organization, 2008), including a substantial risk of suicide (∼10 times higher than the population prevalence; Fernandez de la Cruz, 2017) as well as an increase in general mortality (Meier, 2016). OCD is highly heritable, with twin-based heritability estimates ranging between 27-47% in adults and 45-65% in children (Blanco-Vieira et al., 2023; Burton et al., 2018; Pauls, 2008; van Grootheest et al., 2005). The SNP-based heritability of OCD has been reported to be between 28% and 37% (SEs between 4-11%; Mahjani, 2022a; IOCDF & OCGAS et al., 2018; Davis et al., 2013), with heritability estimates for childhood-onset OCD at the higher end of the range, in line with findings from twin studies.
Two preliminary iterations of the OCD GWAS meta-analysis presented here, both containing a subset of the data included in this analysis, showed robust evidence of association of common genetic variation with OCD (Strom et al., 2021, Strom et al., 2024), and SNP-based heritabilities of 8.5% (SE = 0.4%, assuming a 3% population prevalence) and 16% (SE = 1.2%, assuming a 2% population prevalence). The first GWAS (Ncases = 14,140, Ncontrols = 562,117; Strom et al., 2021) found one genome-wide significant SNP associated with OCD, while the second (Ncases = 37,015, Ncontrols = 948,616; Strom et al., 2024) identified 15 independent genome-wide significant SNPs. Both studies found genetic correlations with other psychiatric disorders and traits and results from tissue enrichment and single-cell enrichment analysis provided preliminary insights into brain regions and cell types involved in OCD susceptibility. Multiple cortical regions, the amygdala, and hypothalamus, as well as 12 cell types (all neurons) were linked to OCD. Although representing valuable initial steps, it is evident that further expansion of the sample size in genetic studies for OCD is necessary for a more comprehensive understanding of the underlying genetic etiology, its genetic relationships with other related disorders, and to begin elucidating the biological mechanisms underlying OCD susceptibility.
The current study combines the data from the two preliminary OCD-GWASs described above and adds additional cohorts (∼9,000 cases). This results in the largest and most well-powered GWAS of OCD to date, with a ∼20-fold increase of OCD-cases compared to the previous largest published OCD GWAS (IOCDF and OCGAS et al., 2018) Based on the results from the meta-analysis, we conducted secondary analyses, including positional and functional fine-mapping of SNPs and genes, structural equation modeling to examine possible genetic differences in sample ascertainment across cohorts, protein and transcriptome-wide association analyses, single-cell enrichment, and genetic correlations with other traits. These results provide more detailed insight into the genetic underpinnings and biology of OCD.
Results
GWAS meta-analysis of OCD identifies 30 independent genome-wide significant variants
We conducted a GWAS meta-analysis of 28 European-ancestry OCD case-control cohorts, comprising 53,660 cases and 2,044,417 controls (effective sample size of ∼210,000 individuals). Ascertainment of the OCD cases varied across cohorts: OCD diagnosis was either determined a) by a healthcare professional in a clinical setting (18 cohorts, N = 9,089 cases), b) from health records or biobanks (7 cohorts, N = 9,138 cases), c) in a clinical setting or from health records with the additional characteristic that all OCD cases were primarily collected for another psychiatric disorder they comorbidly exhibited (3 cohorts, N = 5,266 cases), or d) by self-reported clinical diagnosis in a consumer-based setting (23andMe, Inc., N = 30,167 cases). Cohort details, including phenotypic assessment, quality control, and individual cohort GWAS analyses are in Supplementary Note 1 with an overview in Supplementary Table S1. We identified 30 independent SNPs (see Supplementary Note 2 for a definition of independence) among the 1,672 SNPs that exceeded the genome-wide threshold for significance (P < 5x10-08; Manhattan plot in Figure 1, regional association plots and forest plots in Supplementary Figures S1-S30, and a list of all independent genome-wide significant SNPs in Table 1 with additional details in Supplementary Table S2 and S3). The independence of the 30 lead SNPs was subsequently validated using conditional and joint analysis (GCTA-COJO) (Yang et al., 2012) (Supplementary Table S4). An analysis of the X-chromosome, conducted in a subset of the data for which this information was available (23andMe dataset, N = 30,167), yielded no significant associations (see Supplementary Note 3 for details). Of the 15 genome-wide significant SNPs reported in pre-prints previously (Strom et al., 2021; Strom et al., 2024), 13 were genome-wide significant in the current GWAS, with the remaining two showing suggestive significance (P = 5.23x10-08 and P = 2.2x10-07; Supplementary Table S5).
Shown are the SNP, the chromosome (CHR), base pair position on the genome (BP), p-value (P), effect estimate as an odds ratio (OR), standard error of the effect estimate (SE), effect allele and non-effect allele (A1/A2), frequency of A1 in cases (FRQCA) and in controls (FRQCO), imputation quality score (INFO), number of genes in a region of 6.5kb around the SNP (N Genes 6.5kb), and a curated list of phenotypes that also showed a genome-wide significant association with this SNP (in one or more of the following four databases: causalDB (J. Wang et al., 2020), GenomeAtlas (Watanabe et al., 2019), NHGRI-EBI GWAS catalog (Buniello et al., 2019), IEU Open GWAS project (Elsworth et al., 2020). If fewer than 4 traits are significant across all four databases, all 4 traits are shown, if more than 5 traits are significant across the databases, neuropsychiatric traits are prioritized (closely related traits are summarized into one trait category). Previously identified GWAS hits for OCD (or SNPs in high LD with a previously identified SNP) are in cursive. For a full list of associations in the four databases see Supplementary Table S17a-d). A more detailed list of the significant SNPs can be found in Supplementary Table S2.

Manhattan plot of OCD GWAS meta-analysis: The y-axis represents –log10 p-values for the association of variants with OCD using an inverse-variance weighted fixed effects model. The x-axis shows chromosomes 1 to 22. The horizontal red line represents the threshold for genome-wide significance (P = 5x10-08). Index variants of genome-wide significant loci are highlighted as a green diamond.
No statistically significant heterogeneity was observed across individual cohorts for the 30 genome-wide significant SNPs, as assessed with Cochran’s Q-test (see Supplementary Figure S31), the I2 statistic, and GenomicSEM’s (Grotzinger et al., 2019) QSNP -statistic (see Supplementary Table S2). Additional genome-wide analyses of samples grouped by clinical, comorbid, biobank, and 23andMe (Supplementary Table S3, Supplementary Figures S32-S36) showed little evidence of sample ascertainment impacting our results, as demonstrated by moderate to high genetic correlation estimates across the subgroups (between 0.63, SE = 0.11 for biobanks and comorbid, and 0.92, SE = 0.07 for 23andme and comorbid, see Supplementary Table S6), and an excellent fit for a one-factor GenomicSEM model of the four subgroups (Supplementary Table S7 and Supplementary Figure S37). See Supplementary Note 4 for analyses details. The SNP-heritability (assuming a 1% population prevalence) was 6.7% (SE = 0.3%), with slightly higher estimates for the clinical ( , SE = 1.5%) and comorbid (
 , SE = 1.7%) subgroups (see Supplementary S1 for all sub-group heritability estimates).
Gene-based findings
Positional and functional QTL gene mapping
We identified risk genes for OCD using six positional and functional QTL gene-based mapping approaches. Positional mapping was performed with mBAT-combo (Li et al., 2023). Functional eQTL mapping was performed with Transcriptome-wide Association Study (TWAS) (Gusev et al., 2016) using PsychENCODE gene expression weights (Gandal et al., 2018), and Summary-based Mendelian Randomization (SMR) (Zhu et al., 2016) using whole blood eQTLGen (Võsa et al., 2021) and MetaBrain (Qi et al., 2018) datasets. Functional protein QTL (pQTL) mapping was done using a protein-wide association study (PWAS) of human brain protein expression panels (Wingo et al., 2021). Finally, we used PsyOPS, which combines positional mapping with biological annotations, to further prioritize risk genes within genome-wide significant loci. We identified 207 significant (Bonferroni correction, P < 2.67 × 10⁻⁶) genes with mBAT-combo, and 24 genes using TWAS (P < 4.76 × 10⁻⁶), 14 of which were conditionally independent. The SMR-eQTLGen analysis identified 39 significant risk genes (P < 4.28 × 10⁻⁶), and the SMR-MetaBrain analysis identified 14 risk genes (P < 9.23 × 10⁻⁶). The PWAS identified 3 significant genes (P < 3.39 × 10⁻⁵), while PsyOPS prioritized 29 genes. In total, 251 genes were significantly associated with OCD through at least one gene-based approach, and 48 were implicated by at least 2 methods. For details about mapping approaches, the respective QTL data used in the analyses, and individual results for each gene-based approach, refer to the Online Methods, Supplementary Note 6, and Supplementary Tables S8-S13.
From the list of 48 genes implicated by at least 2 approaches, we prioritized likely causal genes for OCD using colocalization (TWAS-COLOC) and SMR-heterogeneity in dependent instruments (SMR-HEIDI) tests. Colocalization was used to identify significant TWAS associations where the underlying GWAS and eQTL summary statistics are likely to share a single causal variant. Similarly, HEIDI was used to select SMR associations where the same causal variant affects gene expression and trait variation. 25 of the 48 genes that were implicated in OCD by at least two gene-based tests were also significant in either the TWAS-COLOC or SMR-HEIDI tests, implying causality (Figure 2A). Only two of the 25 genes were prioritized by both TWAS-COLOC and SMR-HEIDI, the WD repeat domain 6 gene (WDR6; implicated by mBAT-combo, TWAS, and SMR) and the DALR Anticodon Binding Domain Containing 3 gene (DALRD3; also implicated by mBAT-combo, TWAS, and SMR). Another gene of interest, Catenin Delta 1 gene (CTNND1), was implicated by 3 of our 5 approaches (mBAT-combo, TWAS, PWAS) and showed evidence for colocalization. Only three genes were implicated in the PWAS, of which CTNND1 was the only gene that was implicated in both the PWAS and the TWAS. In the PWAS, downregulation of CTNND1 protein expression in human dorsolateral prefrontal cortex was significantly associated with OCD risk (Z = –4.49, P = 7.11x10-06; Supplementary Table S12), consistent with the downregulation of CTNND1 gene expression in prefrontal cortex in the TWAS (Z = –6.86, P = 6.90x10⁻¹²; Supplementary Table S9).

(A) List of 25 genes that were implicated in at least two of the five different gene-based tests (significance indicated by grey dots) and passed the TWAS colocalization and/or SMR-Heidi filters (significance indicated by orange dots). Conditionally independent genes within each locus are indicated by blue dots. (B) Enrichment of OCD GWAS signal in human brain-related tissues from GTEx (v8). No significant enrichment was observed in the peripheral tissues (not included in the figure). The horizontal bar size represents the significance of the enrichment measured using the MAGMA gene set enrichment test or partitioned LDSC. (C) Top 20 brain cell types enriched with OCD GWAS signal using MAGMA. Blue crosses represent a significant enrichment of OCD GWAS signals (false discovery rate, FDR < 0.05), while pink crosses indicate non-significant enrichment. Grey points represent the association (-log10[p-value]) for each cell cluster (“level 5” analysis defined by Zeisel 2018) in a given cell type (e.g., Excitatory neurons, cerebral cortex).
Tissue and cell type enrichment analysis
After mapping significantly associated SNPs from the GWAS meta-analysis to likely causal genes, we explored which tissues or cell types showed enriched gene expression of OCD associated genetic signals. We performed tissue and cell type enrichment analysis using a previously described approach (Bryois et al., 2020) on published human gene expression datasets from bulk tissue RNA-Seq data from GTEx and single-cell RNA-sequencing data from the adult mouse central and peripheral nervous system (Zeisel et al., Cell, 2018). We found enrichment of OCD GWAS signals in 6 out of 13 human brain tissue types in GTEx, but no enrichment in human peripheral tissues (Figure 2B, Supplementary Table S14). In the adult mouse central and peripheral nervous system, we found enrichment of OCD GWAS signals in 41 out of 166 tested cell types from mouse brain using the MAGMA gene-set enrichment test. Strong enrichment of OCD GWAS signal was especially observed in excitatory neurons of hippocampus and cerebral cortex, as well as D1 and D2 medium spiny neurons (Figure 2C, Supplementary Table S15).
Genetic relationship of OCD with other phenotypes
Using phenome-wide association analysis, we examined whether the 30 independent OCD-associated variants identified by our GWAS meta-analysis have previously been associated with other phenotypes (see Supplementary Tables S16a-d for look-ups in four, partially overlapping GWAS-databanks and Table 1 for highlighted associations). 22 of the 30 variants have previously been associated with other phenotypes, including psychiatric disorders or traits such as SCZ (seven SNPs), depression/MDD (two SNPs), bipolar disorder (BD, one SNP), and neuroticism traits (seven SNPs). In addition, associations within other phenotypic domains have been previously reported; e.g., seven SNPs have been reported to be associated with educational attainment, and eight with body fat mass or body mass index.
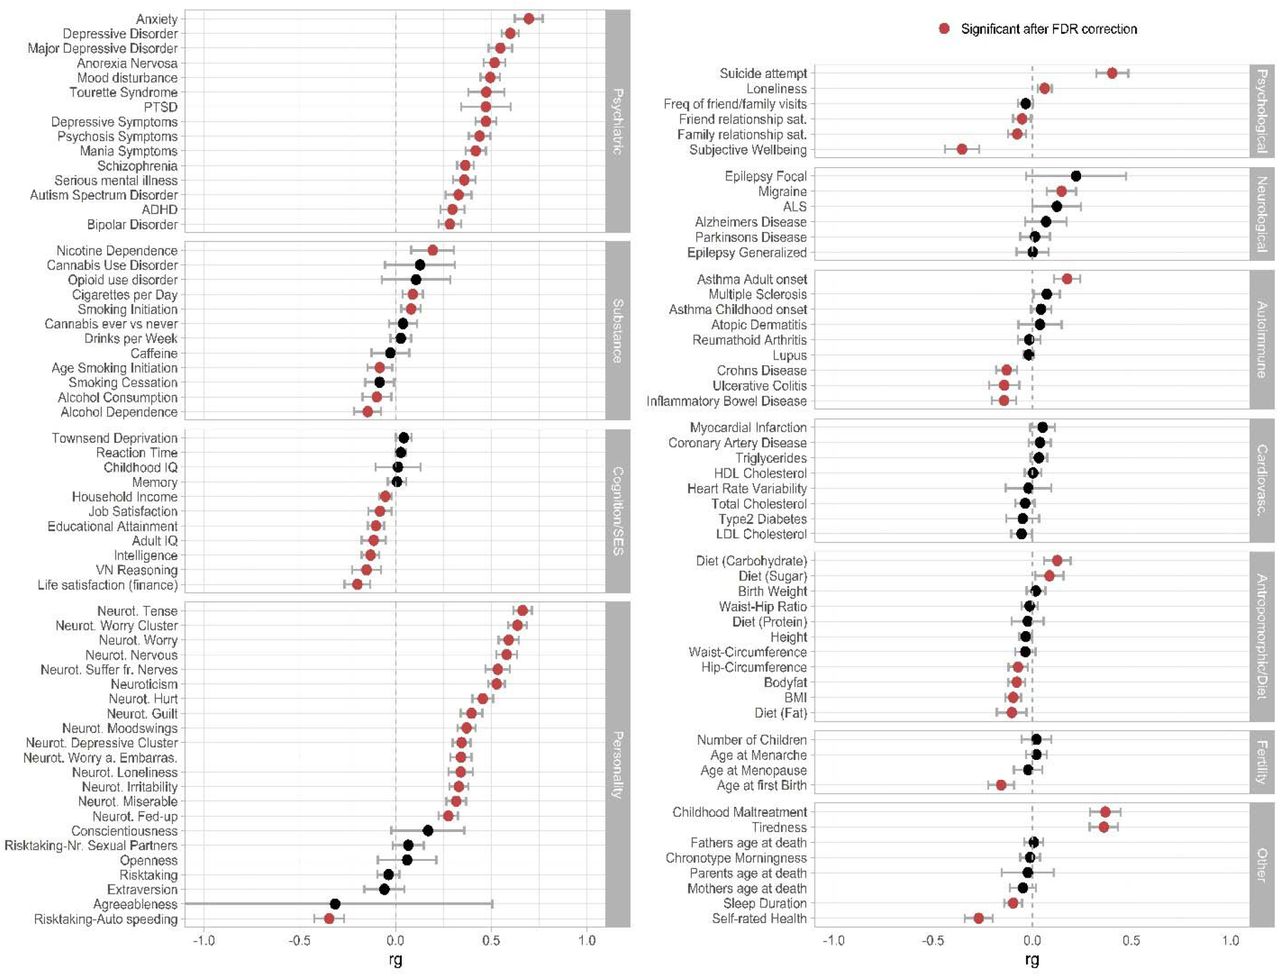
We further used bivariate linkage-disequilibrium score regression (LDSC) to investigate the extent of genetic correlations between OCD and 112 previously published GWASs encompassing psychiatric, substance use, cognition, socioeconomic status (SES), personality, psychological, and neurological phenotypes, among others (Figure 3). 65 phenotypes showed a significant correlation with OCD after false-discovery rate (FDR) correction for multiple testing. OCD was significantly positively correlated with all tested psychiatric phenotypes, the highest correlations being with anxiety (ANX, rG = 0.70, 95% CI [0.63, 0.77], PFDR = 4.26x10-76), followed by depression (DEP, rG = 0.60, CI = 0.04, PFDR = 7.05x10-156), anorexia nervosa (AN, rG = 0.52, 95% CI [0.46,0.58], PFDR = 1.99x10-70), Tourette syndrome (TS, rG = 0.47, 95% CI [0.38, 0.56], PFDR = 6.64x10⁻²³), and post-traumatic stress disorder (PTSD, rG = 0.48, 95% CI [0.47, 0.49], PFDR = 8.07x10⁻¹³) (Figure 3). Significant positive genetic correlations were also obtained for neuroticism (rG = 0.53, 95% CI [0.49, 0.57], PFDR = 1.95x10-125), in particular for the worry subcluster (rG = 0.64, 95% CI [0.59, 0.69], PFDR = 3.19x10-147), and all individual items belonging to the worry subcluster, with slightly lower estimates for the depressive sub-cluster (rG = 0.35, 95% CI [0.33, 0.37], PFDR = 2.94x10-46). Suicide attempt (rG = 0.40, 95% CI [0.32,0.48], PFDR = 1.30x10⁻²¹), history of childhood maltreatment (rG = 0.37, 95% CI [0.29, 0.45], PFDR = 3.56x10⁻²⁰), and tiredness (rG = 0.36, 95% CI [0.29, 0.43], PFDR = 5.52x10⁻²²) were also notable for strong positive associations with OCD. Of the assessed neurological disorders, OCD only significantly correlated with migraine (rG = 0.15, 95% CI [0.8, 0.22], PFDR = 1.94x10-04). Some auto-immune disorders, such as Crohn’s disease (rG = -0.13, 95% CI [–0.18, –0.08], PFDR = 4.79x10-06), ulcerative colitis (rG = -0.14, 95% CI [–0.22, –0.06], PFDR = 6.05x10-05), and inflammatory bowel disease (rG = –0.14, 95% CI [–0.20, –0.08], PFDR = 1.16x10-05) showed negative correlations with OCD (see Figure 3, Supplementary Table S17, and Supplementary Note 5 for a more in depth discussion of all significant genetic correlations, as well as Supplementary Table S18 and Supplementary Figure S38 and S39 for sub-group specific genetic-correlation estimates).

Genetic correlations (rg) between the OCD GWAS results and 112 psychiatric, substance use, cognition/socioeconomic status (SES), personality, psychological, neurological, autoimmune, cardiovascular, anthropomorphic/diet, fertility, and other phenotypes. References of the corresponding summary statistics of the GWAS studies can be found in Supplementary Table S1. Error bars represent 95% confidence intervals, red circles indicate significant associations after FDR correction for multiple testing. Black circles indicate associations that are not significant after FDR correction.
Discussion
The OCD GWAS reported here, comprising over 53,000 cases, identified 30 independent genome-wide loci. Common SNPs explained 6.7% of the variation in OCD risk in our meta-analysis (LDSC with an assumed population prevalence of 1%), a significant reduction from the 28-37% reported previously (Davis et al., 2013; Stewart et al., 2013; Mattheisen et al., 2015; IOCDF & OCGAS et al., 2018; Mahjani et al., 2022a), Nevertheless, heritability estimates were higher for the clinical (16.4%) and comorbid subgroups (13.3%). The current estimates are comparable to those of other psychiatric and substance use disorders, with SNP-h2 estimates ranging between 9 and 28% (Derks et al., 2022). Similar to ADHD (Demontis et al., 2019; 2023), depression (Howard et al., 2018; Wray et al., 2019; Cai et al., 2020; Als et al., 2023), and other psychiatric disorders, expanding the phenotype definition in OCD has increased genetic heterogeneity, potentially accounting for the observed decrease in SNP-h2 compared to earlier studies with more homogeneous data.
The most significant SNP rs78587207 (P = 5.28x10⁻¹²) identified in the GWAS analysis is located on chr11q12.1 and has been previously associated with several traits, most noteworthy with some neuropsychiatric phenotypes, including SCZ (P = 1.26x10⁻⁸; Pardiñas et al., 2018), depressive symptoms (P = 2.74x10⁻¹¹; Baselmans et al., 2019), and neuroticism (P = 2.96x10⁻¹¹; Baselmans et al., 2019). Gene-based analyses identified four putative causal genes within this locus in the current analysis. The closest gene to rs78587207 is catenin delta 1 (CTNND1), which encodes the cell adhesion molecule p120-catenin. This gene was associated with OCD using three gene-based tests (mBAT-combo, TWAS, and PWAS) and we found strong evidence for colocalization of the TWAS signal for CTNND1 in dorso-lateral prefrontal cortex (dlPFC) samples from the PsychENCODE consortium. dlPFC has been consistently implicated in the neural circuitry of OCD as well as in compulsivity more broadly as part of the cortico-striatal-thalamo-cortical circuitry (van den Heuvel et al., 2016; Shephard et al., 2021). The protein product of CTNND1 is a regulator of cell-cell adhesion (Davis et al., 2003) and plays a crucial role in gene transcription, Rho GTPase activity, and cytoskeletal organization (Yanagisawa et al., 2008; Daniel et al., 1999; Ishiyama et al., 2010). Other credible causal genes in the locus include cleavage factor polyribonucleotide kinase subunit 1 (CLP1), Thioredoxin Related Transmembrane Protein 2 (TMX2), and Zinc Finger DHHC-Type Palmitoyltransferase 5 (ZDHHC5). Rare genetic mutations in CLP1 are associated with pontocerebellar hypoplasia type 10, a very rare autosomal recessive neurodegenerative disease characterized by brain atrophy and delayed myelination resulting in intellectual disability (Schaffer et al., 2014). TMX2 is associated with increased risk of neurodevelopmental disorders with microcephaly, cortical malformations, spasticity, and congenital nervous system abnormalities (Vandervore et al., 2019). ZDHHC5, is broadly expressed in the brain, including the frontal cortex. ZDHHC5 has not been implicated in brain development but has been linked to Lung Acinar Adenocarcinoma and Lung Papillary Adenocarcinoma in prior studies (Zhang et al., 2021).
We identified a total of 25 credible causal genes based on robust evidence using multiple positional and functionally-informed gene-based approaches (see Figure 2A). Notably, DLGAP1, which has been previously suggested to be implicated in OCD pathogenesis (Mattheisen et al., 2015, IOCDF & OCGAS et al., 2018), was not identified in either the GWAS or in the gene-based analyses. Of the 25 genes that were implicated, 15 were within 6.5 kb of a SNP that surpassed genome-wide significance in the meta-analysis. In addition to the four genes located on chr11q12.1 near the top SNP in the meta-analysis, several others identified in the gene-based analyses are of particular interest. These genes include WDR6 and DALRD3, which had the strongest evidence from the gene-based analyses. These genes lie in a gene-rich region on chr3p21.31, which in addition to harboring multiple genome-wide significant SNPs in our analysis, has been previously associated with a broad range of psychiatric disorders and related traits, including SCZ (Pardiñas et al., 2018), well-being (Watanabe et al., 2019), and the worry-subcluster of neuroticism (Nagel et al., 2018).
The gene WDR6 (WD repeat domain 6) is broadly expressed in the brain, particularly the hypothalamus. Its protein product is involved in cell growth arrest (Xie et al., 2007), and recent studies have implicated the gene in anorexia nervosa and Parkinson’s disease (Adams et al., 2023; Kia et al., 2021). DALRD3 (DALR Anticodon Binding Domain Containing 3) is located on chromosome 3 in the same region as WDR6. DALRD3, when fully disrupted, has been implicated in a form of epileptic encephalopathy with associated developmental delay (Lentini et al., 2020). In addition, a third gene in the 3p21 locus, CELSR3 (Cadherin EGF LAG seven-pass G-type receptor 3), encodes a protocadherin that is highly expressed in the developing basal ganglia (Wu et al., 2022). Multiple loss-of-function mutations in CELSR3 have been associated with Tourette syndrome, which co-occurs with OCD in 10-20% of patients (Willsey et al., 2017; Zhao et al., 2020).
Four other genes identified through these analyses are located in the MHC locus, a region on chromosome 6 that plays a major role in the adaptive immune system and has been repeatedly linked to major psychiatric disorders based on convergent evidence from genome-wide association, transcriptomic, and imaging genetics studies (Debnath et al., 2018). The newly identified MHC association for OCD is notable as both genetic and epidemiological studies show a relationship between autoimmune disorders and OCD (Mataix-Cols et al., 2018; Tylee et al., 2018, Westwell-Roper et al., 2019). These studies suggest that individuals with variants in these genes may carry both a propensity to infections and/or autoimmune disorders and liability to OCD, perhaps via genetic pleiotropy (Zhang et al., 2022). Further, specific types of OCD have may themselves have an autoimmune origin (pediatric acute-onset neuropsychiatric disorders associated with streptococcus (PANDAS), and Pediatric acute-onset neuropsychiatric syndrome (PANS); Swedo et al., 1998; Wilbur et al., 2019). Nevertheless, we were surprised to discover several negative genetic correlations between OCD and some autoimmune disorders such as Crohn’s disease, ulcerative colitis, and inflammatory bowel disease in our analyses, suggesting that there is heterogeneity (and perhaps pleiotropy) in the genetic relationships between autoimmune disorders and OCD.
Tissue and cell type enrichment analysis revealed significant enrichment of OCD SNP-heritability in several tissues and cell types, with the strongest enrichment in excitatory neurons of hippocampus and cerebral cortex, and in Dopamine D1 Receptor (D1R)-positive and Dopamine D2 Receptor (D2R)-positive medium spiny neurons (MSNs) in the striatum. MSNs represent the major cell types in the striatum, in which D2R-positive MSNs promote movement and motivation, while D1R-positive MSNs decrease movement and drive (Fieblinger et al., 2021). In addition, Dopamine D2 Receptor antagonists, e.g., haloperidol and risperidone, have been demonstrated to be effective augmenting medications in treatment-refractory OCD (Komossa et al., 2010). These findings are consistent with and build on previous work linking various neuronal cell types to psychiatric and cognitive phenotypes, in particular, SCZ, BD, educational attainment, and cognitive performance (Olislagers et al.; 2022).
The functional and positional gene-based analyses, and in particular the tissue and cell type enrichment findings, align with what is known about the neural circuitry and circuit level dysfunction in OCD that has been identified through neuroimaging and deep brain stimulation studies. For example, frontal cortex and anterior cingulate cortex, which were enriched in our tissue-based analyses, as well as hippocampus and striatum, which were implicated in our cell-based analyses, are among the regions that have been consistently implicated in neuroimaging studies of OCD (Boedhoe et al., 2018; Bruin et al., 2020; van den Heuvel et al., 2016, 2022). Enrichment in medium spiny neurons (MSNs) in striatum is consistent with their role in the observed aberrant circuitry in OCD, where the medium spiny neurons D1 project to the globus pallidus interna and substantia nigra in the direct pathway, and the D2-type MSNs project to the globus pallidus externa in the indirect pathway (Haber, 2016).
Our analyses of the shared genetic risk between OCD and other psychiatric disorders provides further insights into the etiology of OCD. In line with previous observations (Derks et al., 2022; Romero et al., 2022), we found significant genetic correlations between OCD and various psychiatric disorders and traits. The strongest genetic correlations were observed for anxiety disorders, depression, and anorexia nervosa, all of which are highly comorbid with OCD (Sharma et al., 2021). This aligns with previous findings from cross-disorder analyses suggesting a shared genetic susceptibility among most psychiatric disorders (Derks et al., 2022; Lee et al., 2019; Grotzinger et al. 2019). Future studies can investigate to what extent genetic overlap is explained by true genetic pleiotropy vs. alternative mechanisms such as shared diagnostic criteria or mediation through unmeasured traits (Martin et al., 2017). A notable exception is our finding that risk variants for OCD are protective for alcohol dependence (Walters et al., 2018), which is at odds with epidemiological evidence strongly linking OCD and alcohol related disorders (Virtanen et al. 2022). Though not all epidemiological evidence is consistent; a large review paper (Sharma et al., 2021) reported a lower than expected lifetime comorbidity of substance use disorders in OCD (7.2% in adults), compared to the general population (10.7%) The observed pattern of correlations with other phenotypes can be thought of as falling into two categories: compulsivity/impulsivity and rumination/worry/neuroticism. In both categories, the patterns of genetic correlations appear to follow a gradient across disorders/traits. For example, in the compulsivity/impulsivity category, strong positive correlations are seen with AN and TS, which are disorders with strong compulsive features, with less positive associations seen with ADHD, and negative correlations with alcohol dependence and risk-taking behaviors, which are all phenotypes characterized by impulsivity. A similar gradient is observed for the rumination/worry/neuroticism related phenotypes, with strong positive correlations with ANX, as well as ruminative phenotypes such as worry, transitioning to less strong correlations with individual depression related items. Neurological disorders also showed only weak evidence for a shared genetic etiology with OCD, and in fact, the evidence suggests that most neurological disorders, are genetically distinct from psychiatric disorders (Anttila et al., 2018).
This study, when considered in the context of previously published OCD GWAS (Stewart et al., 2013, Mattheisen et al., 2015, IOCDF & OCGAS et al., 2018), as well as interim analyses of subsets (Strom et al., 2021, Strom et al., 2024) of the here presented GWAS meta-analysis, may also aid in projecting the yield in OCD risk gene discovery. The previously published OCD GWAS meta-analysis (IOCDF & OCGAS et al., 2018) reported no significant associations with a case size of ∼2,700; more recent interim analyses posted on pre-print servers identified one significant association with a case size of ∼14,700, and 15 significant associations with a case size of ∼37,000. This indicates a transition from the flat (sample building) phase of SNP discovery described for GWAS (Sullivan et al., 2018; Supplementary Figure S19), where few to no genome-wide significant loci are identified, to the linear phase of SNP discovery, where even relatively small increases in sample size are expected to identify additional genome-wide significant loci. All of the 15 previously identified OCD-associated genetic loci (Strom et al., 2024) had the same direction of effect in the current meta-analysis; 13 were also significant in this study, while the other two were in the suggestive range (P = 5.23x10-08 and P = 2.2x10-07).
The strengths of the current study include the marked increase in the number of OCD cases compared to the previously published OCD GWAS studies and the rigorous analytic methods, including two multivariate approaches (MTAG and GenomicSEM) to control for potential overlapping subjects in datasets and to examine potential heterogeneity between the multiple ascertainment approaches. Potential weaknesses include the inability to document comorbid psychiatric disorders in the majority of cases that were not ascertained from clinical collections or electronic registries, the lack of inclusion of other ancestries other than European, and the limited analysis of sex-chromosome data in only a subset of the data.
In summary, this work substantially advances the field of OCD genetics by identifying new OCD genetic risk loci and multiple credible candidate causal genes, including those expressed in brain regions and cell types that have been previously implicated in OCD (Piantadosi et al., 2021). We have also shown that OCD is highly polygenic in nature, with many variants implicated not only in OCD but also in commonly comorbid disorders or traits, in particular anxiety, neuroticism, anorexia nervosa, and depression. As we have shown, common variants explain 6.7% of the phenotypic variation in OCD. This modest contribution suggests that, in addition to possible phenotypic heterogeneity contributing to a reduction in the observed SNP heritability, other types of genetic variation may also contribute to the etiology of OCD. Notably, recent whole-exome sequencing studies have suggested that a substantial proportion of OCD cases (22%) may be influenced by rare de novo coding variants (Cappi et al., 2020), especially in genes that are intolerant to loss of function (Halvorsen et al., 2021). Also rare, potentially damaging copy number variations represent part of the risk architecture for OCD (Mahjani et al., 2022b). These findings emphasize the need for a comprehensive exploration of the contribution of both common and rare genetic factors, as well as their interplay, to the risk of OCD. Finally, with the implication of the MHC complex, we provide additional evidence for potential shared genetic influences underlying both OCD and increased liability to autoimmune processes, although the directionality of those relationships remains to be definitively elucidated. In the future, increasing sample sizes further, will facilitate the discovery of additional OCD risk variants. In addition, future studies will need to collect more ancestrally diverse samples, include sex-specific analyses, and conduct additional clinical phenotyping to allow for elucidation of genetic and clinical relationships between OCD and co-occurring disorders. Finally, with the emergence of drug databanks describing the relations between drugs and molecular phenotypes (Knox et al., 2024), our results can be used for drug repurposing (i,e, identifying existing drugs targeting OCD risk genes) leading to new opportunities to find more effective treatment.
Online Methods
Subjects
Supplementary Table S1 provides an overview of the individual cohorts We analyzed genomic data from 28 OCD case-control cohorts including 53,660 OCD cases and 2,044,417 controls of European ancestry. GWAS results based on some of these cases and controls have been published previously by the International OCD Foundation (IOCDF-GC; Stewart et al., 2013, IOCDF & OCGAS et al., 2018) and the OCD Collaborative Genetics Association Study (OCGAS; Mattheisen et al., 2015, IOCDF & OCGAS et al., 2018). These data were re-analyzed for the current publication using newly matched control participants that were genotyped with the same microarrays as the cases, making up 2,828 cases and 4,887 controls. GWAS results based on a subset of the cohorts are currently available as preprints (Ncases = 14,140, Ncontrols = 562,117, Strom et al., 2021 and Ncases = 37,015, Ncontrols = 948,616, Strom et al., 2024). Of those cohorts, three (EstBB, FinnGen, iPSYCH) were updated to include additional OCD cases and controls compared to the samples in the preprints. Seven cohorts are new to this study and were not included in any of the previously published GWAS (Ncases = 6,120, Ncontrols = 430,999). Among all included individuals, 323 cases were part of a parent proband trio; in these cases, parents were used as pseudo controls. A total of 20,427 cases met DSM-5 (DSM-5, 2013) or ICD-10 (World Health Organization, 2019) criteria for OCD as assessed by a healthcare professional or derived from (electronic) health records, while the remaining 32,233 cases were based on self-reported OCD diagnoses (23andMe, AGDS, and parts of UKBB). Cohort-specific sample and analytic details can be found in the Supplementary Note 1. Data collections were approved by the relevant institutional review boards at all participating sites, and all participants provided written informed consent.
Individual GWAS analyses and harmonizing of results
First, the data of each participating cohort were analyzed individually (see Supplementary Note 1 for details). Genetic data were imputed using either the Haplotype Reference Consortium (HRC; McCarthy et al., 2016) or 1000 Genomes Project Phase 3 reference panels (The 1000 Genomes Project Consortium, 2015). The resulting GWAS summary statistics were then harmonized before a conjoint meta-analysis of all autosomes was conducted. Each summary statistic data set was transformed to ‘daner’ file format following RICOPILI (Lam et al., 2020) specifications. Next, each dataset was cleaned of variants that were likely to have poor underlying genotype data. All variants had to meet the following criteria for inclusion: minor allele frequency (MAF) > 1% in cases and controls, imputation quality (INFO) score > 0.8 and < 1.2. If the effect measure, p-value or standard error (SE) was missing or was out of bounds (infinite), the SNP was removed. Once cleaned summary statistics were produced, all datasets were aligned to the HRC reference panel. If variants were reported on different strands, they were flipped to the orientation in the HRC-reference. Furthermore, strand-ambiguous A/T and C/G SNPs were removed if their MAF was > 0.4. In the event that A/T and C/G SNPs showed a MAF < 0.4, allele frequencies were compared to frequencies in the HRC-reference. If an allele frequency match was found, i.e minor alleles were the same in the summary statistics and the HRC reference, the same strand orientation was assumed. If an allele mismatch was found, i.e., the allele had a frequency > 0.5 in HRC, it was assumed that alleles were reported on different strands and alleles were flipped subsequently. Marker-names were uniformly switched to those present in the HRC reference. If a variant did not overlap with the variants in the HRC reference, it was removed.
GWAS meta-analysis
Inverse variance weighted meta-analysis was conducted on 28 European cohorts using METAL (Willer et al., 2010). Heterogeneity was assessed with Cochran’s Q statistic and I2 statistic (Higgins et al., 2002; 2003). Cochran’s Q is calculated as the weighted sum of squared differences between individual study effects and the pooled effect across studies, with the weights being those used in the pooling method. Q is distributed as a chi-square statistic with k (number of studies) minus 1 degrees of freedom. The I2 statistic describes the percentage of variation across studies that is due to heterogeneity rather than chance. Unlike Q, it does not inherently depend upon the number of studies considered. The genomic control factor Lambda (λ) was calculated for each individual GWAS and for the overall meta-analysis to identify residual population stratification or systematic technical artifact. GWAS summary statistics were subjected to linkage disequilibrium (LD) score regression (LDSC) analyses on high-quality common SNPs (INFO score > 0.9) to examine the LDSC intercept to distinguish polygenicity from other types of inflation, and to estimate the genetic heritability from the meta-analysis and genetic correlations between cohorts. The genomic inflation factor Lambda (λ) was estimated at 1.330 with an λ1000 of 1.033, while the LDSC intercept was 1.0155, (SE = 0.0085), indicating that the inflation was mostly due to polygenic signal and unlikely to be significantly confounded by population structure. The genome-wide significance threshold for the GWAS was set at a p-value of 5.0x10⁻⁸. The 23andMe data included information on the X-chromosome; as this information was not present for all other cohorts, analysis of the X-chromosome was only conducted in this sub-cohort (see Supplementary Note 3 for details).
We further conducted GWAS meta-analyses on four subgroups, defined by differences in their sample ascertainment: either a) clinical-OCD cases diagnosed by a health care professional in a clinical setting (NCases = 9089, NControls = 21,077; including IOCDF, IOCDF_trio, EPOC, NORDiC-nor, NORDiC-swe, EGOS, OCGAS, OCGAS-ab, OCGAS-gh, OCGAS-nes, Psych_Broad, WWF, MVP, Michigan/Toronto IGS, YalePenn, Chop, CoGa), b) comorbid-individuals that were primarily ascertained for another comorbid psychiatric disorder (NCases = 5266, NControls = 43,760; AGDS, IPSYCH), c) biobank-data from large-scale biobanks or registries with ICD or DSM codes (NCases = 9138, NControls = 1,049,776; BioVU, EstBB, FinnGen, HUNT, MoBa, UKBB) or d) 23andMe data (NCases = 30,167, NControls = 929,804). While these groups are not exclusive (e.g., diagnoses in health records were originally given in a clinical setting, or comorbid cases were also assessed in a clinical setting or derived from health records), we defined these groups by the cohorts primary characteristic. We also conducted one meta-analysis including all clinical, comorbid, and biobank subgroups, while excluding the 23andMe data, resulting in 23,493 cases and 1,114,613 controls. As 23andMe is the only consumer-based dataset, we intended to compare this dataset to all others.
SNP-based fine-mapping - GCTA-COJO
We performed a conditional-and-joint analysis (GCTA-COJO) (Yang et al., 2011) to identify independent signals within significant OCD loci. This approach performs a conditional and joint analysis on the basis of conditional p-values before calculating the joint effects of all selected SNPs. We used the stepwise model selection procedure to select independently associated SNPs. The linkage disequilibrium reference sample was created from 73,005 individuals from the QIMR Berghofer Medical Research Institute genetic epidemiology cohort. The distance assumed for complete linkage disequilibrium was 10Mb, and we used the default p-value threshold of 5x10-08 to define a genome-wide significant hit.
Multi-trait analysis of ascertainment subgroups
We used multi-trait analysis of GWAS (MTAG; Turley et al., 2018) to conduct multivariable GWAS analyses for the OCD samples, reporting GWAS results for each of the ascertainment-specific sub-groups. Through this approach we aimed to address potential concerns about heterogeneity in genetic liability for individual sub-groups following different ascertainment strategies. MTAG is a multi-trait analysis that is usually used to combine different but related traits into one meta-analysis by leveraging the shared heritability among the different traits and thereby gaining power. In this case, our aim was to generate ascertainment-specific estimates, while boosting power by leveraging the high shared heritability between the subgroups. The MTAG analysis resulted in four different GWAS summary statistics, one for each subgroup (clinical, comorbid, biobanks, 23andMe). We performed maxFDR analyses to approximate the upper bound on the FDR of MTAG results.
GenomicSEM
Similarly, we used genomic structural equation modeling (GenomicSEM, Grotzinger et al., 2019) to model the joint genetic architecture of the four subgroups. First, we ran a common-factor model without individual SNP effects, following the tutorial ‘Models without individual SNP effects’ on the GenomicSEM github website (see web resources). In brief, the summary statistics were first harmonized and filtered (with the munge-function), using HapMap3 as the reference file, using the effective sample size (clinical: Neff = 21.562, comorbid: Neff = 18.794, biobanks: Neff = 36.124, 23andMe: Neff = 116.876) as the input sample size, and filtering SNPs to INFO > 0.9 and MAF > 0.01. In a second step, multivariable LDSC was run to obtain the genetic covariance matrix and corresponding sampling covariance matrix, using precomputed European-ancestry LD scores, a sample prevalence of 0.5 and a population prevalence of 0.02. In a third step we ran a confirmatory factor analysis (CFA) using the pre-packaged comm-on factor model in GenomicSEM using diagonally weighted least squares (DWLS) estimation. We ran a multivariate GWAS to generate QSNP -values for the 30 significant SNPs, which indicate possible heterogeneous effects across the subgroups. The QSNP statistic is mathematically similar to the Q-statistic from standard meta-analysis and is a X2-distributed test statistic with larger values indexing a violation of the null hypothesis that the SNP acts entirely through the common factor. In multivariate GWAS, the common factor defined by genetic indicators is regressed on each SNP, thereby generating summary statistics for the common factor (details can be found in the tutorial “GenomicSEM for Common Factor GWAS”, see web resources). First, summary statistics for all four subgroups were prepared for multivariate GWAS with the ‘sumstats’ function in GenomicSEM, which aligns and merges all files. Next, with the ‘commonfactorGWAS’ function, the S (genetic covariance) and V (corresponding sampling covariance) matrices from the LDSC output (from the model without SNP effects) and the summary statistics were combined to create a separate S and V matrix for each SNP containing the effect estimate. The function also transforms the effect estimates from the summary statistics and their SEs into covariances and SEs of covariances by taking the product of the regression coefficient and SNP variance from the reference file (1000 genomes phase 3)
SNP heritability estimation
The proportion of the phenotypic variance that could be explained by the aggregated effect of all included SNPs (SNP-based heritability,  ) was estimated using LDSC (Bulik-Sullivan et al., 2015). The analysis was performed using pre-computed LDscores from samples restricted to European-ancestry in the 1000 Genomes Project (The 1000 Genomes Project Consortium, 2015), filtered for SNPs included in the HapMap3 reference panel (Altshuler et al., 2010). SNP heritability was estimated based on the slope of the LDSC, with heritability on the liability scale calculated assuming a 1% population prevalence of OCD (Fawcett, 2020). To omit a downward bias in our estimates of liability scale heritability, following Grotzinger et al. (2023), we accounted for varying levels of ascertainment across cohorts in our meta-analysis by summing the effective sample sizes across the contributing cohorts and using that as the input sample size for LDSC. For the conversion to the liability scale, the sample prevalence was then specified as 0.5. The SNP-heritability was calculated for the whole OCD sample as well as for ascertainment-specific sub-groups.
Genetic correlations
We used cross-trait LDSC, a method that computes genetic correlations between GWASs without bias from ancestry differences or sample overlap to calculate genetic correlations between the primary OCD meta-analysis and other phenotypes of interest (Bulik-Sullivan et al., 2015). The selection of traits was based on phenotypic relevance and/or prior report of a genetic relationship with OCD. The genetic correlation between traits is based on the estimated slope from the regression of the product of Z-scores from two GWASs on the LD score and represents the genetic covariation between two traits based on all polygenic effects captured by the included SNPs. The genome-wide LD information used by these methods was based on European populations from the HapMap 3 reference panel (Altshuler et al., 2010), and GWAS summary statistics were filtered to only include SNPs that were part of the 1,290,028 HapMap 3 SNPs.
To ensure the internal consistency of the datasets included in our meta-analysis, we calculated genetic correlations between all cohorts we considered to have a sample size large enough for LDSC (effective sample size of ≥ 1000) and between the four ascertainment-specific subgroups.
We further calculated genetic correlations between OCD and 112 other disorders and traits. The source studies of the GWAS summary statistics can be found in Supplementary Table S17. As a follow-up, we also calculated genetic correlations between the 112 phenotypes and each ascertainment-specific sub-cohort and compared the genetic correlation patterns between the four groups.
Gene-based analyses
To match the significant SNPs to the genes whose function they likely influence, we conducted a series of positional and functional gene mapping analyses. The positional mapping employed MBAT-combo (Li et al., 2022), while the functional mapping tested whether genetic variants associated with OCD were also associated with differential expression of nearby genes (within 1 Mb window) using a) Transcriptome-wide Association Study (TWAS) (Gusev et al., 2016) utilizing PsychENCODE data and included colocalization with COLOC (Giambartolomei et al., 2014; Wallace, 2020) and b) summary-based Mendelian Randomization (SMR; Zhu et al., 2016) Zhu et al., 2016) using whole-blood eQTL information and brain tissues from MetaBrain, alongside the HEIDI test which tests for heterogeneity in GWAS signal and eQTL association. Further, a protein-wide association study (PWAS) was conducted. As a final step, genes within each locus were prioritized using PsyOPS (Wainberg et al., 2022), which integrates both positional and functional information. The details of each method are described below.
Positional gene mapping (MBAT-combo)
A gene-based analysis was conducted using multivariate Set-Based Association Test (mBAT-combo) (Li et al., 2022) within GCTA version 1.94.1 (Yang et al., 2011). mBAT-combo has the advantage of being better powered than other gene-based association test methods to detect multi-SNP associations in the context of masking effects (i.e., when the product of the true SNP effect sizes and the LD correlation is negative). To ensure that the overall power is maximized independent of masking effects at specific loci, mBAT-combo combines mBAT and fastBAT test statistics through a Cauchy combination method, which allows the combination of different test statistics without a priori knowledge of the correlation structure. The European subsample (N = 503 individuals) from Phase 3 of the 1000 Genomes Project (The 1000 Genomes Project Consortium, 2015) was used as the linkage disequilibrium (LD) reference panel with the fastBAT default LD cut-off of 0.9 applied. After filtering SNPs with MAF > 0.01, there were 6,629,124 SNPs for analysis in our sample. A gene list consisting of 19,899 protein coding genes was used to map the base pair position of genes using genome build hg19.
Functional gene mapping
Transcriptome-Wide Association Study (TWAS)
We used TWAS FUSION (Gusev et al., 2016) to perform a transcriptome-wide association study of OCD. We used brain gene expression weights from the PsychENCODE (D. Wang et al., 2018) and LD information from the 1000 Genomes Project Phase 3 (The 1000 Genomes Project Consortium, 2015). TWAS FUSION uses reference LD and reference gene expression panels with GWAS summary statistics to estimate the association between gene expression and OCD risk. These data were processed with the test statistics from the OCD GWAS to estimate the expression-GWAS association statistic. We corrected for multiple testing using Bonferroni correction.
We performed colocalization analyses using the COLOC R function (Giambartolomei et al., 2014; Wallace, 2020) implemented in TWAS FUSION. Colocalisaton is a Bayesian method used to calculate the posterior probabilities (PP) that individual lead SNPs within a significant TWAS locus are 1) independent (e.g., 2 causal SNPs in LD, one affecting transcription, and one affecting OCD; posterior probability [PP3]) or 2) share the same associated variant (e.g., a single causal SNP affects both transcription and OCD [PP4]). We also performed a conditional analysis to determine whether identified associations represented independent associations. This was performed using the FUSION software, which jointly estimates the effect of all significant features within each locus by using residual SNP associations with OCD after accounting for the predicted expression of other features.
Summary-Based Mendelian Randomisation (SMR)
SMR (Zhu et al., 2016) was performed using default settings and eQTL meta-analysis summary statistics from European populations for whole blood from eQTLGen (Võsa et al., 2021), and all five nervous system tissues from MetaBrain (Basal ganglia, Cerebellum, Cortex, Hippocampus and Spinal Cord) (Klein et al., 2021). The HEIDI (heterogeneity in dependent instruments) test is performed alongside SMR to test for effect size heterogeneity between the GWAS and eQTL summary statistics.
Psychiatric Omnilocus Prioritization Score
We used the gene prioritization method PsyOPS (Psychiatric Omnilocus Prioritization Score) (Wainberg et al., 2022) to rank genes within genome-wide significant loci. This supervised approach integrates biological annotations on mutational intolerance, brain-specific expression, and involvement in neurodevelopmental disorder for genes within significant loci. Genes with the top PsyOPS score within each locus were used for further gene prioritization (see “Gene prioritization” below). In the instance where two genes in the same locus had the same PsyOPS score, the gene nearest the index SNP was prioritized.
Protein-wide association study
We performed a protein-wide association study (PWAS) using protein expression data from human brain samples. Human brain proteome reference weight data were obtained using the Religious Orders Study and Rush Memory and Aging Project (ROS/MAP) and Banner Sun Health Research Institute (Banner) study. The ROS/MAP proteomes were generated from the dorsolateral prefrontal cortex (DLPFC) of 376 participants of European ancestry and included 1,476 proteins with significant SNP-based heritability (p-value < 0.01). The Banner PWAS weights were generated from 152 individuals of European ancestry and included 1,147 proteins with significant SNP-based heritability. The PWAS was performed using the TWAS FUSION software (Gusev et al., 2016) with LD reference information from the 1000 Genomes Project Phase 3 (The 1000 Genomes Project Consortium, 2015). We corrected for multiple testing using Bonferroni correction.
Gene prioritization
We created a list of prioritized genes using both gene-based tests and colocalization/HEIDI filters. Results from each gene-based test were first restricted to protein coding genes with unique gene identifiers based on the release from GENCODE (v40) for hg19. The following criteria were then used to prioritize genes: (i) a significant (Bonferroni corrected) association from at least two gene-based tests (mBAT-combo, TWAS FUSION, SMR, or PsyOPS), and (ii) evidence of colocalization (COLOC PP4 > 0.8) and/or significant SMR association with HEIDI P >0.05. Joint/conditional tests of association and significant PWAS associations were used as ancillary approaches to further annotate the prioritized gene list.
Tissue and cell-type enrichment analysis
An analysis of tissue and cell-type enrichment of OCD GWAS association signals was conducted using MAGMA (v1.08) (de Leeuw et al., 2015) and partitioned LD score regression (Finucane et al., 2015). Bryois et al.’s approach (Bryois et al., 2020) was employed to determine gene expression specificity in bulk tissue RNA-seq data from 37 tissues in GTEx (v8) and single-cell RNA sequencing data from 19 regions in the mouse central and peripheral nervous systems (Zeisel et al., 2018). The analysis was limited to protein-coding genes with 1:1 orthologs between mice and humans. Gene expression in each tissue or cell type was calculated relative to total expression across all tissues or cell types. Enrichment analysis was performed on genes with the top 10% specificity values in each tissue or cell type, as previously defined (Bryois et al., 2020).
To evaluate the enrichment of tissue and cell type specific genes in OCD genetic association signals, we applied MAGMA and partitioned LDSC. We restricted the analysis to summary statistics for SNPs with a high INFO score (> 0.6) and frequency in the entire cohort (MAF > 0.01). Using MAGMA (v1.08), we tested if genes with the top 10% specificity in a tissue or cell type showed enrichment in gene-level genetic associations for OCD, with the 1000 genomes phase 3 European sample genotypes serving as the LD reference panel. We used standard gene boundaries (35kb upstream of the transcription start site to 10kb downstream of the transcription stop site). Partitioned LDSC was used to examine whether SNPs within 100kb regions of the top 10% specifically expressed genes were enriched for SNP-based heritability for OCD. All results were corrected for multiple testing with an FDR threshold of 0.05.
Identification of previously reported associations for significant SNPs
Multiple resources were used to identify previously reported associations of our 30 significant SNPs with other phenotypes: We used the IEU open gwas project (Elsworth et al., 2020), PheWAS analysis of gwasATLAS (Watanabe et al., 2019), the NHGRI-EBI GWAS Catalog (Buniello et al., 2019), and identified credible SNPs through causaldb (J. Wang et al., 2020). Causaldb estimates causal probabilities of all genetic variants in GWAS significant loci using three state-of-the-art fine-mapping tools including PAINTOR, CAVIARBF and FINEMAP (Benner et al., 2016; Chen et al., 2015; Kichaev et al., 2014; Kichaev & Pasaniuc, 2015). We used default settings for our causaldb queries.
Conflicts of Interest
Chris German is employed by and hold stock or stock options in 23andMe, Inc. Erika L. Nurmi is on the Scientific Advisory Board for Myriad Genetics and Medical Advisory Board for Tourette Association of America and received Clinical trial funding from Emalex and Octapharma Pharmaceuticals. Jeremy Veenstra-VanderWeele has served on advisory boards or consulted with Roche, Novartis, and SynapDx; received research funding from Roche, Novartis, SynapDx, Seaside Therapeutics, Forest, Janssen, Acadia, Yamo, and MapLight; received stipends for editorial work from Wiley and Springer. Jens R. Wendland is a current employee and shareholder of Takeda Pharmaceuticals and a past employee and shareholder of F. Hoffmann-La Roche, Pfizer and Nestle Health Science. Cynthia M. Bulik reports: Pearson (author, royalty recipient).Peter Falkai reports no conflict of interest regarding this study and reports to have received financial support and Advisory Board: Richter, Recordati, Boehringer-Ingelheim, Otsuka, Janssen and Lundbeck. Hans J. Grabe has received travel grants and speakers honoraria from Fresenius Medical Care, Neuraxpharm, Servier and Janssen Cilag as well as research funding from Fresenius Medical Care. Ian B. Hickie is the Co-Director, Health and Policy at the Brain and Mind Centre (BMC) University of Sydney, Australia. The BMC operates an early-intervention youth services at Camperdown under contract to headspace. Professor Hickie has previously led community-based and pharmaceutical industry-supported (Wyeth, Eli Lily, Servier, Pfizer, AstraZeneca, Janssen Cilag) projects focused on the identification and better management of anxiety and depression. He is the Chief Scientific Advisor to, and a 3.2% equity shareholder in, InnoWell Pty Ltd which aims to transform mental health services through the use of innovative technologies. Benjamin M. Neale is a member of the scientific advisory board at Deep Genomics and Neumora. Christopher Pittenger consults and/or receives research support from Biohaven Pharmaceuticals, Freedom Biosciences, Ceruvia Lifesciences, Transcend Therapeutics, UCB BioPharma, and F-Prime Capital Partners. He owns equity in Alco Therapeutics. These relationships are not related to the current work. Dan J. Stein has received consultancy honoraria from Discovery Vitality, Johnson & Johnson, Kanna, L’Oreal, Lundbeck, Orion, Sanofi, Servier, Takeda and Vistagen. Eric A. Storch reports receiving research funding to his institution from the Ream Foundation, International OCD Foundation, and NIH. He was formerly a consultant for Brainsway and Biohaven Pharmaceuticals in the past 12 months. He owns stock less than $5000 in NView/Proem for distribution related to the YBOCS scales. He receives book royalties from Elsevier, Wiley, Oxford, American Psychological Association, Guildford, Springer, Routledge, and Jessica Kingsley. Ole A. Andreasson reports to be a consultant to Cortechs.ai, Precision Health AS, speakers honorarium from Otsuka, Lundbeck, Sunovion, Janssen.
Anders D. Børglum has received speaker fee from Lundbeck. David Mataix-Cols receives royalties for contributing articles to UpToDate, Wolters Kluwer Health, and personal fees for editorial work from Elsevier, all unrelated to the current work. Murray B. Stein has in the past 3 years received consulting income from Acadia Pharmaceuticals, BigHealth, Biogen, Bionomics, Boehringer Ingelheim, Clexio, Eisai, EmpowerPharm, Engrail Therapeutics, Janssen, Jazz Pharmaceuticals, NeuroTrauma Sciences, Otsuka, PureTech Health, Sage Therapeutics, Sumitomo Pharma, and Roche/Genentech. Dr. Stein has stock options in Oxeia Biopharmaceuticals and EpiVario. He has been paid for his editorial work on Depression and Anxiety (Editor-in-Chief), Biological Psychiatry (Deputy Editor), and UpToDate (Co-Editor-in-Chief for Psychiatry). Joel Gelernter is paid for editorial work by the journal Complex Psychiatry. Pino Alonso has received funding from Biohaven, Boston Scientific, Medtronic. All other authors report no conflicts of interest.
Funding
EGOS was supported by a grant from the Beatrice and Samuel A. Seaver Foundation to DEG. The genotyping of HUNT was financed by the National Institute of health (NIH), University of Michigan, The Norwegian Research council, and Central Norway Regional Health Authority and the Faculty of Medicine and Health Sciences, Norwegian University of Science and Technology (NTNU). This research is based in part on data from the Million Veteran Program, Office of Research and Development, Veterans Health Administration, and was supported by awards CSP575b, I01CX001849-01, 1P1HX002375, and the National Center for PTSD Research. MVP was supported by funding from the Department of Veterans Affairs Office of Research and Development, USVA, grants CSP575B and I01CX001849, MVP-025, and the VA Cooperative Studies Program study, no. 575B; the VA National Center for PTSD Research, and the West Haven VA Mental Illness Research, Education and Clinical Center; and by NIH grant R01 AA026364 (JG). D.F.L. is supported by a Career Development Award CDA-2 from the Veterans Affairs Office of Research and Development (1IK2BX005058-01A2) and is Aimee Mann Fellow of Psychiatric Genetics. This publication does not represent the views of the Department of Veteran Affairs or the United States Government. The EPOC study was funded by the Deutsche Forschungsgemeinschaft (DFG; KA815/6-1 and WA731/10-1). LifeGene was supported by the Swedish Research Council, the Karolinska Institutet/Stockholm County Council research grants, AFA Insurance and the Torsten and Ragnar Söderbergs Foundation. Thomas V Fernandez: Research reported in this publication was supported by the National Institute Of Mental Health of the National Institutes of Health under Award Number R01MH114927. The content is solely the responsibility of the authors and does not necessarily represent the official views of the National Institutes of Health. This work (GENOS) was supported by the German Research Fundation (GR 1912/1-1). The OCD Collaborative Genetics Association Study (OCGAS) is a collaborative research study and was funded by the following NIMH Grant Numbers: MH071507, MH079489, MH079487, MH079488 and MH079494. This work (OCGAS and IOCDF) is supported by the Netherlands Organization for Scientific Research-Gravitation project ‘BRAINSCAPES: a Roadmap from Neurogenetics to Neurobiology’ (024.004.012) and the European Research Council advanced grant ‘From GWAS to Function’ (ERC-2018-ADG 834057). The OCGAS and IOCDF samples are supported through NIMH Grant Numbers: MH071507 (G N), MH079489 (DAG), MH079487 (JM), MH079488 (AF), and MH079494 (JK). The iPSYCH team was supported by grants from the Lundbeck Foundation (R102-A9118, R155-2014-1724, and R248-2017-2003), NIH/NIMH (1R01MH124851-01 to A.D.B.) and the Universities and University Hospitals of Aarhus and Copenhagen. The Danish National Biobank resource was supported by the Novo Nordisk Foundation. High-performance computer capacity for handling and statistical analysis of iPSYCH data on the GenomeDK HPC facility was provided by the Center for Genomics and Personalized Medicine and the Centre for Integrative Sequencing, iSEQ, Aarhus University, Denmark (grant to A.D.B.). A.D.B. was also supported by the EU’s HORIZON-HLTH-2021-STAYHLTH-01programme, project number 101057385: Risk and Resilience in Developmental Diversity and Mental Health (R2D2-MH). NORDiC was supported by the Swedish Research Council (grants 2012-07111 and 2018-02487), Swedish Research Council for Health, Working Life and Welfare 2018-00221 and Center for Innovative Medicine – CIMED. Nicholas G Martin has received funding from a project grant from Australian NHMRC. The AGDS was primarily funded by National Health and Medical Research Council (NHMRC) of Australia grant 1086683. This work was further supported by NHMRC grants 1145645, 1078901 and 1087889. LCC is supported by a QIMR Berghofer Institute fellowship. NORDiC is funded by NIMH R01 MH110427 (PI Crowley), NIMH R01 MH105500 (PI Crowley) and the Swedish Research Council grant # 2015–02271 (PI Mataix-Cols). The work done by the EstBB team has received funding from the European Union’s Horizon 2020 Research and Innovation Programme under Grant agreement 847776 (CoMorMent). This work (Mental-Cat and INSchool) was supported by the Agència de Gestió d’Ajuts Universitaris i de Recerca (AGAUR, 2017SGR-1461, 2021SGR-00840), the Instituto de Salud Carlos III (PI20/00041, PI23/00404 and PI23/00026), the European Regional Development Fund (ERDF); the ECNP Network ‘ADHD across the Lifespan’; “la Marató de TV3” (202228-30 and 202228-31). The Research Council of Norway supported H. Ask, A. Havdahl and T. Reichborn-Kjennerud (274611). A. Havdahl was also supported by South East Norway Health Authority (2020022). Grant support for the MoBa team was also provided from RCN (273291, 262656, 248778, 223273) and the KG Jebsen Stiftelsen.). BioVU: CTSA (SD, Vanderbilt Resources) was supported by the National Center for Research Resources, Grant UL1 RR024975-01, and is now at the National Center for Advancing Translational Sciences, Grant 2 UL1 TR000445-06. The content is solely the responsibility of the authors and does not necessarily represent the official views of the NIH.The dataset(s) used for the analyses (BioVU) described were obtained from Vanderbilt University Medical Center’s BioVU which is supported by numerous sources: institutional funding, private agencies, and federal grants. These include the NIH funded Shared Instrumentation Grant S10RR025141; and CTSA grants UL1TR002243, UL1TR000445, and UL1RR024975. Genomic data are also supported by investigator-led projects that include U01HG004798, R01NS032830, RC2GM092618, P50GM115305, U01HG006378, U19HL065962, R01HD074711; and additional funding sources listed at https://victr.vumc.org/biovu-funding/ Zachary F. Gerring is supported by NIH/NIA AG068026. Marco Galimberti received support from the following grants (Joel Gelernter): CSP575b, I01CX001849-01, 1P1HX002375, National Center for PTSD Research, 5R01DA054869-01. Abdel Abdellaoui was supported by the Foundation Volksbond Rotterdam. Tim Bigdeli is supported by NIMH grant 7R01MH103657 (GPC-OCD). Jonathan Coleman: This study represents independent research part funded by the National Institute for Health Research (NIHR) Maudsley Biomedical Research Centre at South London and Maudsley NHS Foundation Trust and King’s College London. The views expressed are those of the authors and not necessarily those of the NHS, the NIHR or the Department of Health and Social Care. Christina Barlassina was supported by grant EU FP7-HEALTH-2007-A-201550, and grant MIUR-CNR PB05. Enda Byrne was supported by the NHMRC Project Grant 1145645; University of Queensland Health Research Accelerator Program (HeRA).Carolina Cappi was supported by grant K99MH128540-01A1. Valentina Ciullo was supported by the Italian Ministry of Health grant RC-18-19-20-21/A. Richard Delorme: INSERM @ APHP granted the study. Marco A. Grados was supported by NIMH K23 MH066284. Jan Haavik was supported by Stiftelsen KG Jebsen (SKGJ MED-02). Kristen Hagen was supported by the Trond Mohn Foundation. Elinor K. Karlsson was supported by NIH R21 MH109938. Paul S. Nestadt was supported by R01MH071507. Fabrizio & Federica Piras are supported by the Italian Ministry of Health RC18-19-20-21/A grant. This work was in part supported by the German Research Foundation (DFG) grants: [RA1971/8-1], [RA1971/7-1]; and by the Bundesministerium für Bildung und Forschung (BMBF) grant: 01ED2007A to Alfredo Ramirez. Stephan Ripke was supported by research grant 1R01MH124873-01. Maria Soler Artigas was supported by the The Instituto de Salud Carlos III (P19/01224, PI22/00464 and CP22/00128) and the European Regional Development Fund (ERDF). Arpana Agrawal was supported from grant U10AA008401. Pino Alonso was supported by the Spanish Ministry of Science, Innovation and Universities (ISCIII PI22/00752) and Fundació La Marató 202201-30. Cynthia M. Bulik was supported by R01 MH124871 (Sullivan/Bulik) PGC4. Howard Edenberg was supported by grant U10AA008401. Dan A. Geller was supported by NIMH (OCGAS and OCGS). Gregory L Hanna was supported by the National Institute of Mental Health (R01 MH58376), National Institute of Mental Health (K20 MH01065), National Institute of Mental Health (R01 MH101493), National Institute of Mental Health (R01 MH085321) Norbert Kathmann has received funding from Deutsche Forschungsgemeinschaft (DFG) KA815/6-1. Sarah E. Medland is supported by an Australian NHMRC Investigator Grant (APP1172917). Benjamin M. Neale is funded by grant R01MH124851. Michele Pato and Carlos Pato have received support from R01MH103657 and R01MH079494 from the National Institutes of Mental Health (NIMH) and the Della Martin Foundation, Los Angeles CA. John Piacentini has received support through the National Institute of Mental Health: R01MH50214: Collaborative OCD Genetics Study (G. Nestadt, PI; J. McCracken, UCLA PI). Margaret A. Richter was supported by funding from the Canadian Institutes for Health Research and the Ontario Mental Health Foundation. David R. Rosenberg was supported by NIMH R01MH059299. Jack F. Samuels was supported by NIMH Grant Number: MH071507. Gianfranco Spalletta is supported by the Italian Ministry of Health RC18-19-20-21/A grant. Eric A. Storch collected data as part of the following NIH grant: 1R01MH093381. Ole A. Andreassen (MoBa) has received grant support from RCN (324499,273291,262656,248778,223273), KG Jebsen Stiftelsen, NordForsk #164218. Jaakko Kaprio has been supported by the Academy of Finland (grant 336823). Paul D. Arnold is supported by the Alberta Innovates Translational Health Chair in Child and Youth Mental Health. Dorothy E. Grice is supported by the grant MH124679-01. James A. Knowles is supported through the following grants: R01MH103657 and R01MH079494 from the National Institutes of Mental Health (NIMH) and the Della Martin Foundation, Los Angeles CA. Karin J.H. Verweij is supported by the Foundation Volksbond Rotterdam. Lea K. Davis was supported by grants from the National Institutes of Health including R01NS102371, R01MH113362, R01MH118223, R01NS105746, and R56MH120736. JS was supported by NIH training grant in Human Genetics, 2T32GM080178. James Crowley was supported by NIH grants R01MH105500 and R01MH110427. Murray B. Stein has been funded by the Veterans Affairs Administration (United States VA).
Web Resources & Code availability
Core analysis code for RICOPILI can be found at https://sites.google.com/a/broadinstitute.org/ricopili/. This includes PLINK (https://www.cog-genomics.org/plink2/), EIGENSOFT (https://www.hsph.harvard.edu/alkes-price/software/), Eagle2 (https://alkesgroup.broadinstitute.org/Eagle/), Minimac3 (https://genome.sph.umich.edu/wiki/Minimac3), SHAPEIT3 (https://mathgen.stats.ox.ac.uk/genetics_software/shapeit/shapeit.html), METAL (https://genome.sph.umich.edu/wiki/METAL_Documentation) and LDSR (https://github.com/bulik/ldsc). MAGMA can be found at https://ctg.cncr.nl/software/magma. Genomic SEM, specifically the tutorial ‘Models without Individual SNP effects’ can be found here: https://github.com/GenomicSEM/GenomicSEM/wiki/3.-Models-without-Individual-SNP-effectsTWAS FUSION: http://gusevlab.org/projects/fusion/ PWAS: For access to the protein weights, see: https://www.synapse.org/#!Synapse:syn24872746 GCTA (mBAT-combo and COJO): https://yanglab.westlake.edu.cn/software/gcta/#Overview LDSC and partitioned heritability: https://github.com/bulik/ldsc
Data availability
The meta-analyzed summary statistics (not including 23andMe data) will be made available via the Psychiatric Genomics Consortium Download page (https://www.med.unc.edu/pgc/download-results/).
The full GWAS summary statistics for the 23andMe discovery data set will be made available through 23andMe to qualified researchers under an agreement with 23andMe that protects the privacy of the 23andMe participants. Datasets will be made available at no cost for academic use. Please visit https://research.23andme.com/collaborate/#dataset-access/ for more information and to apply to access the data.
MVP summary statistics are made available through dbGAP request under accession phs001672.v7.p1.
Acknowledgments
We would like to thank the research participants and employees of 23andMe for making this work possible. A list of members of the 23andMe Research Team that contributed to this study can be found in Supplementary Note 1. The Trøndelag Health Study (HUNT) is a collaboration between HUNT Research Centre (Faculty of Medicine and Health Sciences, Norwegian University of Science and Technology NTNU), Trøndelag County Council, Central Norway Regional Health Authority, and the Norwegian Institute of Public Health. The genotype quality control and imputation has been conducted by the K.G. Jebsen center for genetic epidemiology, Department of public health and nursing, Faculty of medicine and health sciences, Norwegian University of Science and Technology (NTNU). HUNT analyses were performed in digital labs at HUNT Cloud, HUNT Research Centre Department of Public Health and Nursing, Faculty of Medicine and Health Sciences, Norwegian University of Science and Technology (NTNU), Trondheim, Norway. We are deeply grateful for the participation of all subjects contributing to the NORDiC research. We thank the collection team that worked to recruit them: Anders Juréus, Jessica Pege, Malin Rådström, Radja Satgunanthan-Dawoud, Milka Krestelica, and Birgitta Ohlander, as well as data manager Bozenna Iliadou. We also wish to thank the National Quality Registry for Eating Disorders (RIKSÄT) for help with recruiting patients. We finally wish to thank the BBMRI.se and KI Biobank at Karolinska Institutet for professional biobank service. MoBa is supported by the Norwegian Ministry of Health and Care Services and the Ministry of Education and Research. We are grateful to all the participating families in Norway who take part in this on-going cohort study. We wish to thank all the people who helped in the conception, implementation, beta testing, media campaign and data cleaning of the AGDS data. We would specifically like to acknowledge Dale Nyholt for advice on using the PBS for research; Ken Kendler, Patrick Sullivan, Andrew McIntosh and Cathryn Lewis for input on the questionnaire; Lorelle Nunn, Mary Ferguson, Lucy Winkler and Natalie Garden for data and sample collection; Natalia Zmicerevska, Alissa Nichles and Candace Brennan for participant recruitment support. Jonathan Davies, Luke Lowrey and Valeriano Antonini for support with IT aspects; Vera Morgan and Ken Kirkby for help with the media campaign. We would like to thank VIVA! Communications for their effort in promoting the study. We also acknowledge David Whiteman and Catherine Olsen from QSkin. Data analysis for EstBB was carried out in part in the High-Performance Computing Center of University of Tartu. The authors are grateful to participants, families and staff of primary and secondary schools who kindly contribute in this research (Marta Ribasés, Metal-Cat and INSchool). Silvia Alemany acknowledges Miguel Servet contract (CP22/00026) awarded by the Instituto de Salud Carlos III and co-funded by the European Union Found: Fondo Social Europeo Plus, FSEC□+.HYPERGENES and InterOmics cohorts provided controls of Italian origin for the present study. Judit Cabana-Dominguez acknowledges her contract from the Network Center for Biomedical Research (CIBER). Richard Delorme acknowledges the Clinical Investigation Centre, Robert Debré Hospital. Bengt Fundin acknowledges The Anorexia Nervosa Genetics Initiative (ANGI), an initiative of the Klarman Family Foundation. Jan Haavik acknowledges the Trond Mohn Foundation, Bergen, Norway Christine Lochner would like to acknowledge the South African Medical Research Council and the National Research Foundation for their support.
Footnotes
↵** jointly supervised this work
References


