
Abstract
Background The aim of this study was to explore potentially novel plasma protein biomarkers for lung adenocarcinoma (LUAD).
Methods A plasma proteomics analysis was carried out in LUAD cases and healthy controls. Candidate protein biomarkers were validated in 102 LUAD cases and 102 matched healthy controls. The same LUAD tumor tissues were detected to explore the correlation between the expression of candidate proteins in tissues and plasma and vascular normalization. A LUAD active metastasis mice model was constructed to explore the role of candidate proteins for lung metastasis.
Results In the screening phase, 5 candidate proteins were selected. In the validation phase, GPI and PGD were verified to be upregulated in plasma from LUAD patients. The expression of GPI in tumor tissue was positively correlated with the expression of GPI in plasma and negatively correlated with the normalization of tumor blood vessels. Meanwhile, a negative correlation between the expression of GPI and PGD in plasma and tumor vascular normalization was discovered. In the LUAD active metastasis model, the lowest levels of vascular normalization and the highest expression of GPI and PGD were found in mice with lung metastases
Conclusion This study found that GPI and PGD may be potential diagnostic plasma biomarkers for LUAD, providing new clues to assist in LUAD early screening. Meanwhile, monitoring the concentration of GPI and PGD in plasma may reflect the level of vascular normalization within the tumor and infer the risk of metastasis and malignancy of the tumor.
1. Introduction
Lung cancer still ranks the leading cause of cancer-related mortality, and 1.8 million patients died of which in 2020 worldwide1. Non-small cell lung cancer (NSCLC) accounts for about 85% of all lung cancer cases2, while lung adenocarcinoma (LUAD) accounted for nearly 60% of all NSLSC cases, presenting the primary histologic subtype3. What’s more, the incidence characteristics of LUAD present differently between genders, with the incidence of female LUAD patients increasing significantly in recent years4 5. Owing to LUAD is often initially asymptomatic, lacks effective screening programs, and has a greater metastasis tendency6, thus always leads many patients to be diagnosed at an advanced stage with poor survival. However, the fact that LUAD patients diagnosed with early-stage or have undergone surgery are more likely to get a better survival6, indicating the urgent need for an effective screening and diagnostic strategy for detecting LUAD at an earlier time.
Although tissue biopsy and tissue biomarkers are commonly recommended and still irreplaceable in clinical application, however, the clinical significance of tissue biopsies is mainly applied to distinguishing of benign and malignant tumors and sometimes can hardly be performed for early cancer screening and diagnosis. Besides, tissue biomarkers could not be sampled until after the tumor was detected. Meanwhile, tissue sampling is invasive, time-consuming, challenging to obtain, and harmful to patients7 8. Sometimes, in order to obtain enough samples, patients need repeated biopsies, and some patients are unable to undergo tissue sampling due to their wishes or other medical reasons9. The advent of liquid biopsy may make up for these limitations and may be more appropriate for patients who unwilling or unable to undergo a biopsy.
Samples for liquid biopsy involve blood, mucosa, pleural effusions, urine, and cerebrospinal fluid10. As blood is more accessible, efficient, convenient, and affordable than other body fluids, blood has become the critical fluid for liquid biopsy analysis. It is a valuable diagnostic tool to support differential diagnosis, estimate prognosis, and early detection of residual or progressive disease11. Analytes for blood biopsy include circulating tumor cells, circulating nucleic acids, the tumor-derived fraction of cell-free DNA, cell-free RNAs, extracellular vesicles, tumor-educated platelets, proteins, and metabolites12. One particular concern is that plasma contains an extensive and relatively comprehensive array of proteins, and the high stability of plasma proteins and the wealth of biological information they carry make them available as protein biomarkers for cancer. A previous study performed integrative proteomics analysis of 103 paired LUAD tumor tissues and adjacent non-tumor tissues from the Chinese population and identified differentially expressed proteins in the tissues. The most highly and commonly expressed protein with prognostic ability in tumor tissues was validated in plasma, resulting in HSP90AB1 as a potential prognostic biomarker13. Meanwhile, other proteins, like SAA214, CXCL1715, CEACAM5, VEGFR2, and ERBB316, have been identified as plasma biomarkers for LUAD via validating proteins that are differentially expressed in tissues. However, previous studies usually simply validated LUAD-related proteins in plasma rather than systematically performing high-throughput comprehensive proteomic analysis of plasma proteins and lacked integration of proteins consistently expressed in both tissues and plasma for analysis.
Considering its specific protein composition structure, it makes sense that there was rarely a comprehensive and systematic analysis of plasma proteins. Just one single protein, albumin, accounts for about 50% of all proteins; the top 22 proteins comprise 99% of all proteins. “Blood+” high-depth blood proteomics analysis can filter out interfering signals of high-abundance proteins and increase the detection depth of blood over 1000 while still maintaining good quantitative parallelism. Potential biomarkers for gastric cancer and type 2 diabetes have been identified by this high-depth proteomics technique17 18, however, this technique has not yet been applied to exploring of LUAD protein biomarkers.
In this study, to explore potential plasma protein biomarkers for LUAD, we first performed “Blood+” high-depth plasma proteomics analysis on LUAD patients and healthy controls. Proteomics data of LUAD tumor tissues and adjacent non-tumor tissues were then employed to select proteins that were consistently differentially expressed in both plasma and tissues. Meanwhile, to further maintain the consistency of differential protein expression on both transcriptome and proteomics levels, we introduced RNA-seq data of LUAD tumor tissues and adjacent non-tumor tissues in the previous step for further screening for plasma proteins consistent with mRNA and protein expression in tissues. After that, we expanded the sample and validated the candidate plasma protein biomarkers. Finally, we performed functional experiments on cancer metastasis in mice to explore the possible mechanisms for the differences in plasma protein expression, further supporting the value of plasma protein biomarkers to diagnose and predict the prognosis of LUAD.
2. Materials and methods
2.1 Study design
In the first phase, proteomic analysis was performed on plasma collected from 10 LUAD cases and 10 matched healthy controls to identify differential expressed proteins. To select proteins consistently expressed in plasma and tumor tissues, we combined proteomic data from LUAD tumor tissues and adjacent non-tumor tissues from the Chinese population. Proteins in tissues with fold change (FC) >3/2 or <2/3 were retained from raw proteomics data uploaded in the iProx Consortium with the subproject ID IPX0001804000, and proteins among them that overlapped with the differential plasma proteins in the first phase were selected. Considering that only about 40% of protein expression differences were consistent with changes in transcript levels, we cited RNA-seq data collected in GSE140343 and selected mRNAs with FC >3/2 or <2/3 that were consistently differentially expressed at the mRNA and protein levels in tissues as candidate plasma protein biomarkers (Figure 1). To validate the differential expression of candidate proteins biomarkers in plasma, we included 62 female LUAD cases and 62 age-matched healthy controls in the validation phase. For exploring whether the expression of candidate protein biomarkers is consistently expressed in male LUAD patients, 40 male LUAD cases and 40 age-matched healthy controls were included for validation of the candidate proteins.
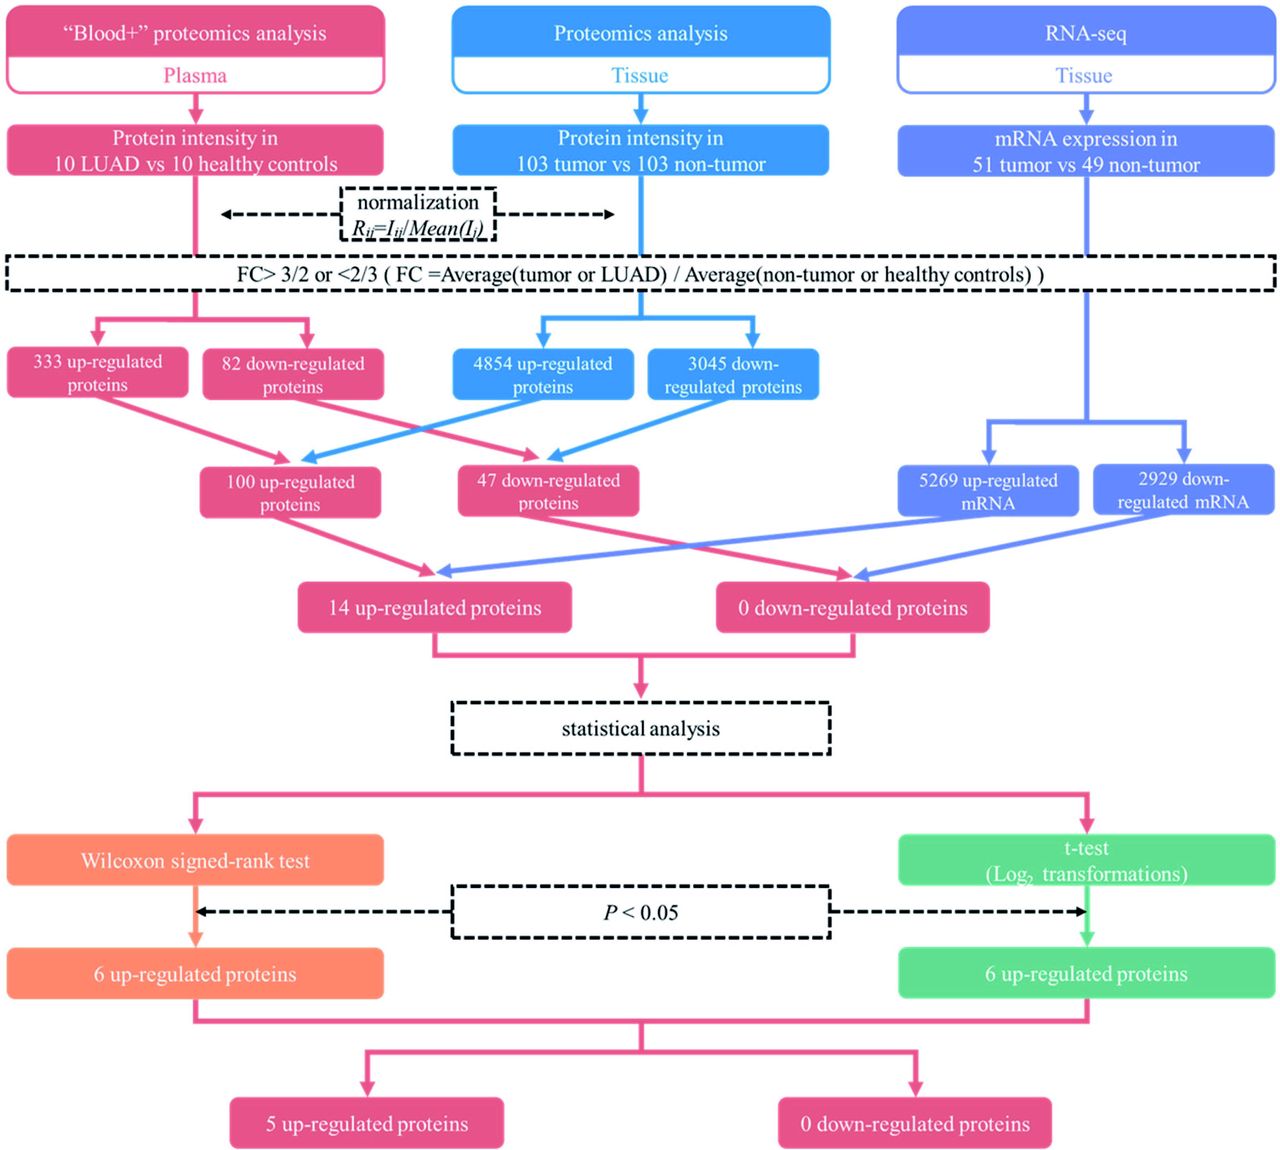
Schematic of candidate protein biomarkers screening.
2.2 Study Population
The 10 female LUAD cases in the first phase were obtained between 2021.08 and 2021.11 at Hai’an City People’s Hospital, Jiangsu Province, with 10 healthy controls matched by age. The population in the validation phase was obtained from two parts: a portion of 94 LUAD cases and 94 healthy controls matched according to gender and age from Hai ‘an City People’s Hospital and the Sixth People’s Hospital of Nantong between 2021.12 and 2022.06; The other 8 LUAD cases are from the inclusion phase of a cohort with more than two thousand participants in Jiangdu, Jiangsu Province which were discovered with LUAD at recruitment, and eight healthy controls were matched by gender and age in the cohort. The study was reviewed and approved by the ethics committee of Nantong University (Approval No. 2022-2). Informed consent was obtained from all patients.
2.3 “Blood+” high depth blood proteomics analysis
Proteomics analysis was conducted by Jingjie PTM BioLabs (Hangzhou, China). Primary experimental procedures for “Blood+” high depth blood proteomics analysis included protein extraction, trypsin digestion, LC-MS/MS analysis, and data analysis. First, the plasma samples were centrifuged at 4 °C, 12,000 g for 10 min to remove cell debris. Then, the protein concentration was determined with BCA kit according to the instructions. After trypsin digestion of each sample protein into peptide fragments, then the tryptic peptides were dissolved in solvent A (0.1% formic acid, 2% acetonitrile/ in water) and separated using an EASY-nLC 1200 UPLC system (ThermoFisher Scientific). Finally, the resulting raw data were processed using MaxQuant search engine (v.1.6.15.0). FDR was adjusted to < 1%. For the determination of differentially expressed proteins, the fold change is calculated as the average of the comparisons between biological replicates.
2.4 Sample size calculation
The sample size for the validation phase is determined by the following formula, where n = sample size, α=significant level, δ=1-power of test, and p = sensitivity or specificity. It is assumed that the sensitivity and specificity for LUAD diagnostic screening were both 80%, setting significant level as 0.05 and power of test as 0.90, thus giving an estimated sample size of 61.

2.5 Data sources
The proteomic and transcriptomic data of LUAD tumor tissues and adjacent non-tumor tissues in the Chinese population were obtained from the research published in cell by Xu et al13. Their proteomic data were downloaded on the iProx consortium with the subproject ID IPX0001804000. And the RNA-seq data were downloaded from the Gene Expression Omnibus (GEO) database with an accession number: GSE140343.
2.6 Enzyme-linked immunosorbent assay (ELISA)
ELASA kits allow for the determination of ASS1, PGD, GAPDH, GPI in plasma samples in this study. Collected plasma was sampled after centrifugation at 2,000[rpm for 20[min at 4°C and stored at −80°C until analysis. Commercial enzyme-linked immunosorbent assay (ELISA) kits purchased from Meimian Biotechnology (Yancheng, Jiangsu, China) were used to measure protein level in human plasma samples according to the manufacturer’s recommendations. Absorbances were measured in a microplate reader (Sunrise, Tecan, Austria) at 450[nm.
2.7 Evaluation of candidate plasma protein biomarkers for LUAD diagnosis
To further evaluate the ability of candidate plasma protein biomarkers as potential biomarkers for LUAD diagnosis, receiver operating characteristic (ROC) curves were constructed, and the area under the ROC curves (AUC) were calculated based on samples originating from the validation phase.
2.8 Kaplan-Meier Survival Analysis
The Kaplan-Meier Plotter website (https://kmplot.com/analysis/) was used to analyze the relationship between mRNA expression and overall survival of LUAD patients. The proteomics data and clinical data were obtained from iProx Consortium with the subproject ID IPX0001804000 (https://www.iprox.org/page/PSV023.html;?url=15717295820259eyj) for further analysis. The relationship between the expression of proteins with survival time of LUAD patients was assessed vis Cox regression analysis. Differences between high and low risk groups were evaluated using the Kaplan-Meier method, based on the best separation of expression, employing R packages of survminer and survival.
2.9 Functional analysis of GPI, PGD, and related genes
To identify enriched functional classes of GPI and PGD and related genes, the functional relationships of genes associated with GPI and PGD were revealed using STRING (https://string-db.org/), and Cytoscape was used to construct the PPI (protein-protein interaction) network of the top 50 related genes. Gene Oncology (GO) and Kyoto Encyclopedia of Genes and Genomes (KEGG) pathway enrichment analysis was performed using the Database for Annotation, Visualization, and Integrated Discovery (DAVID) (https://david.ncifcrf.gov/). Following the instructions of the DAVID manual, GPI and PGD and the top 50 related genes were uploaded, and the function charts were generated. The 10 groups with more than two genes and the most significant P-values in each category were retained for study.
2.10 Immunohistochemical staining and immunofluorescent staining
LUAD tumor tissue specimens were fixed in Bouin’s fixative for 24 h, then embedded in paraffin and sectioned by paraffin microtome (Thermo HM340E). After deparaffinization and rehydration, the slides were immersed in sodium citrate buffer (pH 6.0) for antigen retrieval and maintained at sub-boiling temperature for 15 min. Subsequently, the slides were incubated with 10 % normal goat serum for 30 min at room temperature to block non-specific staining. For immunohistochemistry stainings, the slides were incubated with GPI (CST, 94068T) or PGD (Proteintech, 14718-1-AP) antibody solution for 24 h at 4 °C with gentle shaking. The images were scanned with pathology section scanner (Pannoramic MIDI) after DAB staining. For dual immunofluorescence staining, the slides were simultaneously incubated with mouse-derived CD31 (Servicebio, GB12063) and rabbit-derived α-SMA (Servicebio, GB111364) antibody solution for 24 h at 4 °C with gentle shaking. The images were scanned with pathology section scanner (Pannoramic MIDI) after incubation with the mouse-derived (red) and rabbit-derived (green) fluorescent secondary antibody. The staining intensity was analyzed with Image J.
2.11 LUAD active metastasis model
All care and treatment of experimental mice were approved by Nantong University Animal Care and Use Committee guidelines. The 6 weeks old C57BL/6 male mice were purchased from SLAC Laboratory Animal Center (Shanghai, China) and maintained in SPF facilities. Murine-derived LUDA LLC cells (5 × 10⁵) were subcutaneously injected into the right axilla of C57BL/6 mice. When the subcutaneous tumor volume of the mice reached 1500 mm3, the subcutaneous tumor tissue was removed by aseptic surgery. After 4 weeks, the mice were euthanized to observe the occurrence of lung metastasis. Tumor tissues from mice without lung metastases and mice with lung metastases were taken, and the vascular marker CD31 was co-stained with the perivascular endothelial marker α-SMA by immunofluorescence. Take tumor tissues of mice without lung metastasis, the tumor tissues of mice with lung metastasis and the corresponding lung metastasis tumor tissues, and evaluate the expression of GPI, PGD and perivascular endothelial marker α-SMA by Western Blot.
2.12 Statistical analysis
Differences in the distribution of demographic characteristics between the case and control groups were expressed as medians and percentages, calculated using the two-sided chi-square tests. T-test and Wilcoxon signed-rank test were performed to compare the expression difference of each detectable protein between the case group and control groups. Protein intensities were normalized before Wilcoxon signed-rank test were performed. Before performing the t-test, the normalized protein intensities were log2 transformed to ensure the normality. Proteins with a fold change >3/2 or <2/3 (FC =Average (tumor tissues or LUAD) / Average (adjacent non-tumor tissues or healthy controls)) and P < 0.05 are considered as significantly differentially expressed. R 4.1.1 and SPSS 23.0 were used for the statistical analysis.
3. Result
3.1 Characteristics of the study population
The characteristics of the participants in the case and control groups are detailed in Table 1. In the screening phase, comparable ages existed between the case and control groups (P=0.79), and the proportion of cases with stage I LUAD reached 80%. In the validation phase, the age distribution was not different in females between the case and control groups (P=0.14), and 91% of the female cases were stage I LUAD. Meanwhile, there was no difference in male age distribution between the case and control groups (P=0.95), with stage I LUAD accounting for 75% of the male LUAD cases.
3.2 “Blood+” proteomics analysis of plasma samples
A total of 1,331 proteins were identified by “Blood+” high-depth blood proteomics analysis, of which 1,113 could be quantitatively analyzed. On this basis, analyzed at FC>3/2 or <2/3 level, 415 proteins are selected, with 333 proteins upregulated and 82 proteins downregulated in the case group. Among these, 102 proteins were upregulated and 28 proteins were downregulated by the significance test at P<0.05. The details are mentioned in Figure 2A-2B.

Screening and validation of candidate plasma proteins.
(A) 1,331 identified proteins in plasma, CP: cytoplasm; ER: endoplasmic reticulum; EC: extracellular; MC: mitochondria; PM: plasma membrane.
(B) The differentially expressed proteins between the case and control groups are described using volcano plots. The differentially expressed proteins on the statistical criteria of fold change <2/3, >3/2 (log2 scaled), and P < 0.05 (−log10 scaled).
(C) Differential expression of GPI between 102 LUAD cases and 102 healthy controls in the validation phase. (D) Differential expression of PGD between 102 LUAD cases and 102 healthy controls in the validation phase. Navy blue, total LUAD cases, red, total healthy controls; green, female LUAD cases, light blue, female healthy controls; purple, male LUAD cases, orange, male healthy controls. (E) ROC curve for GPI expression levels of LUAD cases versus healthy controls. (F)
ROC curve for PGD expression levels of LUAD cases versus healthy controls. (G) ROC curve for combined GPI and PGD expression levels of LUAD cases versus healthy controls.
3.3 Selection of differentially expressed proteins in both plasma and tissues
We subsequently analyzed the expression of above 415 candidate plasma proteins in 103 paired LUAD tumor tissues and adjacent non-tumor tissues, selecting proteins with consistent direction of altered expression in both plasma and tissues. According to the criteria of FC>3/2 or <2/3, 4,854 proteins were upregulated and 3,045 proteins were downregulated in tissues. Among which, 147 proteins were differentially expressed and altered in the same direction in both tissues and plasma, including 100 upregulated proteins and 47 downregulated proteins.
3.4 Selection of differentially expressed proteins in both proteome and transcriptome
We expect to identify plasma proteins that are consistent with the direction of differential mRNA and protein expression in tumor tissues. Therefore, we introduced GSE140343, which including RNA-seq data from 51 LUAD tumor tissues and 49 adjacent non-tumor tissues, with 5,269 upregulated mRNAs (FC>3/2) and 2,929 downregulated mRNAs (FC<2/3) in LUAD tumors. Of the previous 147 proteins differentially expressed in both tissues and plasma, 14 upregulated proteins were also expressed as upregulated in the mRNA level in tissues (Table 2). Wilcoxon signed-rank test and t-test were performed separately for these 14 proteins to improve the test efficacy, and five overlapped proteins exhibited expression differences at the criterion of P<0.05 (Table 3). Among them, HSP90AB1 has been completely validated as a potential prognostic marker in previous study, so this protein was not repeated in this study and was excluded in the next phase of validation.
3.5 Validation of candidate plasma proteins
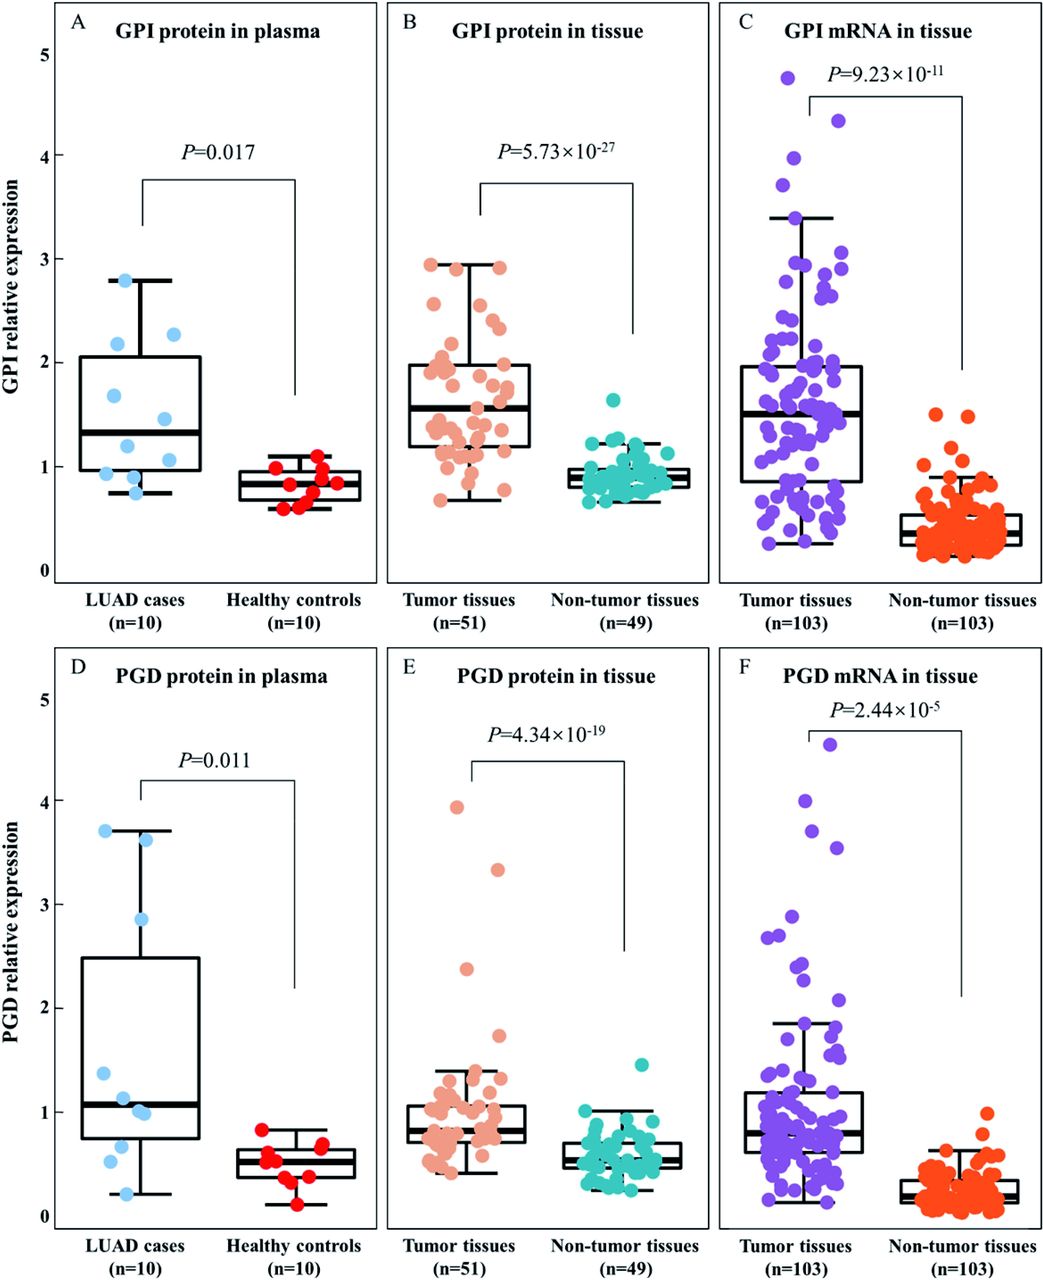
To verify the difference in expression of ASS1, GAPDH, PGD, and GPI between LUAD patients and the healthy controls, we expanded samples and assessed the expression levels of these proteins in the plasma from female and male LUAD cases and matched healthy controls using ELASA. Statistically significant differences in the expression of GPI and PGD were found between the 62 female LUAD cases and 62 healthy controls. Compared to the control group, PGD and GPI expression levels were both significantly higher in the female case group, with P-value were 2.17×10⁻¹⁵ and 4.12×10⁻¹⁴, respectively (Figure 2C, Figure 2D). Further, the expression of GPI and PGD is also found upregulated in the plasma of male LUAD cases with P values of 1.22×10⁻⁹ and 3.83×10⁻⁷. After combining male and female cases, GPI (P=1.2×10⁻¹⁴) and PGD (P=4.1×10⁻¹³) were both highly expressed in plasma of the combined LUAD cases (Figure 2C, Figure 2D). However, the differences in the expression levels of ASS1 and GAPDH in the case and healthy control groups were not statistically significant (P>0.05), thus they will be excluded from future research. As a result, GPI and PGD proteins are consistently upregulated in plasma and tumor tissues of LUAD cases (Figure 3A-3B, Figure 3D-3E). And GPI and PGD proteins and mRNA are consistently upregulated in tumor tissues of LUAD cases (Figure 3B-3C, Figure 3E-3F).

GPI and PGD are consistently differential expressed in both plasma and tissues. (A) GPI protein are differential expressed in plasma. (B) GPI protein are differential expressed in tissue. (C) GPI mRNA are differential expressed in tissue. (D) PGD protein are differential expressed in plasma. (E) PGD protein are differential expressed in tissue. (F) PGD mRNA are differential expressed in tissue.
3.6 Evaluation of PGD and GPI for LUAD diagnoses
To investigate the potential of GPI and PGD as plasma biomarker in LUAD diagnosis, the ROC curves and the AUC were calculated using subjects from validation phase, including 102 LUAD cases and 102 healthy controls. The ROC curves showed strong distinction between the LUAD cases and healthy controls, with the AUC of 0.795 (95%CI: 0.733-0.856) for GPI (Figure 2E) and 0.839 (95%CI: 0.785-0.893) for PGD (Figure 2F). The sensitivity and specificity of GPI for LUAD diagnosis screening were 77.5% and 74.5%, respectively, and the sensitivity and specificity of PGD for LUAD diagnosis screening were 87.3% and 72.5%, respectively. By combining GPI and PGD, we generated a ROC curve with an AUC of 0.873 (95%CI: 0.824-0.922), sensitivity of 93.1% and specificity of 72.5% (Figure 2G).
3.7 Survival analysis of PGD and GPI in LUAD
Using the Kaplan-Meier Plotter website, the association between the mRNA expression levels of GPI and PGD in LUAD patients and their prognosis was investigated by the Kaplan-Meier analysis. As illustrated in Figure 4A-4B, expression of GPI mRNA and PGD mRNA were significantly correlated with the prognosis in LUAD, with overexpression of both GPI and PGD leading to a worse prognosis (P=0.024). In addition, the results were validated at the protein level. The group with high protein expression of GPI and PGD had a considerably worse prognosis than group with low expression in LUAD patients (P=0.048, P=0.034) (Figure 4C-4D).

Kaplan-Meier estimates the overall survival probability of LUAD patients. (A-B) Kaplan-Meier estimates of the overall survival probability of LUAD patients in Kaplan-Meier Plotter. (C-D) Kaplan-Meier survival curve analysis of the prognostic significance of a high and a low protein expression of GPI and PGD.
3.8 Gene ontology (GO) classifications and KEGG mapping
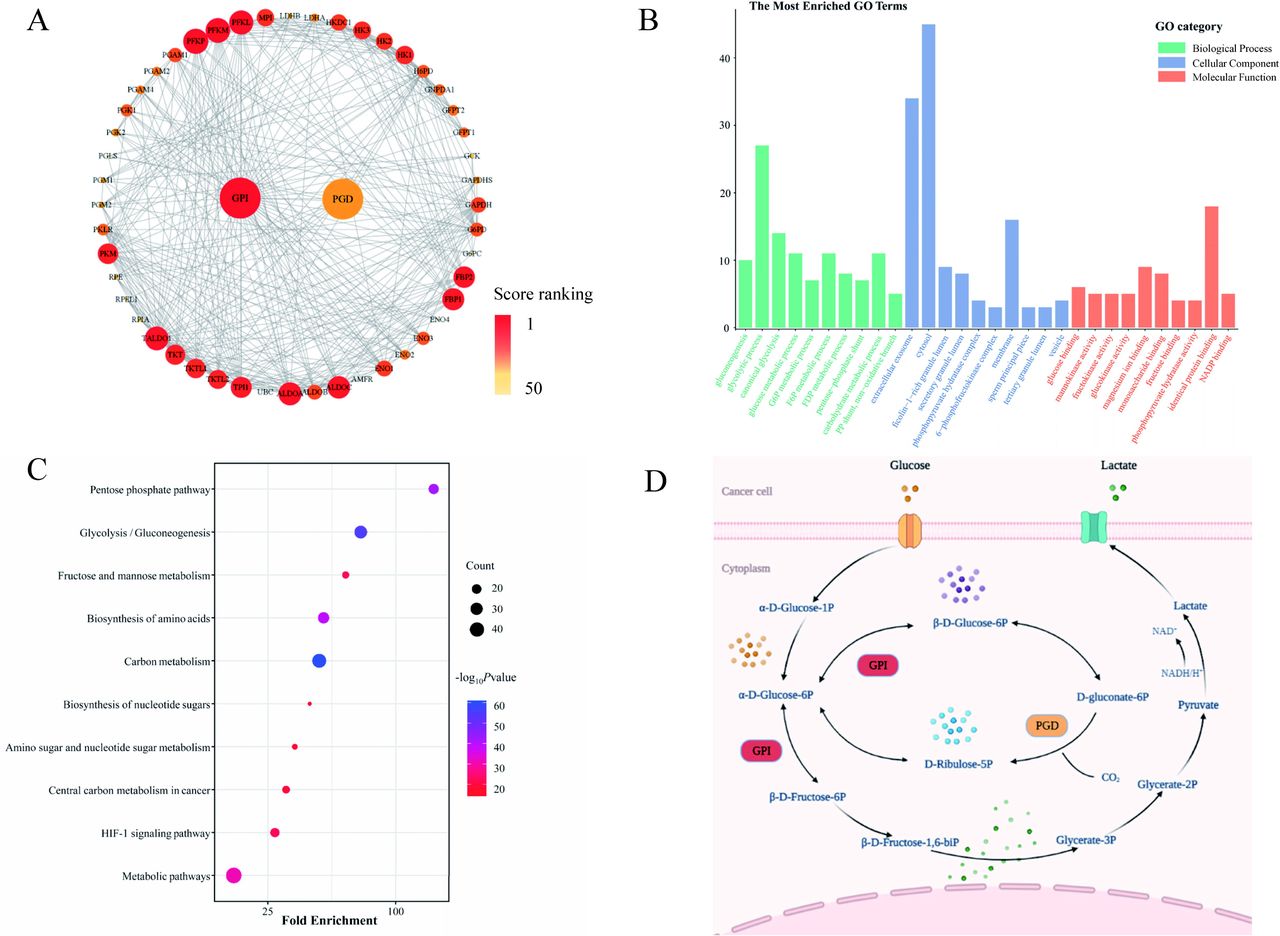
The enrichment of the GO and KEGG pathways was carried out by DAVID Bioinformatics Resources. 106 GO terms, including 48 biological processes, 16 cellular components, and 42 molecular function terms, were assigned to GPI, PGD, and the related top 50 genes. In the molecular function, “identical protein binding” was the most significantly enriched GO-term. GO cellular compartment analysis showed that GPI and related genes were highly enriched in “cytosol”. The most prevalent biological processes assignment was “glycolytic process” (Figure 5A-5B). The pathways in the KEGG database serve as representations of molecular interactions and reaction networks. To identify signaling pathways involved in GPI and PGD, we had mapped the KEGG database and discovered that the relevant genes were significantly enriched in 22 KEGG pathways. The relevant genes were highly clustered in several signaling pathways, such as “Metabolic pathways”, “Glycolysis/Gluconeogenesis”, “Carbon metabolism” and “Pentose phosphate pathway” (Figure 5C-5D).

GO functional classification and KEGG pathway mapping of GPI, PGD, and relevant genes. (A) The STRING database was used to analyze the top 50 relevant genes and Cytoscape was used to display the protein-protein interaction (PPI) network. (B) The distributions were summarized in three main categories: biological process, molecular function (MF), and cellular component (CC). (C) Scatter plot of enriched KEGG pathways statistics. The color and size of the dots represent the range of the P-value and the number of genes mapped to the indicated pathways, respectively. Top 10 enriched pathways are shown in the figure. (D) The map of “glycolysis” was modified from the KEGG map.
3.9 Association between GPI and PGD expression and tumor vascular normalization
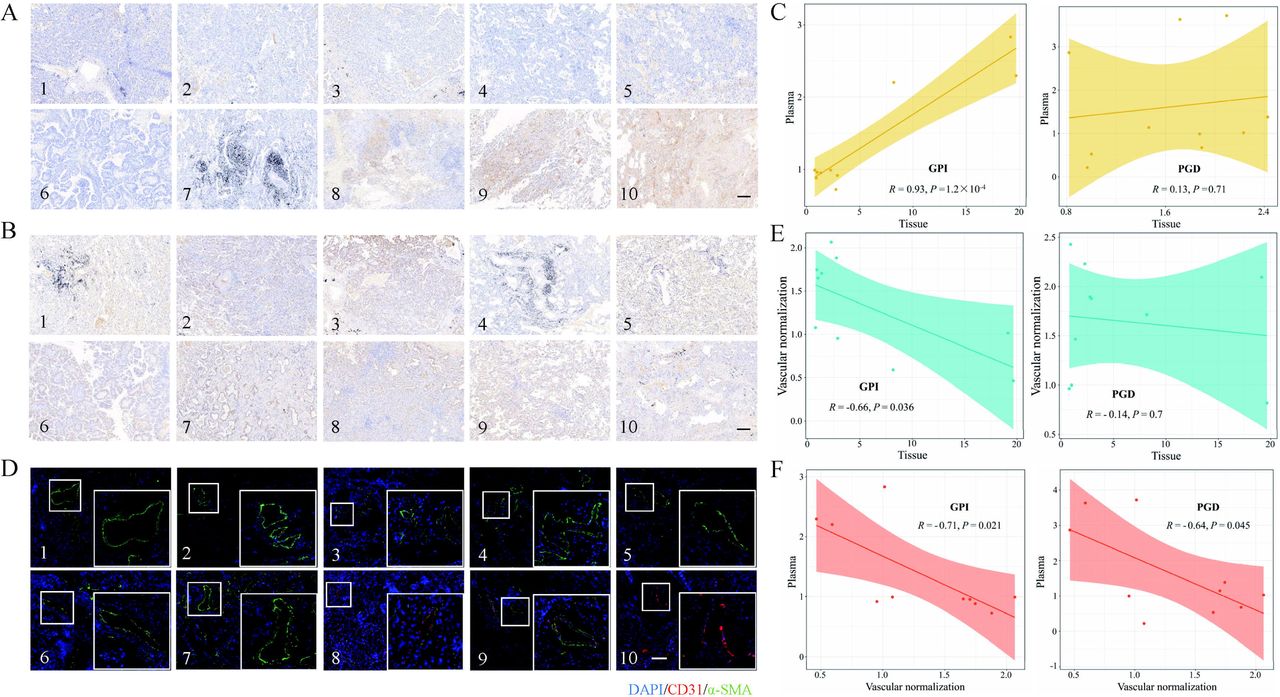
It is unclear whether the expression of GPI and PGD in plasma correlates with the expression of GPI and PGD in tissue, even though both GPI and PGD are upregulated in tissue and plasma. For that, we determined the expression of GPI and PGD in the corresponding tumor tissue from 10 LUAD cases in which plasma was previously used for plasma proteomics analysis. The immunohistochemical staining results of GPI and PGD in tumor tissue are shown in Figure 6A and Figure 6B, respectively. A correlation analysis was performed to assess the relationship between the expression of GPI and PGD in plasma and tumor tissue. Significant positive correlations were detected between the expression of GPI in tissues and plasma (R=0.93, P=1.2×10⁻⁴), while the expression of PGD did not show a correlation in tissues and plasma (R=0.13, P=0.710) (Figure 6C).

Association between expression of GPI and PGD and vascular normalization. (A) Immunochemical staining results of GPI in tumor tissues. Scale: 200µM. (B) Immunochemical staining results of PGD in tumor tissues. Scale: 200µM. (C) Correlation analysis between the expression of GPI and PGD in tumor tissues and plasma. (D) Immunofluorescence photographs of LUAD tumor tissue with CD31 and α-SMA staining. Scale: 200µM (E) Correlation analysis between the expression of GPI and PGD in tumor tissues and vascular normalization. (F) Correlation analysis between the expression of GPI and PGD in plasma and vascular normalization.
Tumor cells and its related substances breaking through the vascular basement membrane and entering the vasculature are the prerequisites for blood biopsy. And the immature and unstable vasculature of the tumor microenvironment provides a convenience for primary tumor cells and its related substances to enter the vasculature. To identify the role of GPI and PGD in tumor vascular normalization, we performed immunofluorescent staining on the corresponding tumor vessels from 10 LUAD cases in which plasma was previously used for plasma proteomics analysis (Figure 6D). Correlation analysis revealed a negative correlation between GPI expression in tissues and the normalized level of tumor vessels (R=-0.66, P=0.036) (Figure 6E), suggesting that high expression of GPI in tumor tissues may lead to abnormal tumor vascular development. The degree of tumor vascular normalization was inversely correlated with the expression of both GPI (R=-0.71, P=0.021) and PGD (R=-0.64, P=0.045) in plasma (Figure 6F), indicating that abnormalities in tumor vessels may facilitate the infiltration of substances from tumor tissue into the bloodstream.
3.10 LUAD active metastasis model
We constructed a LUAD active metastasis model to explore the association between the expression of GPI and PGD in tumor tissue and lung metastasis (Figure 7A). The blood vessels of the tumor tissue in situ without lung metastasis (a) and the tumor tissue in situ with lung metastasis (b) were performed immunofluorescent staining assay (Figure 7B). The results showed that the tumor tissue in situ with lung metastasis presented abnormal vascular morphology (Figure 7C), demonstrating that abnormalities in tumor vessels increase the risk of lung metastasis.

Lung adenocarcinoma active metastasis model. (A) Schematic of active metastasis tumor-bearing mice model, tumor tissues of mice without lung metastasis (a), the tumor tissues of mice with lung metastasis (b) and the corresponding lung metastasis tumor tissues (c). (B) Immunofluorescence photographs of tumor tissue of mice without lung metastasis (a), the tumor tissues of mice with lung metastasis (b) with CD31 and α-SMA staining. Scale: 200µM. (C) Differential expression of α-SMA in tumor tissue of mice without lung metastasis (a), the tumor tissues of mice with lung metastasis (b). (D) The expression of α-SMA, GPI, PGD in tumor tissues of mice without lung metastasis(a), the tumor tissues of mice with lung metastasis (b) and the corresponding lung metastasis tumor tissues (c). (E) Differential expression of α-SMA, GPI, and PGD in tumor tissue of mice without lung metastasis(a), the tumor tissues of mice with lung metastasis (b) and the corresponding lung metastasis tumor tissues (c). (*P < 0.05; ***P < 0.001).
Western-blot assay showed that the expression of GPI and PGD was highest in the tumor tissues of mice with lung metastasis. The expression of GPI and PGD was higher in the tumor tissues of mice with lung metastasis (c) than those without lung metastasis (a) (Figure 7D, Figure 7E), suggesting that high expression of GPI and PGD in tumor tissues may promote lung metastasis in mice. The Western-blot results of α-SMA, representing the level of vascular normalization, were consistent with the immunofluorescent staining results of tumor vessel. The expression of α-SMA in tumor tissues of mice with lung metastases (b) was lower than that in mice without lung metastases (a), and the expression of α-SMA was lowest in lung tumors with lung metastasis (c) (Figure 7E), indicating that abnormalization of blood vessels may increase the risk of lung metastasis.
4. Discussion
Screening and diagnosis of LUAD remains dependent on imaging nowadays, lacking more economical and efficient strategies to detect LUAD at the beginning of tumor development. The adoption of plasma proteins as biomarkers is less invasive and more concise and efficient than previous tissue tests, while may also help in dynamic monitoring of LUAD progression. After several phases of screening and validation, transcriptomic and proteomic analyses of LUAD revealed that GPI and PGD are highly expressed in both plasma and tumor tissues of LUAD patients. ROC curve analysis demonstrates that GPI and PGD can distinguish well between LUAD and healthy controls, showing that they may be used for the early diagnosis of LAUD. The results of immunohistochemistry, immunofluorescence staining and mice models showed a negative correlation between GPI and PGD expression in plasma and vascular normalization, suggesting that high expression of GPI and PGD may indicate a risk of tumor metastasis, leading to a poor prognosis.
This study initially identified differential protein expression in the plasma of LUAD patients, and then referenced data from proteomic analysis in LUAD tumor tissues, that also from Chinese patients, to maintain the consistency of protein expression in both tissues and plasma. Gene expression can be divided into two primary phases: mRNA and protein expression, which are regulated by complex mechanisms. Although, on average, the correlation between protein and mRNA concentration was weaker in multicellular organisms19, we could find five proteins that were consistently upregulated in mRNA and protein levels by integrating the data of multi-omics. The expression of these five proteins is consistent in tissues and plasma, improving the candidate proteins’ reliability as biomarkers for LUAD. At the same time, the five proteins are co-upregulated at the mRNA and protein levels in tissues, which may provide clues for subsequent exploration of possible regulatory pathways.
Among female lung cancer patients, the proportion of LUAD patients keeps increasing, from 54.2% in 1993-1999 to 62.3% in 2010-201520. Therefore, in the first phase of this study we included only female LUAD cases and female healthy controls for proteomic analysis, with the aim of focusing on plasma protein biomarkers for female LUAD. After expansion of the sample, ELASA was performed separately by gender grouping, GPI and PGD showed upregulation in the plasma of both male and female LUAD cases. Although proteomic analysis included only female cases and healthy controls at the screening phase, differences in expression of GPI and PGD were validated in both female and male, suggesting that the above two potential protein biomarkers may be universal between male and female LUAD patients, despite the gender-specific differences that exist in the incidence of LUAD.
In this study, analysis of the KEGG pathway for genes related to GPI and PGD revealed that these genes are enriched in carbon metabolism, glycolytic and pentose phosphate pathways (PPP), all associated with energy metabolism. One of the “hallmarks of cancer” is an altered energy metabolism, characterized by a preferential reliance on glycolysis for energy production in a manner that is not oxygen-dependent21 22. Cancer cells exhibit enhanced glucose absorption and glycolysis, and glycolytic genes are often overexpressed in 24 types of cancer, including lung cancer23. PPP is critical for cancer cell survival as well as ribonucleotide and lipid production, and accumulating evidence suggests that tumorigenic lesions in cancer cells regulate the flux of PPP either directly or indirectly24. GPI (EC 5. 3. 1. 9), a dimeric enzyme with a molecular mass of 132,000, catalyzes the interconversion of D-glucose-6-phosphate and D-fructose-6-phosphate25. Knockdown of GPI has been shown to severely impair glycolysis in cancer cells without affecting overall cell survival26. And regulation of glycolytic proteins like GPI has anti-tumor effects and may be a potential target for tumor treatment27 28. As well, GPI is implicated in the prognosis of cancer. GPI promotes metastasis in colorectal cancer29 and is also a prognostic predictor for hepatocellular carcinoma30. In addition to glycolytic mechanisms, GPI functions in the development of the tumor immune microenvironment and LUAD31. Most importantly, it has recently been demonstrated that GPI is informative in the diagnosis and prognostic assessment of LUAD31.
PGD is the third enzyme in the PPP, has been reported to contribute to tumor development in cancer cell metabolism32, lipogenesis33, redox homeostasis34, cell metastasis and proliferation35, and radiation resistance36. PGD is linked to tumor cell migration, and by lowering down PGD, tumor cell proliferation can be reduced33 34. PGD was reported to be upregulated in lung cancer, and upregulation of PGD expression plays an important role in lung cancer cell proliferation and tumor growth37. Hyperexpression of PGD gene was associated with reduced survival in ovarian and lung cancer patients38, consistent with the results of this study. Blockade of PGD can enhance anti-tumor function by generating CD8+ effector T cells, and accordingly was screened as a potential immunotherapeutic biomarker for LUAD39. PGD expression was markedly upregulated in cisplatin-resistant cancer cell lines, suggesting that PGD may represent a fresh avenue for overcoming the drug’s resistance38.
Tumor abnormal vasculature were characterized by discontinuous endothelial lining and defective basement membrane, which Promotes tumor cells and its related substances into the body circulation. Then, plasma protein biomarkers derived from tumor cells may be more sensitive and specific in recognizing LUAD, so it is desirable to identify the source of plasma proteins. In this study, we found that high expression of GPI in tumor tissues may lead to abnormalities in tumor vasculature, and the abnormalities in tumor vasculature may promote the entry of cancer cells and related substances into the circulation, thus leading to tumor metastasis. This is supported by the negative correlation between GPI and PGD expression in plasma and normalization of tumor vessels, indicating that GPI and PGD in plasma are leaking into the blood through heterogeneous vessels in tumor tissue. Tumor cells are highly glycolytic40, while glycolysis inhibits the vascular support function of pericytes41. Targeting tumor cell glycolysis induces normalization of tumor vasculature, thereby reducing invasion, endocytosis, and dissemination of cancer cell40. Therefore, as key enzyme proteins of glycolysis, monitoring the concentration of GPI and PGD in plasma can reflect the normalized level of blood vessels within the tumor and infer the risk and malignancy of tumor metastasis (Figure 7F, Figure 7G).
This study has several advantages. Firstly, we initially performed proteomic analysis of plasma from LUAD cases, and then selected candidate plasma proteins that were also differentially expressed in tumor tissues with the same direction. The selection of plasma proteins with the consistent direction of differential expression in both plasma and tissues enhances the reliability for subsequent biomarker evaluation and provides higher feasibility for subsequent screening of high-risk groups for LUAD. Secondly, we maintained the consistency of differential protein expression at the transcriptomic and proteomic levels and screened for plasma candidate proteins consistent with mRNA and protein expression in tissues. Maintaining consistent expression of mRNA and protein provides clues for subsequent in-depth exploration of the relevant pathways and mechanisms regulating the development of LUAD. Thirdly, plasma from 10 LUAD cases was selected for proteomic analysis, and tumor tissues from the same 10 LUAD cases were also collected for immunohistochemical and immunofluorescence staining. As a result, information on plasma GPI and PGD expression, tissue GPI and PGD expression, and vascular normalization levels were obtained from the same individuals. Determining the expression of GPI and PGD in both tissues and plasma, and observing the corresponding vascular normalization, which are all from the same individual, for correlation analysis is more convincing and credible, avoiding bias from individual differences. Last, this study identified two potential protein biomarkers for LUAD from the population and conducted in vivo animal experiments and a tumor-bearing mice model to attempt to explore possible mechanisms for the high expression of GPI and PGD in plasma. By starting from a proteomic analysis, then validating it in plasma, and finally rationalizing the results via functional experiments, thus provides a comprehensive illustration that GPI and PGD may be potential biomarkers in plasma for LUAD.
5. Conclusion
In summary, we identified GPI and PGD as potential novel diagnostic and prognostic biomarkers for LUAD. PGD and GPI can be used as diagnostic biomarkers in combination with other available strategies to assist in the screening and diagnosis of LUAD, and as prognostic biomarkers aid in predict the risk of tumor metastasis and malignancy in patients with LUAD.
Competing interests
The authors declare that they have no competing interests.
Data Availability
All data produced in the present study are available upon reasonable request to the authors
Author contributions
Yiran Liu: Conceptualization, Investigation, Writing – original draft, Writing – review & editing. Yang Hu: Conceptualization, Investigation, Resources, Writing – original draft; Yanchi Wang: Funding acquisition, Writing – review & editing. Liping Mao: Conceptualization, Writing – review & editing. Rongrong Zhao: Data curation, Investigation. Wendi Zhang: Formal analysis, Software. Huiwen Xu: Data curation, Investigation. Buyun Xu: Data curation Yutong Wu: Data curation, Formal analysis, Investigation. Qiong Chen: Software, Investigation. Xiaobo Tao: Data curation, Software. Shufan Xu: Formal analysis, Data curation. Xun Zhuang: Writing – review & editing. Yulong Lian: Investigation, Formal analysis. Yihua Lu: Methodology, Supervision. Lei Zhang: Resources, Methodology. Tian Tian: Investigation, Writing – review & editing. Guangyu Tian: Resources, Supervision. Jiahua Cui: Methodology, Writing – review & editing. Minjie Chu: Funding acquisition, Investigation, Methodology, Supervision, Validation, Visualization, Project administration.
Acknowledgements
This work was supported by the National Natural Science Foundation of China (82273715, 82203771), the National Key Research and Development Program of China (2022YFC2503202), the Science and Technology Program of Nantong City (MS22022062, JC22022002), the Talent Training Climbing Action Plan Project of the Sixth People’s Hospital of Nantong, and the Postgraduate Research and Practice Innovation Program of Jiangsu Province (KYCX21-3126, KYCX20-2852).
Reference


