
Abstract
While pharmacokinetics (PK) of many drugs is known to be altered in individuals with diabetes mellitus (DM), the effects of DM on the PK of anti-tuberculosis (TB) drugs remains poorly understood.
We performed a systematic review through searches of major databases from 1946 to 6 July 2023. The literature search identified 4173 potentially relevant articles. After reviewing the eligibility criteria, 21 articles were included that assessed the PK of anti-TB drugs among patients with DM.
Most articles focused on first line TB drugs; we identified 16 studies assessing rifampicin PK, 9 studies on isoniazid, 8 on pyrazinamide and 3 assessing ethambutol. Only 2 studies reported on second line anti-TB treatment. While some studies showed lower plasma concentrations of TB medications among DM patients, this finding was not consistent. In addition, we observed high variability in findings and significant heterogeneity among studies in terms of study design and differences in demographics.
This review provides detailed overview of the limited evidence available regarding the PK of anti-TB medications in patients with DM. However, due to significant heterogeneity between studies, no conclusions could be made. Adequately designed PK studies using standardise methodologies are urgently needed to make recommendations regarding drug dosing in patients affected both by TB and DM.
Introduction
The global tuberculosis (TB) burden remains substantial, with more than 10 million people newly diagnosed per year [1]. TB patients often have other co-morbidities that influence the disease course and outcome. For instance, diabetes mellitus (DM) has been shown to increase the risk of acquiring TB [2, 3] and progression to active disease [3, 4]. The coexistence of TB and DM (TB-DM) has been associated with a 4-fold increased risk of treatment failure and 2-fold increased risk of death [5–7]. In addition, TB-DM patients have been shown to have a higher bacterial burden, delayed sputum culture conversion and a greater risk of developing drug resistance [6, 8].
Over the next 10 years, the prevalence of DM is estimated to double globally, affecting over 600 million individuals with a considerable increase in the African continent [9–11]. While DM has long been acknowledged as an important risk factor for TB, the threat posed by the burden of these two epidemics has recently been recognised [12, 13]. It is now considered a major global public health concern by the World Health Organization (WHO) and a critical public health challenge in low- and middle-income countries, with the WHO subsequently adopting a collaborative framework for care and control of TB and DM [14].
While the burden of TB and DM co-disease is increasing rapidly, there is limited practical evidence to underpin guidelines for TB-DM patient management, such as length of treatment, drug dosing and use of therapeutic drug monitoring (TDM). Pharmacokinetics (PK) of anti-TB agents show inter- and intra-patient variability and co-morbidities may further influence plasma concentrations, as the PK of many other drugs are known to be altered in diabetic individuals [15]. DM may affect kidney function, gastric emptying and drug metabolism pathways [15, 16]. This highlights the importance of understanding drug concentrations in TB-DM population as sub-therapeutic concentrations may contribute to the treatment failure and acquired drug resistance [17].
In this systematic review, we evaluated the available evidence on the PK of antituberculosis drugs in diabetic individuals to provide in-depth analysis to guide patient management and identify priorities for research.
Methods
Search Strategy
We retrieved all original studies evaluating the effect of DM on the PK of all TB drugs recommended by the WHO for the treatment of drug-sensitive (DS) and drug-resistant TB including rifampicin (RIF), isoniazid (INH), pyrazinamide (PZA) and/or ethambutol (EMB). We systematically searched major databases; Medline, EMBASE, Web of Science and Scopus including conference abstracts from 1946 to 6th of July 2023 using Medical Subject Headings (MeSH) terms (Supplementary Material). We also manually screened the references of included original studies to obtain additional studies. To identify unpublished studies, http://clinicaltrials.gov was searched. This systematic review was conducted in accordance with the Preferred Reporting Items for Systematic Reviews and Meta-Analyses (PRISMA) statement. The protocol was registered at PROSPERO (CRD42022323566).
Study Selection
Studies that reported PK of anti-TB medications among DM and non-DM participants were included. No restrictions on language and publication date were applied. Studies in adult and paediatric populations were included. General PK studies reporting a subgroup of DM participants were not eligible unless they included detailed PK parameters for DM and non-DM participants. Review articles, letters, case reports and case series with less than five participants and correspondence were excluded, as were studies without PK data, drug interaction studies, and non-human studies.
Data Extraction
Two authors screened and retrieved articles according to the eligibility criteria and performed full text review and final article selection. From each study, the following variables were extracted: demographics of comparator group(s) and the DM group including age, weight, and sex, study design, DM diagnosis, and DM medications. Dose, dosing interval, sampling points, AUC, peak drug concentration (Cmax), half-life (t½), time to reach Cmax (Tmax), volume of distribution (Vd) and clearance (CL) were extracted from the included articles if available and were stratified by group. If these data were not reported, we also contacted the authors to request the data.
Risk of bias in included studies
In the absence of available tools to assess risk of bias in PK studies, we assessed study quality and risk of bias using the ROBINS-I tool for non-randomised studies of interventions, which wasused to assess PK studies in a recent publication [18, 19]. Any disagreements regarding grading of quality were resolved through discussion with a third author.
Analysis
Narrative synthesis of the findings was conducted and reported according to the Synthesis Without Meta-analysis (SWiM) guidelines [20]. Descriptive statistics was used to describe key outcome measures. The data were found to be too heterogenous to permit further quantitative synthesis.
Results
The systematic search identified 4173 potentially relevant articles. After removing duplicates, 3464 articles were retrieved for initial screening of which a total of 49 studies were included for full text review. After reviewing the eligibility criteria, 21 articles were included that assessed the PK of anti-TB medications among TB-DM patients [21–41]. Five included papers presented the same data: in conference abstract [42–46] and then in published form [23, 29, 33, 36, 43]; we included data from the published report. One study was only published as a conference abstract and the authors were not able to share more data at the time of this review [47]. No relevant unpublished studies were found on the ClinicalTrials.gov. The study selection process is recorded in a PRISMA flow diagram (Figure 1).
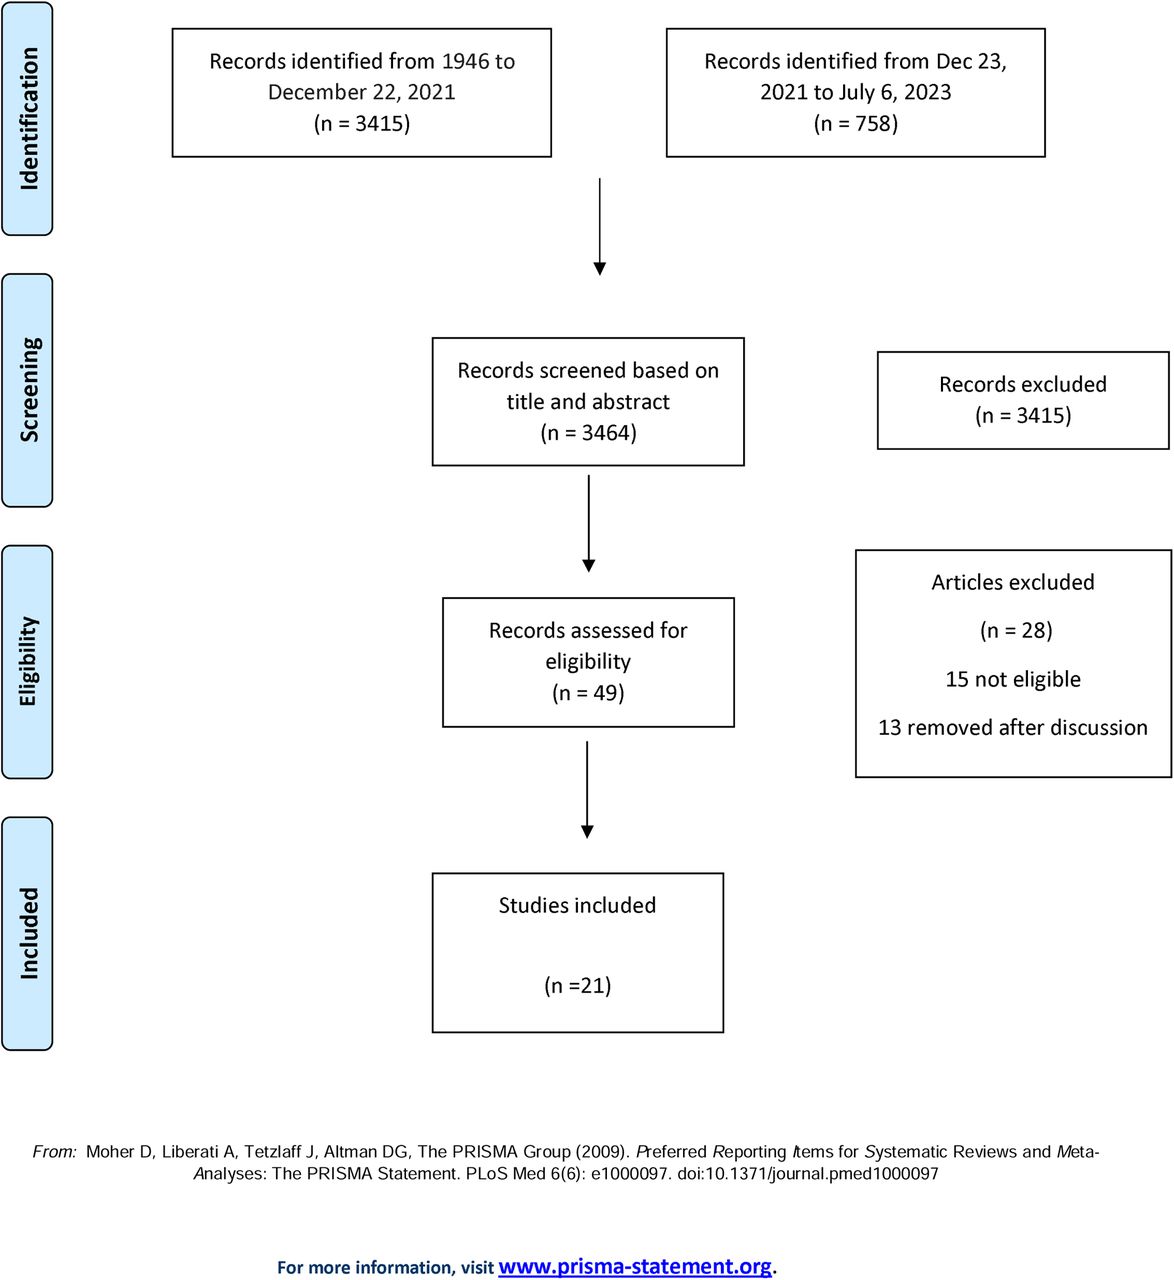
Flowchart describing study selection
Rifampicin (Table 1)
Of the 21 studies, 16 measured RIF plasma concentrations [21–23, 25, 27, 28, 30–36, 38–40], majority of which were prospective PK studies except one retrospective study reporting results based on routinely collected data [28]. RIF doses used were highly heterogeneous and are presented in Table 1.
Out of 16 studies, 7 reported AUC values; three studies with intensive sampling (> 6 samples) [31, 32, 38] reported AUC0-24 mg.h/L, three studies reported AUC0-6 mg.h/L [21, 33, 36], and one reported AUC0-8 mg.h/L [27]. In one study, AUC0-6 mg.h/L to RIF was significantly lower in patients with TB-DM compared to those without DM) [33], another study found a lower trend AUC0-24 mg.h/L in the DM group, but this was not statistically significant [32] and five studies found no difference [21, 27, 31, 34, 38]. Of the three studies carrying out intensive sampling [31, 32, 38], no significant difference was shown.
Out of 16 studies, 15 measured RIF peak concentrations (Cmax); five demonstrated significantly lower RIF peak concentrations among diabetic patients compared to non-diabetics [22, 28, 33, 39, 40] and ten studies showed no significant difference between diabetic and non-diabetic patients [21, 25, 27, 30–32, 34–36, 38]. Mean absolute RIF Cmax was below the recommended range (above 8 mg/L [48]) in diabetic and non-diabetic groups in the majority of studies, and within the recommended range only in the 3 studies with intensive sampling [31, 32, 38].
Eight studies measured the time to reach Cmax (Tmax), which was longer in TB-DM participants in three studies [31–33] (although without reaching statistical significance in one study [33]) and 3 studies found no significant difference [34, 36, 38]. In a study using population PK modelling, absorption rate constant (ka) was significantly increased and the volume of distribution (Vd) was significantly increased in the DM [23], the authors inferring that the plasma concentrations would therefore be lower in the DM group. Another study found no difference in ka or Vd between the TB and TB-DM groups in a 1 compartment model, but reduced clearance was observed and Vd was significantly higher in the TB-DM group when Vd was normalized to total body weight [31].
Raised blood glucose was inversely correlated with the rifampicin AUC/Cmax in four studies [31, 33, 39, 40], whereas three other studies found no association between HbA1c or fasting blood glucose (FBG) and plasma concentrations [25, 32, 38]. Two studies found that body weight and plasma concentrations were inversely correlated [22, 33].
Isoniazid (Table 2)
Nine studies assessed isoniazid (INH) PK [21, 22, 26–28, 30, 32, 35, 37]. Of these, one was based on routinely collected retrospective data [28], four studies used 600 mg dosing 3 times per week [21, 27, 30, 35] and only 1 study sampled intensively [32]. Four studies assessed for NAT2 status using different methods [26, 27, 32, 37]. We identified no studies with PK modelling.
Out of nine studies, four assessed the mean exposure; one AUC0-24 mg.h/L [32], two AUC0-6 mg.h/L [21, 37] and one AUC0-8 mg.h/L [27]. Of these, two studies demonstrated significantly lower mean exposure to INH [21, 32], although after adjustment for age, sex, and weight this difference disappeared in one [21]. Two studies found no significant difference between the DM and non-DM groups [27, 37]. Four studies found INH Cmax to be significantly lower in the DM group [21, 22, 30, 32], though one reported no significant difference after adjustments for age, sex, and weight [21] and the remaining 4 studies found no significant difference [26–28, 37]. One study with intensive sampling found no significant difference [32]. Out of three studies assessing Tmax, one found no significant difference in INH Tmax between the DM and non-DM group, and two studies did not report comparative analysis [27, 37].
While one study reported concentrations to be negatively correlated with blood glucose [30], in two studies INH Cmax/AUC was not correlated with FBG or HbA1c [26, 32]. In one study INH concentrations were inversely correlated with weight [22].
Pyrazinamide (Table 3)
Pyrazinamide PK was reviewed in eight studies [21, 22, 27, 29, 30, 32, 35, 38], all of which were prospective PK studies. Patients in all studies except two were on 1500 mg PZA dosing, whilst one study used 1600 mg for patients >50 kg and 1200 mg for patients <50 kg [32] and other used 20-30 mg/kg [29]. Out of eight, four papers reported mean exposure to PZA; two reporting AUC0-24 mg.h/L [32, 38], one AUC0-8 mg.h/L [27] and one AUC0-6 mg.h/L [21]. Mean exposure to PZA was significantly lower among DM participants in two studies [21, 27] and two studies with intensive sampling reported no significant difference in AUC0-24 mg.h/L [32, 38]. Out of six studies reporting Cmax three reported significantly lower Cmax among DM compared to non-DM participants [21, 27, 30], which remained significant after adjustments for age, sex, and weight [21] and three studies reported no significant difference [22, 32, 38]. Three studies measured Tmax and none reported a statistically significant difference in Tmax between the DM and non-DM TB groups.
No correlation between FBG and AUC/Cmax was observed in two studies [32, 38] whereas one study showed a negative correlation between plasma PZA concentrations and blood glucose [30]. In a population PK modelling study [29], increased apparent clearance was observed in TB-DM patients, most significantly in the group with patients >70 years and AUC0-24 mg.h/L was decreased in the DM group >70 years.
Ethambutol (Table 4)
Three included studies assessed the effect of DM on EMB PK [22, 32, 38]. Two reported AUC0-24 mg.h/L and Tmax [32, 38], all reported Cmax. None of the studies reported statistically significant difference in AUC, Cmax, and Tmax between the DM and non-DM groups. No correlation was seen between FBG and AUC/Cmax in two studies [32, 38]. We identified no studies with PK modelling.
Other agents (Table 5)
Two studies assessed the effect of DM on other agents; cycloserine [41], linezolid [41] and moxifloxacin [24]. A retrospective cross-sectional study reviewing the cycloserine and linezolid drug levels at 2 h post-dose in routine practice found that 55% of the samples had below the lower limit of recommended cycloserine plasma concentrations and 17% had low linezolid concentrations [41]. DM patients had a lower cycloserine exposure, although this was not statistically significant, and there was no association between linezolid exposure and DM. In a recent retrospective study evaluating moxifloxacin PK, AUC0–24h was shown to be significantly lower in patients with DM compared to age, sex and RIF matched TB patients without DM [24]. In line, peak and trough concentrations were also reduced in DM patients. Although the drug absorption, volume of distribution and Tmax were comparable between TB-DM and TB patients, moxifloxacin clearance was increased in TB-DM patients. Comparison of area under the unbound drug concentration–time curve/minimal inhibitory concentration (MIC) ratio indicate that exposure was already low in the majority of control patients, but none of the DM patients had adequate exposure to moxifloxacin.
Risk of bias assessment
The risk of bias for each domain across all included studies is given in Supplementary material. Prospective studies were the most common study design contributing to the review question, except three studies where routinely collected TDM was used. While all studies have made a comparative analysis between DM and non-DM population, all studies had moderate to serious risk of bias in at least one domain. There was a high risk of bias for baseline confounders that may have influenced the outcome result. For example, 11 out of 21 studies did not match DM and non-DM groups according to age or sex. Non-adjustment of host factors may influence the plasma concentrations, making it challenging to relate outcomes of the results to the effect of DM alone. In addition, while most of the patients were on anti-diabetic medications, the degree of diabetic control was not provided in the majority of studies. This highlights the challenges in studying the PK of anti-TB medications in a patient population with complex background. Importantly, there was also high risk of measurement bias in all prospective studies except three where intensive sampling was conducted. As a result, evidence quality is influenced due to confounding and imprecision, limiting our practice recommendations. Overall, the existing body of literature examining PK of anti-TB medications among DM population is of medium quality.
Discussion
This systematic review provides a comprehensive account of the impact of DM on the PK of anti-TB medications. Our findings suggest that the limited available evidence to date is highly variable. While some studies showed lower plasma concentrations of TB medications among DM patients, we observed high variability in findings and significant heterogeneity among studies including study design and differences in demographics. Therefore, no recommendation can be made.
There may be several reasons to explain this heterogeneity. Firstly, there were significant demographic differences including weight, age and DM definitions. Increased body surface area distribution and delayed drug absorption due to DM related gastroparesis and changes in expression of enzymes involved in metabolism [49, 50] are major factors that may contribute to altered PK [15, 16]. DM patients had higher weight and/or BMI compared to nondiabetic patients and some studies demonstrated a negative association between weight and plasma concentrations. The only study that matched based on weight (within 5 kg) [38] found no significant difference of RIF plasma concentrations between groups. However, matching weight is unlikely to eliminate potential biases as DM participants continued to receive capped dosing despite weight differences and were also generally older than non-DM controls.
Unclear DM definitions may also explain the variability. In many studies DM diagnosis was based on self-report. This is specifically important as self-reporting may not be accurate and secondly, TB could lead to stress-induced hyperglycaemia, which resolves after TB treatment [51]. Screenning DM at the time of TB diagnosis may result in some with transient hyperglycaemia being identified as DM. Therefore, a standard measure of DM consistently defined and reported in PK studies in line with the UNION criteria [52] would facilitate a better assessment of the plasma concentrations [53]. Nevertheless, patients with transient hyperglycaemia may also be at risk of lower plasma concentrations. For instance, in a study from Uganda, FPG was inversely correlated with RIF AUC0-24h [54]. In addition, quality of diabetes control or treatment was poorly reported in most studies, which may have influenced the results.
PK sampling methodology and analysis varied widely. Studies with a single 2 hr sampling point assume Tmax to occur at 2 hrs (Cmax). As Tmax was longer for rifampicin in some studies, studies without intensive sampling may not accurately capture the Cmax. Notably, 3 studies with intensive sampling [31, 32, 38] showed no differences in rifampicin or pyrazinamide Cmax, but a significant difference in isoniazid Cmax (27). However, it is important to note Tmax is highly variable for RIF in general [55]
Particularly affecting the isoniazid studies, dosing differed markedly, with 4 out of 9 papers using 600 mg 3 times/week, which is no longer a recommended dosing, making the comparison between the studies and the generalisation of the results more difficult. Only four out of 9 studies made any assessment of NAT2 acetylator status. As this is recognised as a key variable in isoniazid PK, this is likely to confound any other comparison of variables [56].
Plasma concentrations of TB medications may affect the clinical outcome. Zheng et al [57] showed an association between plasma concentrations of first line anti-TB drugs and culture conversion and clinical outcomes and Alfarisi et al. [21] demonstrated a positive association between time to culture conversion and INH and RIF concentrations and negatively association with PZA levels in DM patients. In another retrospective study, where all DM patients underwent TDM and dose adjustment accordingly, time to culture conversion improved significantly greater among DM patients with the post-intervention group that converted on average 19 days earlier [58].
We identified another systematic review assessing the impact of DM on the PK of rifampicin among TB patients [59]. The review included studies published up until September 2020 and identified seven studies from which pooled estimates were calculated. The same authors updated their systematic review including studies with Cmax at 2hr [60], and identified 17 studies reporting RIF plasma concentrations. Our review considers studies published up to July 2023 with a comprehensive systematic search; therefore, we were able to identify 16 papers assessing the PK of RIF.
To our knowledge, this is the first review to comprehensively examine the impact of DM on the PK of TB drugs. Our study has limitations. Firstly, we identified a limited number of PK studies among DM patients despite a comprehensive literature search. Secondly, due to the substantial study heterogeneity we were unable to pool data. Finally, we did not include general PK studies reporting on TB-DM patients as a subgroup as detailed and comparative PK parameters for DM vs non-DM patient populations weren’t available.
This review provides detailed understanding about the evidence available so far on PK of anti-TB drugs in patients with DM. There is some evidence that PK, especially among DM patients, may have clinical relevance in terms of MIC and culture conversion. However, significant heterogeneity observed in studies and the scarcity of data on clinical outcomes, it is challenging to make recommendations about dosing in the TB-DM population. Given the relationship of delayed culture conversion and relapse, clinical outcomes should be explored in future PK studies. In order to achieve definitive answers for PK in DM population, we recommend important considerations as in Table 6. Until we have further information to guide the management of TB-DM patients, TDM and dose adjustment may be beneficial in patients with DM.
Data Availability
All data produced in the present study are available upon reasonable request to the authors
Author contributions
MC and SHG conceptualized the scope of the review. MC and AS pulled the data from selected papers. All authors contributed to the final version of the manuscript and approved it for publication.
Declaration of Interests
No conflict of interests reported.
Acknowledgements
This work was supported by the Chief Scientist Office (CAF/20/03) and British Infection Association (Grant/2022/SPG/MC) received by MC.
Footnotes
This is the first systematic review to comprehensively examine the impact of DM on the pharmakokinetics of TB drugs. While some studies showed lower plasma concentrations, we observed significant heterogeneity; therefore, no recommendations can be made.


