
ABSTRACT
Background Few studies have assessed the relationship between diabetes and cognitive health outside of high-income countries. We described this relationship in India, a middle-income country of 1.4 billion people.
Methods Data were analyzed from 58,027 adults aged ≥45 years in the baseline wave of the nationally representative Longitudinal Aging Study in India, from 2017 to 2019. Outcomes were scaled cognitive scores (mean of 0 and standard deviation [SD] of 1) and cognitive impairment, defined as a cognitive score 1.5 standard deviations or below the age- and education-matched mean. Diabetes was defined as a self-report of a prior diabetes diagnosis made by a health professional or having a measured hemoglobin A1c ≥6.5% at the time of the LASI survey. To describe the cross-sectional relationship between cognitive health and diabetes, we constructed survey-weighted multivariable linear and logistic regression models controlling for prespecified covariates, including age, sex, sociodemographic characteristics, and rural versus urban residence.
Results In age- and sex-adjusted models, people with diabetes had cognitive scores that were 0.25 SD higher (95% CI: 0.23 to 0.27) and had a 1.3% (95% CI: 0.7 to 1.8) lower prevalence of cognitive impairment than people without diabetes. Differences persisted even when adjusting for demographic, socioeconomic, and geographic characteristics. Rural versus urban residence modified the relationships of diabetes with cognitive score (P = 0.001) and cognitive impairment (P = 0.004). In fully adjusted models, rural respondents with diabetes had 0.05 SD (95% CI: 0.03 to 0.07) greater cognitive scores and 1.7% (95% CI: 0.9 to 2.5) lower prevalence of cognitive impairment than those without diabetes. In urban areas, respondents with and without diabetes had similar cognitive scores and prevalence of cognitive impairment.
Conclusion Urban-rural health differences, the nutrition transition, and social conditions likely influence the observed cross-sectional relationship between diabetes and cognitive dysfunction in India, leading to different associations than previously reported in many high-income countries.
Funding National Institutes of Health, USA and the Ministry and of Health and Family Welfare, Government of India
INTRODUCTION
The burden of diabetes and dementia is influenced by powerful epidemiologic and demographic trends. The “nutrition transition” is an epidemiologic trend in which a population experiences rapid increases in the prevalence of diseases attributable to overnutrition, such as diabetes,1 while key subpopulations continue to have high levels of hunger and undernutrition. This phenomenon is referred to as the “double burden of malnutrition.”2 A “demographic transition” also has been observed in many countries around the world as gains in life expectancy and reductions in fertility shift population age structures upwards.3 This trend of population aging is expected to contribute to a substantial increase in the global burdens of dementia and diabetes.4,5 India is a lower-middle-income country of 1.4 billion people that is experiencing both epidemiologic and demographic trends. Approximately 4 million adults in India are estimated to have dementia and more than 50 million to have diabetes.4,6 These numbers are expected to rise sharply in the coming decades.4,6
High-quality longitudinal cohort studies have shown that diabetes increases risks of dementia and cognitive impairment.7-9 Proposed biological mechanisms for cognitive dysfunction among individuals with diabetes include increases in cerebrovascular disease, neurotoxicity due to hyperglycemia, changes in amyloid metabolism, and other pathways.10 Most prior research on the relationship between diabetes and cognitive health has been conducted in high-income countries, and it is unknown whether the same biological mechanisms and risk factor patterns will be observed in low- and middle-income countries where most of the world’s population resides.11 In India, for example, a few small population-based surveys have suggested that older adults with diabetes have better cognitive performance than those without diabetes.12,13 However, these studies have had limitations including small sample sizes, lack of national samples, and the absence of diabetes biomarkers.12-16 Understanding the relationship between diabetes and cognitive health in India is important. The country will become the world’s most populous nation within the decade,17 yet its population is under-represented in the global dementia evidence base. Moreover, India’s diversity makes it an ideal setting to explore the complex relationship between diabetes and cognition. An example of India’s diversity is the striking variation of diabetes and other non-communicable disease risk factors across rural versus urban areas of the country.18-20
The objective of this study was to describe the cross-sectional relationship between diabetes and cognitive health in India, using nationally representative baseline data from the Longitudinal Aging Study in India (LASI), and explore how sociodemographic characteristics such as rural and urban residence modify this relationship.
METHODS
Study design and sample
We conducted a cross-sectional analysis of baseline LASI data, collected between 2017 and 2019. We have described details of LASI in previous reports.21-23 Briefly, LASI is a nationally representative, longitudinal study of N=72,262 Indian men and women aged 45 and older and their spouses of all ages. While follow-up waves of data collection are in progress, at present only baseline LASI data are available. Comprehensive information was collected on respondents’ health, social, and economic well-being through interviews and physical assessments. The LASI sample was selected using a multistage stratified area probability cluster design using the 2011 census as the sampling frame. Respondents therefore were representative of the country of India and of 35 Indian states and union territory.
In this analysis, we restricted the sample to 56,889 participants with non-missing data on the outcomes and covariates used in this study. The response rate for blood-based biomarkers was 87.9%.21 Of note, while LASI collected data on spouses younger than 45 years of age, we excluded these individuals as they are not representative of the population.
Outcomes
Our primary outcome was cognitive performance, assessed continuously as a general cognitive score and dichotomously as cognitive impairment.
General cognitive score
We calculated general cognitive scores using a graded response item response theory model.24 To ensure optimal performance of this model, we incorporated intensive neuropsychological tests and geriatric assessments from a sub-study of 4,096 LASI respondents in the harmonized Diagnostic Assessment of Dementia for the LASI (LASI-DAD) study.25,26 Leveraging both the 11 common and 42 non-common items between LASI and LASI-DAD, we created an overall general cognitive score that is scaled to have a mean of 0 and standard deviation of 1 within the LASI-DAD population, with higher scores reflecting higher cognitive function. We assessed the precision of our score using model-estimated standard errors for each observation and observed that 97% of observations had marginal reliabilities above 70%, a level generally accepted for epidemiologic research.27 Importantly, our derived cognitive scores were not sensitive to inclusion of items dependent on literacy (correlation between scores using literacy vs. scores using non-literacy items of 0.995).
Cognitive impairment
We defined cognitive impairment as a general cognitive score that was 1.5 standard deviations or below the age- and education-matched mean for the full LASI sample. Our definition follows the updated 2011 U.S. National Institute on Aging—Alzheimer’s Association diagnostic guidelines28 and has been used in analyses of data from other studies in the Health and Retirement Study international network.29
Exposure
Diabetes was our exposure of interest. We defined diabetes as a self-report of a prior diabetes diagnosis made by a health professional or having a measured hemoglobin A1c (HbA1c) ≥6.5% at the time of the LASI survey. Our diabetes biomarker criterion is supported by the World Health Organization,30 American Diabetes Association,31 and national diabetes guidelines in India.32,33 We measured HbA1c from dried blood on the Cobas Integra 400 Plus Biochemistry analyzer (Roche Diagnostics, Switzerland). Additional details on our validated methodology for HbA1c collection, storage, and measurement using dried blood spots has been reported previously.18,34
Statistical analysis
The objective of our statistical analysis was description,35 i.e., to describe the cross-sectional relationship between diabetes and cognitive health in India, and how this relationship varied by sociodemographic characteristics such as rural or urban residence. We first calculated survey-weighted descriptive statistics in the overall sample and the sample stratified by diabetes status. Next, we estimated the distribution of general cognitive score and the prevalence of cognitive impairment by diabetes status and generated survey-weighted density plots of general cognitive scores by diabetes status.
We then constructed a series of survey-weighted multivariable linear and logistic regression models for the outcomes of general cognitive score and cognitive impairment, respectively. The two series of models included the same prespecified sociodemographic covariates chosen based on our prior research in India.12,18,36 Model 1 was unadjusted except for indicators for state. Model 2 added demographic covariates of age and sex. Model 3 added socioeconomic covariates, including education (no education, less than secondary education, and secondary education or higher), household economic status (assessed as per-capita consumption based on household expenditures), relationship status (married, widowed, separated/ divorced, or never married), and self-reported caste (scheduled caste, scheduled tribe, other backwards class, or no caste or other caste). Model 4 added area of residence (urban or rural) and an interaction between diabetes and area of residence.18 We specified continuous covariates of age and household economics status using restricted cubic splines with five knots at 5%, 27.5%, 50%, 72.5%, and 95%, as recommended by Harrell.37 We visualized the regression output using average marginal effects, which are the average difference in the model’s predicted outcome that occurs with a one-level difference in a covariate.38,39 Analyses used sample weights corrected for differences in nonresponse and accounted for LASI’s complex survey design. P values and confidence intervals were not adjusted for multiple comparisons. We used Stata version 16.1.
Sensitivity analysis
In a sensitivity analysis, we defined clinically meaningful HbA1c categories based on American Diabetes Association guidelines:40 (1) HbA1c <5.7%, which is considered in the normal range; (2) HbA1c 5.7-6.4%, which is considered in the prediabetes range; (3) HbA1c 6.5-7.9%, which is in the diabetes range with reasonably good disease control; (4) HbA1c 8.0-9.9%, which is in the diabetes range with moderate-poor disease control; and (5) HbA1c ≥10%, which is in the diabetes range with very poor disease control.
RESULTS
Sample characteristics
Characteristics of the sample are in Table 1. The sample included 58,027 middle-age and older adults, of whom 53.4% (95% confidence interval [CI]: 52.9% to 53.9%) of the weighted sample were men and 46.6% (95% CI: 46.1% to 47.1%) were women. Overall, using survey weights, 52.4% (95% CI: 52.9% to 53.9%) of respondents had no education, 28.8% (95% CI: 28.4% to 29.2%) had less than secondary education, and 18.8% (95% CI: 18.4% to 19.2%) had secondary education or higher. More than two-thirds of the weighted sample of older adults in India (67.9% [95% CI: 67.4% to 68.4%]) lived in a rural as opposed to an urban area.
The population-weighted diabetes prevalence in India based on the LASI sample was 19.8% (95% CI: 19.4% to 20.2%). Additional details of sample characteristics by diabetes status are in Supplementary Table 1.
Cognitive outcomes
Cognitive outcomes in the overall sample and by diabetes status are shown in Figure 1 and Supplementary Tables 2-3. The mean general cognitive score across the weighted sample was 0.29 (standard deviation [SD]: 0.94). Overall, 5.6% (95% CI: 5.4% to 5.9%) of individuals had cognitive impairment, as defined by general cognitive score of -1.5 standard deviations or below the age- and education-adjusted mean. The mean weighted cognitive score among people with and without diabetes was 0.48 (SD: 0.96) and 0.25 (SD: 0.93), respectively. In rural areas, mean weighted cognitive score was 0.25 (SD: 0.92) among respondents with diabetes and 0.08 (SD: 0.88) among those without diabetes. In urban areas, mean weighted cognitive score was 0.73 (SD: 0.93) among respondents with diabetes and 0.67 (SD: 0.94) among those without diabetes.

This graph depicts density plots of general cognitive scores generated using survey-weighted Epanechnikov kernel density functions with bin width of 0.5. The density within each category is normalized at 1. See Supplementary Tables 2-3 for underlying data
Multivariable regression analysis
The average marginal effects from the multivariable linear regression models for the outcome of cognitive score are presented in Figure 2A. Compared to respondents without diabetes, those with diabetes had 0.21 (95% CI 18 to 0.23) greater cognitive scores in the unadjusted model (Model 1), 0.25 (95% CI 0.23 to 0.27) greater cognitive scores in the age- and sex-adjusted model (Model 2), 0.05 (95% CI 0.03 to 0.07) greater cognitive scores in the model adding sociodemographic covariates model (Model 3), and 0.03 (95% CI 0.01 to 0.05) greater cognitive scores in the model also adjusting for area of residence and an interaction between diabetes and area of residence (Model 4).

These figures depict the average marginal effects of diabetes on general cognitive score using multivariable linear regression (panel A) and of diabetes on cognitive impairment using multivariable logistic regression (panel B). Model 1 includes only indicators for state. Model 2 added age and sex. Model 3 added sociodemographic covariates, including education, household economic status, relationship status, and self-reported caste. Model 4 added area of residence (urban or rural) and an interaction between diabetes and area of residence. Continuous covariates of age and household economics status were specified using restricted cubic splines with five knots at 5%, 27.5%, 50%, 72.5%, and 95%. The complete regression output is provided in Supplementary Tables 4-5.
The average marginal effects from the multivariable logistic regression models for the outcome of cognitive impairment are presented in Figure 2B. Compared to respondents without diabetes, those with diabetes had approximately 1% lower prevalence of cognitive impairment in all models (Figure 2B) Complete output for the are regression models is in Supplementary Tables 4-5.
Interaction between diabetes status and area of residence on cognitive outcomes
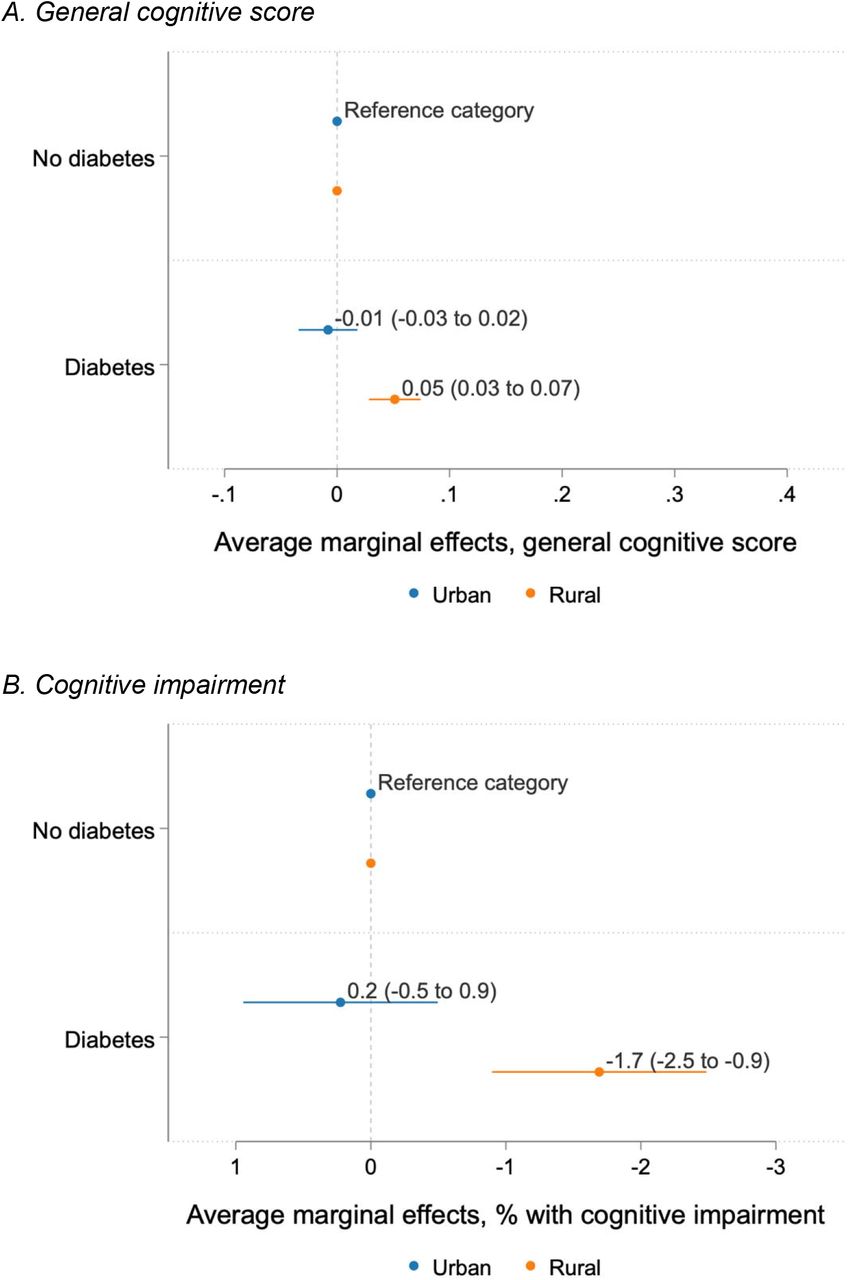
In fully adjusted models, we found evidence that rural versus urban residence modified the relationship between diabetes and cognitive score (P interaction term in Model 4 = 0.001), as well as diabetes and cognitive impairment (P interaction term in Model 4 = 0.004). In rural areas, respondents with diabetes had 0.05 (95% CI 0.03 to 0.07) greater cognitive scores and 1.7% (95% CI 0.9 to 2.5) lower prevalence of cognitive impairment than respondents without diabetes (Figure 3). In urban areas, respondents with and without diabetes had similar cognitive scores and probability of cognitive impairment.
These figures depict the average marginal effects of the interaction between diabetes status and area of residence from Model 4. Panel A refers to the multivariable linear regression of diabetes on general cognitive score. Panel B refers to the multivariable logistic regression of diabetes on cognitive impairment. Model 4 includes the following covariates: age, sex, education, household economic status, relationship status, self-reported caste, area of residence (urban or rural), an interaction between diabetes and area of residence, and indicators for state. Continuous covariates of age and household economics status were specified using restricted cubic splines with five knots at 5%, 27.5%, 50%, 72.5%, and 95%. Complete regression output is provided in Supplementary Tables 4-5.
Sensitivity analysis
In the sensitivity analysis using clinically relevant HbA1c categories rather than a dichotomous diabetes variable, the findings were generally similar to the main analysis. (See Supplementary Tables 6-8 and Supplementary Figures 1-3.) One additional observation was that, in rural areas, respondents in higher HbA1c categories appeared to have increasingly better cognitive outcomes in the fully adjusted model 4. For example, compared to rural respondents with normal HbA1c, rural respondents with HbA1c from 6.5% to <8%, 8% to <10%, and ≥10% had 1.9% (95% CI: 0.7 to 3.1), 2.9% (95% CI: 1.2 to 4.6), and 3.6% (95% CI: 2.2 to 5.0), respectively, lower probability of cognitive impairment.
DISCUSSION
In a national survey conducted in India between 2017 to 2019, we found that middle-aged and older adults with diabetes living in rural areas had better cognitive health than those without diabetes even when adjusting for a full suite of demographic, socioeconomic, and geographic characteristics. Rural versus urban area of residence modified this relationship such that rural respondents with diabetes had substantially better cognitive health than those without diabetes, while in urban areas cognitive health did not differ by diabetes status. To our knowledge, this study is the largest and first nationally representative study in India that has reported the relationship between diabetes and cognitive health.
Our study builds on prior research in India showing that the relationship between diabetes and cognitive health in India differs from that observed in high-income countries where diabetes is often associated with higher risks of cognition dysfunction and dementia.7-10 In India, a recent study assessing potentially modifiable risk factors for dementia and cognitive function used data from three cross-sectional surveys conducted between 2003 to 2010 (10/66 Dementia Research Group survey, Study of global AGEing [SAGE], and LASI pilot survey),13 each with 2,500 or fewer individuals from between one and four Indian states. While much smaller than the present analysis, this prior study similarly found that individuals with self-reported diabetes had better cognitive performance in two of the three surveys. Another recent study used data from the Longitudinal Aging Study in India–Diagnostic Assessment of Dementia and the U.S. Health and Retirement Study–Harmonized Cognitive Assessment Protocol (HRS-HCAP), which are dementia-focused substudies of LASI and HRS, respectively,12 also found that HbA1c was independently associated with better cognition in India and worse cognition in the U.S. Several other studies have assessed the diabetes-cognition relationship in India but have tended to be limited by small convenience samples.14-16 Notably, while few prior studies have assessed diabetes and cognitive health in other low- and middle-income countries, prior research from Mexico41,42, China43,44, and Brazil45 have tended to show associations more similar to high-income countries than our results from India.
Given that our data are cross-sectional, we are unable to explore longitudinal relationships or causal mechanisms underlying our findings. Future waves of data collection in LASI will permit such analyses. Nevertheless, our study is useful as population-based descriptive research to guide health policy and as hypothesis generation for future research. From a health policy perspective, our findings enhance understanding of current epidemiologic patterns in India where 50 million adults age 45 years or older have diabetes18 and 4 million adults have dementia.4 The 2017 National Health Policy in India has a strong focus on improving diabetes primary care, yet it is useful for policymakers and clinicians to consider that the cognitive health of people with diabetes differs from those without diabetes.
From a hypothesis-generation perspective, our findings suggest that there are complex factors influencing the interplay between diabetes and cognitive dysfunction in India that may differ from factors observed in other countries. Our leading hypothesis is that many populations in India are at a stage in the nutrition transition where increases in living standards cause increases in diabetes prevalence through consumption of processed foods, sedentarism, and shifting work patterns.1 In contrast, in high-income countries, many populations with high living standards revert to diet and lifestyle patterns that are protective against diabetes. According to this hypothesis, diabetes (and higher glycemic levels generally) serves as a proxy marker for greater socioeconomic status in India, and there may be residual confounding between diabetes and cognitive health despite our attempts to control for a wide suite of sociodemographic covariates.
Another possibility is that there is a selective survival bias in India contributing to the diabetes-cognition association observed using cross-sectional data. Specifically, this analysis includes individuals with prevalent diabetes who survived to the time of the survey, and these individuals may have unmeasured, protective characteristics for maintaining cognitive health.46 Given differences in life expectancy and access to health care between urban and rural regions, differences in the probability of survival among people with diabetes could lead to the observed urban-rural differences in the diabetes-cognition associations. Selective survival bias in the context of the diabetes-cognition association in India requires further investigation.
One potential explanation for the divergent findings by area of residence is that people with diabetes in urban versus rural areas have a different prevalence of diabetes subtypes that make them more predisposed to certain complications such as cognitive dysfunction. A substantial body of prior research shows that people with diabetes in India have different biological and demographic characteristics than those observed in high-income countries. For example, a study using medical records from a large network of diabetes specialty centers found that Indian patients with type 2 diabetes had different clusters of diabetes phenotypes than found in Western populations.47 One of the novel Indian subtypes of diabetes was characterized by both insulin resistance and insulin sensitivity. This subtype was associated with a very high clinical risk for developing microvascular diabetes complications in the form of kidney disease.47 While cognitive outcomes were not assessed in this study, it is interesting to consider whether these novel phenotypes might also contribute to biological pathways that predispose some Indians to cognitive decline.
Given that one of every seven people with diabetes worldwide lives in India, there is intense interest in exploring pathways and subtypes of diabetes in the country.48 One pathophysiologic hypothesis that remains under-studied in India and globally is the relationship between early-life undernutrition and adult development of cardiometabolic diseases such as diabetes, referred to as the “double burden of malnutrition.”49 Early-life undernutrition, which remains highly prevalent in India, may establish metabolic set points that make these individuals susceptible to diabetes as the nutrition transition generates a more obesogenic food environment.1,50 LASI’s future waves of data collection have the potential to substantially advance the understanding of diabetes and its complications, including cognitive dysfunction, given LASI’s large national sample including many participants recruited from rural areas, which differs from most prior epidemiologic studies of diabetes in India that have focused on urban populations.
Our study has several strengths. LASI used rigorous survey methodology with respondents from all Indian states and union territories, permitting us to make inferences from a large, nationally representative sample. Data were also collected relatively recently (2017 to 2019), which is an important advantage given that India is undergoing rapid shifts in nutritional outcomes, population aging, and urbanization. Our cognition measure was calibrated with a rich battery of neuropsychological tests administered in LASI-DAD, which are harmonized to those used in the HRS-HCAP and its international network of HCAP studies. A final strength is that we were able to incorporate a blood-based diabetes biomarker, HbA1c, into our definition of diabetes.
Our study also has limitations. First, while we attempt to control for a suite of sociodemographic covariates in our multivariable models, there is potential for selection bias in our definitions of diabetes exposure (diabetes diagnosis or HbA1c ≥6.5). Specifically, as health care access is limited in India, individuals who report a diabetes diagnosis might have distinct socioeconomic characteristics compared to those who do not report a diabetes diagnosis, and these differences are not fully accounted for using HbA1c criterion. Second, as our analysis used cross-sectional data, we did not capture incident diabetes or cognitive impairment and therefore are limited in our ability to make causal inferences or analyze mechanistic pathways between diabetes and cognitive health. Third, our outcomes of cognitive health were dependent on a summary cognition score, and we did not assess specific cognitive domains such as memory, executive functioning, or language. Fourth, it is possible that survey questions used to generate the summary cognitive measure may elicit subtly different responses across languages.26 At the same time, the LASI instrument was carefully translated and implemented in 16 regional languages, and our prior analysis of LASI-DAD data revealed similar performance across languages. Finally, while our use of HbA1c was an important strength in this study, measurement variations are possible given that we used a dried blood protocol rather than the gold standard of venous collection.
In conclusion, we found that urban-rural differences in health and social conditions likely influence the observed cross-sectional relationship between diabetes and cognitive dysfunction in India, leading to different associations than observed in many high-income. Given rapid and ongoing shifts in nutrition and population aging in India, our findings show the need for future research to assess pathways underlying patterns of diabetes and cognitive outcomes in this setting.
Data Availability
LASI data used in this study, with the exception of DBS biomarkers, are publicly available on the websites of the Gateway to Global Aging (https://g2aging.org/) and International Institute for Population Sciences (IIPS; https://www.iipsindia.ac.in/content/LASI-data). DBS biomarkers will be made public after data are approved for release by the Ministry of Health and Family Welfare, Government of India. To access data, users must register, provide an email address, and sign a data use agreement.
Contributors
Conceptualization: DF, JL, KML. Data curation: HG. Formal analysis: DF, HG. Funding acquisition: DB, JL, TS. Methodology (cognitive scores): ALG. Administration: CRW. Visualization: DF, HG. Writing, original draft: DF. Writing, review, and editing: HG, ALG, DAL, JL, CRW, KML.
Funding
LASI data collection was funded by the National Institute on Aging, National Institutes of Health (NIA/NIH), U.S.A. (R01AG042778); the Ministry of Health and Family Welfare, Government of India (T22011/02/2015-NCD). The NIA/NIH provided funding for a nationally representative sample, drawing samples from the 15 largest states. The Government of India provided additional funding to make the study representative of each state and union territory and enable oversampling of older adults and four metropolitan cities. LASI data processing was funded by the National Institute on Aging, National Institutes of Health (NIA/NIH) (R01AG030153). LASI-DAD data collection was funded by the National Institute on Aging, National Institutes of Health (NIA/NIH), U.S.A. (R01AG051125, U01AG065958). The preparation of this paper was supported by the NIA/NIH (RF1AG055273) and by the National Heart, Lung, And Blood Institute of the NIH under Award Number K23HL161271. The funders had no role in study design, data collection and analysis, decision to publish, or preparation of the manuscript. The content is solely the responsibility of the authors and does not necessarily represent the official views of the NIH.
Competing interests
We declare no competing interests.
Ethical approval
LASI obtained approval from the University of Southern California Institutional Review Board (IRB) (UP-CG-14_00005), the Harvard University IRB (CR- 16715- 10), the International Institute for Population Sciences IRB (Sr. No. 12/1054), and Health Ministry’s Screening Committee clearance from the Indian Council of Medical Research (F.No.T.21012/07/ 2012-NCD).
Data sharing
LASI data used in this study, with the exception of DBS biomarkers, are publicly available on the websites of the Gateway to Global Aging (https://g2aging.org/) and International Institute for Population Sciences (IIPS; https://www.iipsindia.ac.in/content/LASI-data). DBS biomarkers will be made public after data are approved for release by the Ministry of Health and Family Welfare, Government of India. To access data, users must register, provide an email address, and sign a data use agreement.
Acknowledgements
We thank Dr. Peifeng Hu, Dr. Alan Potter and Mr. Jake Cofferen for supporting the dried blood spot validation study, Ms. Varsha Kale for carrying out DBS dried blood assays, Dr. Marco Angrisani for constructing sample weights, Dr. Erik Meijer for imputing missing cognitive values, and all LASI and LASI-DAD team members and collaborators for their contribution to the wave 1 LASI and LASI-DAD data collection.
REFERENCES


