
Abstract
Background Identifying optimal COVID-19 policies is challenging. For the state of Victoria, Australia (6.6 million people), we ranked 44 policy packages: two levels of stringency of public health and social measures (PHSMs); the provision of respirators during infection surges; and 11 vaccination schedules (including current and next-generation COVID-19 vaccines) in the context of 64 potential future SARS-CoV-2 variants (combinations of transmissibility, virulence, immune escape capacity and incursion date).
Methods We used an agent-based model to estimate morbidity, mortality, and costs over an 18-month period beginning 1 April 2022 for each scenario. Policy options were ranked on cost-effectiveness (health system only and health system plus GDP perspectives), deaths and days exceeding hospital occupancy thresholds.
Results The median number of infections across the 44 policies was 6.2 million (range of medians 5.4 to 7.1 million). Higher stringency PHSMs ranked better from a health system perspective, but not a health system plus GDP perspective. The provision of respirators had minimal impact. Vaccinating all age groups was superior to both no further vaccination and targeted vaccination of individuals aged ≥60 years. The optimal combined policy was the rollout of a multivalent vaccine to all age groups with higher stringency PHSMs and no respirator provision.
Conclusions This integrated epidemiologic and economic model provides a framework within which to systematically compare the health and economic benefits and costs of pandemic interventions while accounting for SARS-CoV-2 evolution and dynamic population immunity. It underscores the value of ongoing widespread vaccination and PHSMs in mitigating future COVID-19-related morbidity and mortality.
Introduction
The COVID-19 pandemic is well into its third year, with ongoing high levels of SARS-CoV-2 transmission driving significant morbidity and mortality globally.1 This is due in part to the emergence of variants, such as Omicron, that possess enhanced innate transmissibility and/or the capacity to evade pre-existing immunity. Continued SARS-CoV-2 evolution is likely,2 now occurring against a backdrop of dynamic population immunity (from vaccination, natural infection, or both) and an expanding array of public health and clinical intervention options. As such, COVID-19-related policy decisions must be made in the context of substantial uncertainty, a significant challenge for policy makers. In this complex environment it is increasingly important that the benefits and drawbacks of interventions are rigorously and systematically compared – including from a cost effectiveness perspective.3
In response to these needs we developed an integrated epidemiologic and economic simulation model to determine the optimal of 44 illustrative policy packages (two stringency levels of public health and social measures [PHSMs], two respirator provision policies, and 11 vaccination schedules) for the state of Victoria, Australia, applied between April 2022 and September 2023. Each policy was modelled in the context of 64 future SARS-CoV-2 variant scenarios: low or high virulence, low or high innate transmissibility, antigenic similarity to the Omicron variant and associated immune escape capacity, and four dates of new variant incursion. Policies were then ranked based on cumulative deaths, hospital occupancy, and cost effectiveness from both health system and health system plus gross domestic product (GDP) perspectives, providing a framework for assessing optimal pandemic policy in the face of a rapidly evolving and uncertain future.
Methods
Agent-based model
We used an agent-based model (ABM)4 with a daily cycle length and 2,500 agents that are scaled up to represent the Victorian population. Each agent moves in a two-dimensional space, creating opportunities for infection informed by parameters that influence viral transmission (Table 1, Appendix section 1). This model was initially calibrated to the first COVID-19 waves in Australia and New Zealand and has previously been used to inform policy in Victoria.5 For this study, it was further calibrated to the Victorian experience in April and May of 2022. Beginning in April 2022, each of 2,816 scenarios (44 policies and 64 variants) were run 400 times (100 iterations of separate draws of input parameters, each run four times to dampen stochastic variation), to generate estimates of COVID-19-related morbidity, mortality and costs over 18 months.
Modelled scenarios
Policy options
Five stages of PHSMs were specified (Supplementary Table 1). Stages incrementally impose more restrictions up to stage 5, which approximates a lockdown. The ABM (de)escalates through these stages based on hospital occupancy thresholds and two PHSM policy options (higher and lower stringency; Table 1). We modelled two respirator (e.g., N95 mask) policies – no respirator provision, or the maintenance of a respirator stockpile that is distributed to the population for use if in stage 3 or higher. Eleven future vaccine schedules were modelled, including currently available mRNA vaccines as well as next-generation vaccines specifically targeting the Omicron variant or targeting several variants (multivalent vaccines). The effects of administering these vaccines to the general population or individuals aged ≥60 years were modelled separately. The multivalent vaccine was specified to have twice the vaccine effectiveness (VE; on an odds scale) of current mRNA vaccines against all variants, and the Omicron-targeted vaccine twice the VE for variants antigenically like Omicron (Appendix section 2).
Variant scenarios
Four dates of variant arrival were specified, approximating the beginning of July and October 2022 and January and April 2023. The intrinsic transmissibility of variants was set as either an R0 of 11 (approximating Omicron BA.26, range 10 to 12) or 14 (range 13 to 15). New variants were characterized as either low (approximating Omicron) or high virulence. To set the low virulence infection fatality risk (IFR), we scaled age-specific IFRs associated with the ancestral variant7 to match deaths observed in Victoria in April and May 2022 (an Omicron BA.2-dominant period), taking into account previous infection and vaccination. This process was repeated using hospital and ICU admission risks.8 We assumed 4, 40.75, 40.5 and 40.25 ratio differences in IFR, ICU admission risk, hospital admission risk and probability of being symptomatic given infection, respectively, between high and low virulence variants.
Immune escape capacity of variants was set as nil, moderate or high using odds ratios (ORs) applied to VE estimates (Appendix section 2). Each new variant was allowed one of two levels of immune escape depending on its antigenic similarity to the Omicron variant and its innate transmissibility. For example, variants with an R0 of 11 would likely require moderate or high immune escape to have a selection advantage over the current Omicron variant given similar innate transmissibility.
Vaccine effectiveness and protection against reinfection
Protection following vaccination or previous infection was a function of age, time since last vaccine or infection, the number and type of vaccine doses received, and the variant responsible for primary infection, based on a previously published model of VE (Appendix section 3).9
Morbidity and mortality
We quantified acute COVID-19 morbidity using disability rates (DRs) from the Global Burden of Disease (GBD) study.10 Morbidity was calculated separately for high and low virulence variant infections by altering the duration of illness and length of hospital stay.11,12 Morbidity from long COVID was estimated based on reported symptoms and their prevalence and duration (by age, severity of infection, vaccination status, and viral variant), each assigned a disability weight from the GBD study.10,13-16 For each COVID-19 death we estimated future HALY loss (discounted at 3%), assuming people dying of COVID-19 have twice the mortality and 1.5 times the morbidity of the average person of the same sex and age (Appendix section 4).
Economic analyses
We used a net monetary benefit (NMB) approach where total net health expenditure was subtracted from monetized HALYs at a given willingness to pay (WTP; Australian GDP per capita [AUD 70,000 = USD 50,000] per HALY unless otherwise specified) in each model iteration, with two perspectives considered – health system only, and health system plus GDP loss (Appendix section 5).
For acute illness we applied unit costs to each agent depending on their infection and clinical outcome status, including for testing, medication, ambulatory care, and hospital costs. We also determined healthcare utilisation costs for those experiencing long COVID based on international data and Australian clinical guidelines,17,18 stratified by acute disease severity, variant virulence, and vaccination status. Interventions were costed using the unit costs of vaccines and respirators, in addition to transportation, storage, vaccine administration, respirator distribution and health promotion costs. Future reduced health expenditure due to deaths was estimated using an approach similar to that for future HALY losses, where expected health system savings (discounted at 3%) were allocated to each remaining life year lost. Costs to society due to PHSMs were assumed to be nil for stages 1 and 2, and 10% to 50% of the Australian Government-estimated GDP losses per week from 202019 for stages 3 to 5 (Table 1).
Ranking
We ranked each policy option, averaged over all variant scenarios, by: (a) the cumulative number of SARS-CoV-2 deaths over 18 months, (b) the number of days hospital occupancy by COVID-19 patients was >750 (114 per million) or >1500 (227 per million), (c) NMB from a health system perspective, and (d) NMB from a health system plus GDP perspective. We then generated an average ranking across these four dimensions.
Uncertainty and sensitivity analyses
We generated tornado plots showing the variation in model outputs when comparing the lowest and highest quintiles of key input parameters. Additionally, we re-ran the ABM for 12 rather than 18 months and used an alternative discounting approach recommended by the UK Treasury20 (1.5% for HALYs and 3.5% for costs).
Results
Health and cost impacts of modelled policies
Figure 1 shows cumulative infections, hospitalisations and deaths over 18 months for all policies, with each box plot depicting the median, interquartile and 90th percentile ranges and outliers across all SARS-CoV-2 variant scenarios. Across the 44 policies the median number of infections, hospitalisations and deaths were 6.2 million (range of medians 5.4 million to 7.1 million), 29,597 (25,301 to 41,525), and 4,671 (4,062 to 7,711) respectively. There was substantial variation across the SARS-CoV-2 variant scenarios, such that, for example, mean total infections across all 2,816 policy-by-variant scenarios ranged from 4.2 to 8.9 million.

The mean across 100 Monte Carlo simulations for each of the 64 SARS-CoV-2 scenarios within each stratum of the 44 policy options was calculated. These whisker plots show the median, interquartile range, 90th percentile range and outlier values of the means of the 64 scenarios for each of the 44 policy options. *indicates that vaccines are administered to all age groups. CG: current generation vaccine; OT: Omicron-targeted vaccine; MV: multivalent vaccine.
Hospitalisations and deaths were least for vaccination of all age groups, intermediate for vaccinating only those aged ≥60 years, and highest for nil further vaccination. Total infections were greater when vaccinating only ≥60-year-olds compared to vaccination of all age groups and nil further vaccination. Higher compared to lower stringency PHSMs were associated with fewer infections, hospitalisations and deaths. Respirator provision only modestly reduced these outputs.
Figure 2 shows HALYs lost, net health expenditure and GDP loss. HALY losses show similar patterns to hospitalisations and deaths. Net health expenditure was least when no further vaccines were provided, and highest when vaccinating all age groups. Net health expenditure was also higher with the provision of respirators, in contrast to this policy’s modest effects on morbidity and mortality. GDP losses varied widely across the SARS-CoV-2 variant scenarios and were considerably greater for higher stringency compared to lower stringency PHSM strategies.

The mean across 100 Monte Carlo simulations for each of the 64 SARS-CoV-2 scenarios within each stratum of the 44 policy options was calculated. These whisker plots show the median, interquartile range, 90th percentile range and outlier values of the means of the 64 scenarios for each of the 44 policy options. Net health expenditure is made up of three components: costs of implementing interventions; health expenditure on acute and long COVID for infections occurring in the 18-month period modelled; and unrelated future health expenditure changes (reduced health expenditure for decedents). See Supplementary Figure 3 for a breakdown of these costs. *indicates that vaccines are administered to all age groups. CG: current generation vaccine; OT: Omicron-targeted vaccine; MV: multivalent vaccine.
Time spent in stages ≥3, the number of days in which hospitals had >750 or >1500 COVID-19 patients admitted, NMB and health expenditure are illustrated in Supplementary Figures 1 to 3. The distribution of NMB from a health system perspective was generally higher (i.e., more cost effective) for policies not including respirator provision but varied minimally between vaccination schedules. The median number of days with high hospital occupancy was greater for lower stringency PHSM strategies and nil further vaccination. Heat maps for all scenarios are shown in Supplementary Figures 4 to 11, illustrating the influence of specific variant characteristics such as virulence on key model outputs.
Optimal ranking using net monetary benefit, hospital occupancy and deaths
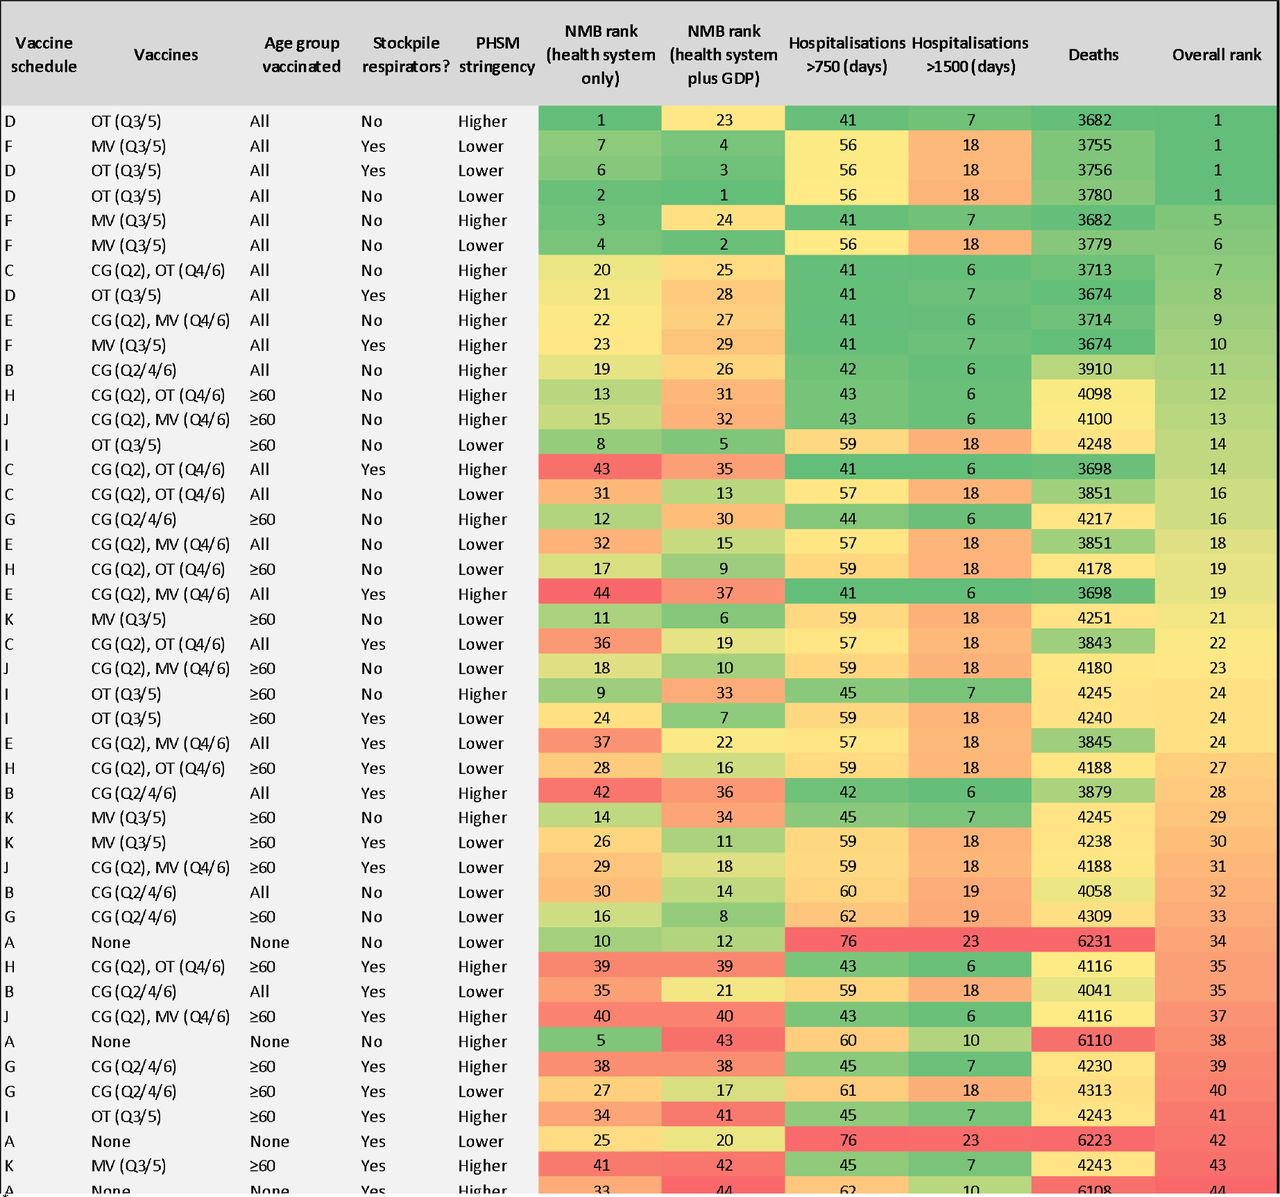
Figure 3 presents policies ranked by NMB from health system and health system plus GDP perspectives, high hospital occupancy, and deaths. The optimal policy was the rollout of a multivalent vaccine (in quarters three and five of the 18 months modelled), in combination with higher stringency PHSMs and no respirator provision. Rankings in Figure 3 consider each of the 64 future SARS-CoV-2 variant scenarios equally likely; Figure 3 can be reproduced using alternate weighting of variant characteristics in an accompanying online tool.21

†Using a 3% discount rate for both HALYs and costs. This ranking used sequential net monetary benefit (NMB) analyses, whereby the proportion of times each of the 44 policy options had the highest NMB across the 100 iterations (i.e. pooling the 64 SARS-CoV-2 strata, meaning they were equally weighted in likelihood) was determined. The top ranked policy was selected and put aside. The remaining 43 policies were re-analyzed, the now remaining top-ranked policy identified and put aside. This ranking was repeated 43 times until there was only one (least optimal) policy left.
‡For deaths and days with hospitalisations > 750 and >1500, the same analytical procedure was used for this figure as in Figure 1 and Figure 2.
€For each of the 44 policies the average rank of the ranking according to (a) NMB from a health system perspective, (b) the ranking according to NMB from a health plus GDP system perspective, (c) the ranking of the average of the ranking of days with >750 and > 1500 people in hospital, and (d) the ranking of deaths was calculated. Note, this inherently weights these four constructs equally in selecting the overall optimal policy; different decision makers wish to apply different weights across these four metrics.
For vaccine schedule key see Figure 1. CG: current generation vaccine; OT: Omicron-targeted vaccine; MV: multivalent vaccine. Quarters (Q) referenced refer to quarters of the 18-month period modelled beginning in April 2022.
Figure 4 ranks optimal policies over a 12-month period for a SARS-CoV-2 variant that is antigenically like Omicron with low virulence, additional immune escape capacity and an R0 of 11, emerging in July 2022; four policies rank equal first, three of which include an Omicron-targeted vaccine (with the first dose rolled out in October to December 2022) administered to all age groups. Of note, these were superior to current generation vaccine boosters rolled out in July to September 2022 (coincident with arrival of the new variant) followed by Omicron-targeted vaccines administered in January to March and July to September 2023.

*low virulence, R0 = 11, antigenically Omicron-like with immune escape capacity, incursion 91 days into model run (approximating BA.4/BA.5)
†Using a 3% discount rate for both HALYs and costs. This ranking used sequential net monetary benefit (NMB) analyses, whereby the proportion of times each of the 44 policy options had the highest NMB across the 100 iterations was determined. The top ranked policy was selected and put aside. The remaining 43 policies were re-analyzed, the now remaining top-ranked policy identified and put aside. This ranking was repeated 43 times until there was only one (least optimal) policy left.
‡For deaths and days > 750 and >1500, we used the mean of the metric across the 1000 Monte Carlo simulations for each of the 44 policy option strata.
€For each of the 44 policies the average rank of the ranking according to (a) NMB from a health system perspective, (b) the ranking according to NMB from a health plus GDP system perspective, (c) the ranking of the average of the ranking of days with >750 and > 1500 people in hospital, and (d) the ranking of deaths was calculated. Note, this inherently weights these four constructs equally in selecting the overall optimal policy; different decision makers wish to apply different weights across these four metrics.
For vaccine schedule key see Figure 1. CG: current generation vaccine; OT: Omicron-targeted vaccine; MV: multivalent vaccine. Quarters (Q) referenced refer to quarters of the 18-month period modelled beginning in April 2022 – given this figure refers to a 12-month period, vaccines are only administered up to Q4.
Sensitivity analyses
Using UK Treasury-recommended discount rates resulted in minimal changes in policy ranking (Supplementary Figure 12). Valuing HALYs at AUD 35,000 (Supplementary Figure 13) saw vaccine schedules targeting ≥60-year-olds increase in rank; valuing HALYs at AUD 140,000 (Supplementary Figure 14) resulted in respirator stockpiling combined with a multivalent vaccine and higher stringency PHSMs becoming the most optimal. Supplementary Figure 15 indicates that uncertainty regarding the rate of waning immunity following infection drives the greatest amount of uncertainty in infections, hospitalisations, deaths, NMB and days in stages ≥3 estimated by the model.
Discussion
A growing number of recent publications integrate economic evaluation with epidemiologic modelling in an attempt to facilitate decision making in the context of the COVID-19 pandemic.22-24 None, however, have examined combined interventions, accounted for SARS-CoV-2 evolution, accurately represented waning immunity, included both acute COVID-19 and long COVID morbidity, and integrated comprehensive economic considerations into their analyses simultaneously. This limits their present and future utility, given the emergence of SARS-CoV-2 variants, dynamic population immunity, and expanding intervention options necessitating prioritization. Decision makers increasingly require frameworks to systematically weigh up the costs and benefits of pandemic policy choices.25
This study models over 2,800 future possibilities. Irrespective of the mitigation policies implemented, our findings suggest that significant ongoing pandemic-related morbidity and mortality should be expected in the coming months and years. Within this context, however, our model generates several important policy-relevant findings. Firstly, we found that higher stringency PHSMs tended to perform better when outcomes were assessed from a health system perspective, but this was often in conflict with findings when GDP losses were considered. This makes explicit the tension between protecting public health and protecting the economic interests of society at this stage of the pandemic. Secondly, the provision of respirators to the public (to use as an alternative to surgical or cloth masks) had less of an effect than may have been expected. In our analysis we increased respirator use from 20% to 80% of mask-wearers when there were surges of infection but did not alter the overall proportion of people using masks. The potential for respirators to have a significant effect was likely reduced by agents remaining at home (where masks are not used) during large outbreaks, and the very high innate transmissibility of modelled SARS-CoV-2 variants. The latter may make it challenging for face masks to reduce total cumulative infections in the longer term, despite the significant protection against infection that they afford at the individual level.26,27
Third, the provision of any vaccine was more beneficial than not providing boosters. Our results suggest that next-generation vaccines targeting multiple variants may have an increasingly important role to play in the pandemic response. Importantly, vaccinating people of all ages appeared to be more optimal than targeted vaccination of older age groups. In fact, targeted vaccination of individuals ≥60 years old counter-intuitively resulted in more infections than not providing any further vaccinations at all. This was likely because (de)escalation between stages of PHSMs was modelled based on health service pressure; if only older individuals were vaccinated, the total number of infections could be considerably higher for the same hospitalisation load.
Our primary analyses considered policy performance across 64 equally likely future variant scenarios. If a future variant can be specified, the optimal policy changes. For example, when considering only the emergence of a single variant similar to BA.4/BA.5, three of the four most optimal scenarios included an Omicron-targeted vaccine rolled out in October to December 2022 and April to June 2023, despite the variant arriving in July 2022. These policies were more optimal than administering a current generation vaccine in July to September 2022 (coinciding with variant emergence), then boosting with Omicron-targeted vaccines six and 12 months later.
We assumed that Omicron-targeted vaccines would have twice the VE on the odds scale against Omicron BA.1/BA.2 (and antigenically similar variants) compared to current generation vaccines (equivalent, for example, to increasing peak VE against any infection from 52% to 68% or against death from 97% to 98%), the same waning kinetics, and 25% higher cost. It is critical that better estimates of expected VE and waning (e.g., based on in vitro antibody titers or rapidly conducted real-world VE studies) as well as costs of incipient next-generation vaccines are generated and shared to better inform policy. This case study highlights that flexible and well-designed models may be useful tools for tailoring vaccination strategies in future, if linked to comprehensive surveillance systems monitoring SARS-CoV-2 variant emergence and circulation (which currently have limited coverage globally)28 and rapidly responsive vaccine production and distribution infrastructure.
In comparison to similar models our framework has many advantages. We simulated combined interventions to reflect the fact that policy choices are not made in isolation, modelled viral evolution, developed a novel method to quantify long COVID morbidity, and accounted for acute COVID-19, long COVID and intervention costs in addition to future health expenditure and the economic consequences of PHSMs. Uniquely, our model also includes a data-driven representation of waning protection following vaccination, previous infection, or both, in contrast to most previously published COVID-19 transmission models.29,30 While there are substantial gaps in the COVID-19 literature (e.g., regarding the risk and symptom profile of long COVID, the waning kinetics of vaccine- and natural infection-derived immunity, and the effect of immunity on onward transmission once infected), we incorporated generous uncertainty in model inputs, reflect the impact of uncertainty in our results, and still find important differences in optimal policies.
Restricting the emergence of a new variant to once within an 18-month period is a limitation of this study. Future model iterations should include options for multiple new variant incursions over time, and include sequelae other than the long COVID symptoms accounted for here (e.g., post-acute cardiovascular complications of COVID-19) as this evidence base improves.31 Finally, a limited number of policy options were considered. It is important to recognise that minor adjustments in these policies (e.g., decreasing the baseline use of masks or altering vaccine schedules) could significantly alter the results.
Decision making during the COVID-19 pandemic is challenging and requires consideration of the costs and benefits of interventions in an increasingly complex policy environment. This model demonstrates that in the absence of, for example, a new vaccine associated with substantially less VE waning or improved neutralising protection against infection, the health system in Victoria – and similar jurisdictions internationally – should be prepared for significant ongoing COVID-19-related morbidity and mortality over the next 18 months. It reaffirms the importance of regular COVID-19 vaccination and PHSMs in the pandemic response. Crucially, it provides a framework that can be rapidly updated to systematically compare the health and economic benefits and burdens of COVID-19 policy options despite a highly uncertain future.
Data Availability
Data produced in the present study may be available upon reasonable request to the authors
Acknowledgements
We acknowledge funding from an anonymous philanthropist and the contributions of collaborators to earlier versions of our modelling that this paper builds on (Nathan Grills, Laxman Bablani, Patrick Abraham, Natalie Carvalho, Edifofon Akpan, Mark Stevenson, Rod McClure, and Nick Wilson). We also acknowledge the work of Kirsti Hakala Assendelft, Courtney Gee, Samantha Grimshaw and Zainab Albadri for assistance with data collection, Shania Rossiter for editing assistance, and Quentin Grafton and Tom Kompas for assistance with estimating GDP losses. This research was supported by The University of Melbourne’s Research Computing Services and the Petascale Campus Initiative.
Footnotes
Funding: an anonymous philanthropic donation and strategic University of Melbourne funding.
References


