
Abstract
Background The Coronavirus Disease 2019 (COVID-19) pandemic has highlighted an urgent need to use infection testing databases to rapidly estimate effectiveness of prior infection in preventing reinfection (PES) by novel variants of the severe acute respiratory syndrome coronavirus 2 (SARS-CoV-2).
Methods Mathematical modeling was used to demonstrate the applicability of the test-negative, case-control study design to derive PES. Modeling was also used to investigate effects of bias in PES estimation. The test-negative design was applied to national-level testing data in Qatar to estimate PES for SARS-CoV-2 infection and to validate this design.
Results Apart from the very early phase of an epidemic, the difference between the test-negative estimate for PES and the true value of PES was minimal and became negligible as the epidemic progressed. The test-negative design provided robust estimation of PES even when PES began to wane after prior infection. Assuming that only 25% of prior infections are documented, misclassification of prior infection status underestimated PES, but the underestimate was considerable only when >50% of the population was ever infected. Misclassification of latent infection, misclassification of current active infection, and scale-up of vaccination all resulted in negligible bias in estimated PES. PES against SARS-CoV-2 Alpha and Beta variants was estimated at 97.0% (95% CI: 93.6-98.6) and 85.5% (95% CI: 82.4-88.1), respectively. These estimates were validated using a cohort study design.
Conclusions The test-negative design offers a feasible, robust method to estimate protection from prior infection in preventing reinfection.
Introduction
Estimating effectiveness of prior infection in preventing reinfection (PES) is essential to understand the epidemiology of a given infection. Various studies have estimated PES for severe acute respiratory syndrome coronavirus 2 (SARS-CoV-2) variants.1-9However, there are challenges in estimating PES using conventional epidemiologic study designs. Such designs require extensive, complete electronic health records to be feasible. Vaccination scale-up makes it difficult to disentangle immunity induced by prior infection from that induced by vaccination. Even when it is feasible to apply conventional designs, estimates can be prone to strong bias, due to misclassification of prior infection status, since many prior infections are not documented.10-13 Effects of this bias increase with increased cumulative infection exposure in the population.14 Recent emergence of the Omicron15 (B.1.1.529) variant emphasized the need to estimate PES immediately for this variant.
Here, we demonstrate a robust, practical method to estimate PES using a test-negative, case-control study design. This is, to our knowledge, the first use of this method to estimate PES. While it has been used to study vaccine effectiveness,16-23 it does not appear to have been used to
Estimate PES, perhaps because of a perception that it is not applicable, as most prior and current infections are undocumented, unlike vaccinations, which are typically documented and tracked in health systems. We also validate this method by actually estimating PES for SARS-CoV-2 infection in Qatar, at a time when the Alpha15 (B.1.1.7) and Beta15 (B.1.351) variants dominated incidence.22-27
Methods
Test-negative case-control study design
The test-negative, case-control study design has emerged as a robust and practical method to assess vaccine effectiveness for respiratory tract infections.16-23 In this design, persons seeking healthcare because of symptoms are recruited into the study.16, 17 Those testing positive for the infection (cases) are then matched to those testing negative (controls).16, 17 Matching is done to control for differences in the risk of exposure to the infection.22, 23, 28 Vaccine effectiveness is then derived as one minus the ratio of the odds of vaccination in subjects testing positive to the odds of vaccination in subjects testing negative.16, 17 A key strength of this design is removal of differences in healthcare-seeking behavior between vaccinated and unvaccinated persons, thereby minimizing bias.16, 17 Another strength is minimization of bias arising from misclassification of infection.16, 17
Mathematical modeling and simulation of the test-negative design
Mathematical modeling was used to demonstrate the applicability of the test-negative, case-control study design for deriving effectiveness of prior infection in preventing reinfection (PES), that is, the proportional reduction in susceptibility to infection among those with prior infection versus those without.2 Modeling was also used to investigate effects of biases on estimated PES. While this demonstration was done for SARS-CoV-2 infection, the approach is generic and should be broadly applicable to a range of infections.
Several models were devised to simulate SARS-CoV-2 infection transmission in the population and to investigate applicability of the test-negative design. The models were informed by previously published models for SARS-CoV-2 infection.10, 13, 29-34 The first was the classic Susceptible Exposed Infectious Recovered (SEIR) model, but extended to allow for reinfections (Baseline Model; Figure 1A). This model was used to demonstrate applicability of the test-negative design and to investigate sources of bias.

Schematic diagrams of mathematical models used in this study. A) Classic SEIR model extended to allow for reinfections (Baseline Model). B) Baseline Model extended to include vaccination (Vaccination Model). C) Baseline Model extended to include waning in protection of prior infection against reinfection (Waning of Immunity Model).
The second was an extension of the Baseline Model to incorporate scale-up of vaccination in the population (Vaccination Model; Figure 1B). This model was used to investigate whether vaccination could affect applicability of this method to estimate PES. Vaccine effectiveness (VES) was defined as the proportional reduction in susceptibility to infection among those vaccinated versus those unvaccinated.33, 34 VES was set at 75%, a representative value for the range of Coronavirus Disease 2019 (COVID-19) vaccines available at present. Duration of vaccine-induced protection was assumed to be 6 months in light of documented waning of COVID-19 vaccine protection.26, 35
The third was also an extension of the Baseline Model, incorporating gradual (linear) waning in protection offered by prior infection against reinfection (Waning of Immunity Model; Figure 1C).
These models consisted of coupled nonlinear differential equations that stratified the population into groups (compartments) based on infection status (infected, reinfected, or uninfected) and vaccination status (vaccinated, unvaccinated). Susceptible and recovered individuals (vaccinated or unvaccinated) were assumed at risk of acquiring the infection at a force of infection that varied throughout the epidemic due to variation in the contact rate.
These models were calibrated to mimic the actual evolution of the COVID-19 epidemic in Qatar.13, 29 The contact rate was varied to generate two major epidemic waves several months apart, as actually occurred.13, 26, 29, 36 Parameters of the models are summarized in Table 1. Further details on these models, their equations, and their parametrization can be found in previous publications.10, 13, 29-34 Modeling analyses were conducted in MATLAB R2019a (Boston/MA/USA).37
Model parameters and assumptions.
Effectiveness of prior infection against reinfection and impact of bias
Applying the test-negative, case-control study design, PES was derived as one minus the ratio of the odds of prior infection in subjects testing positive (such as by polymerase chain reaction (PCR) testing), to the odds of prior infection in subjects testing negative for the infection. The 2-by-2 table used to derive the odds ratio is shown in Figure 2A, as expressed in terms of the Baseline Model’s population variables. The mathematical expression for PES is also shown in Figure 2A, assuming no form of bias. An underlying assumption is that those being tested are a specific fixed proportion (sample) of all population variables.
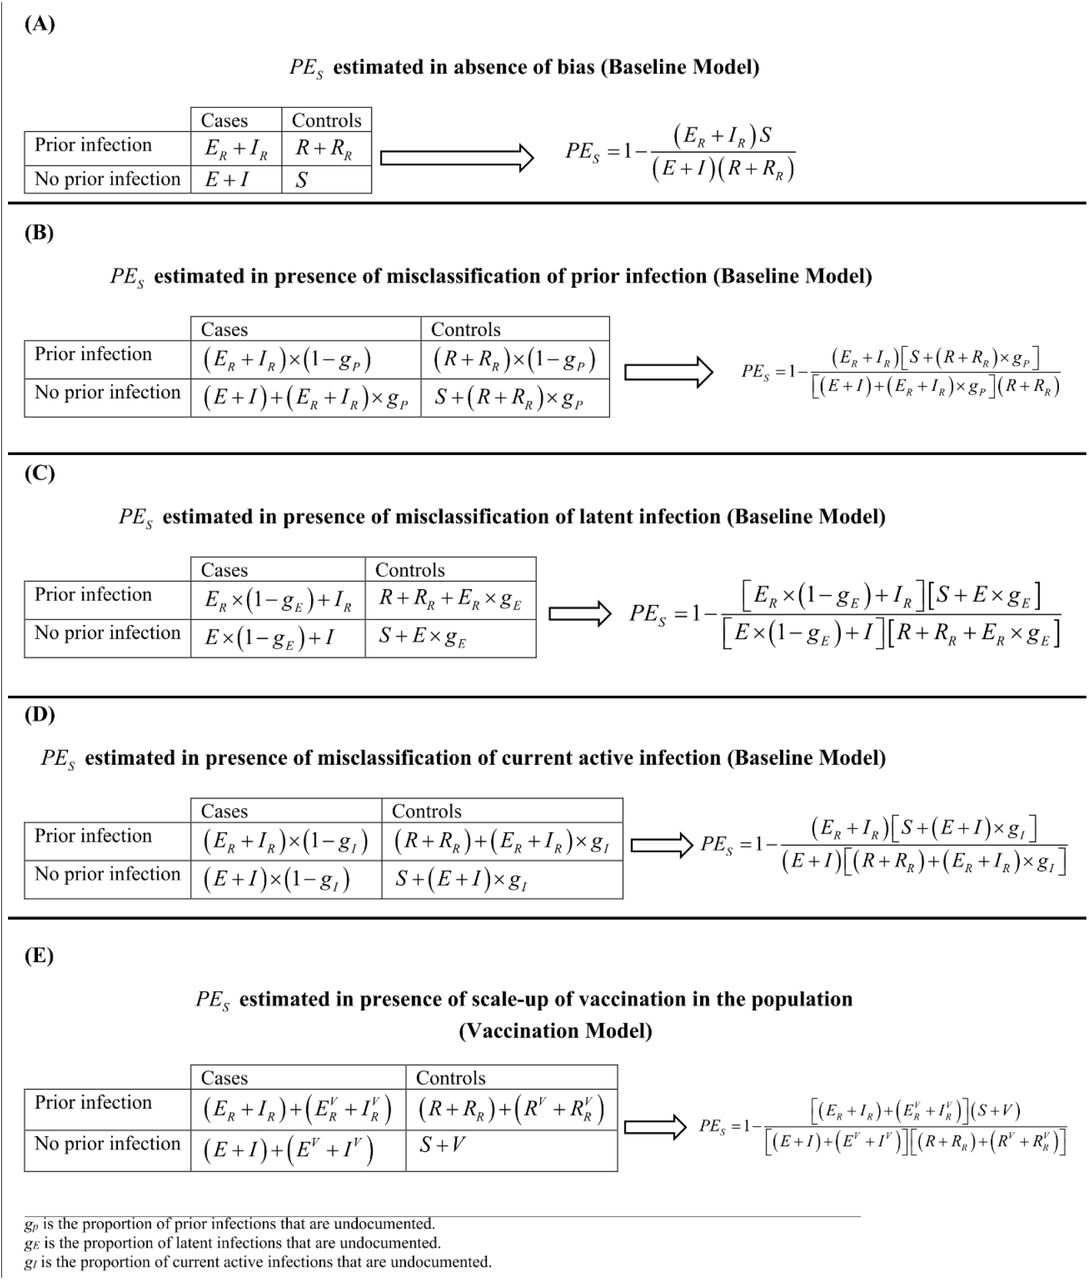
The 2-by-2 tables and equations used to estimate effectiveness of prior infection in preventing reinfection (PES) using the test-negative, case-control study design. A) PES estimated in absence of bias. B) PES estimated in presence of misclassification of prior infection. C) PES estimated in presence of misclassification of latent infection. D) PES estimated in presence of misclassification of current active infection. E) PES estimated in presence of vaccination scale-up.
Several forms of bias may affect estimation of PES using this method. The most critical is misclassification of prior infection status. A proportion gP of those previously infected may not have been diagnosed. They may have been unaware of their infections. It is reasonable to assume that most persons with a prior infection may not have had it documented.10-13 Here, we assumed that 75% of prior infections are undocumented (Table 1).
Unlike vaccine effectiveness studies, in which records are typically available to track vaccinations,16-23, 28 most persons with prior infection could be misclassified as persons with no prior infection. Similarly, most currently active infections may not be documented. The 2-by-2 table is thus modified for this bias along with the expression for PES (Figure 2B). It was assumed that this bias affects both cases and controls similarly, a valid assumption considering that both cases and controls are seeking healthcare because of symptoms. This assumption is central to the test-negative design strategy.16, 17
A second source of bias is misclassification of latent infection status. A proportion gE of those with latent infections are asymptomatic; thereby remaining untested and undiagnosed. These cases would be misclassified as controls. The 2-by-2 table is thus modified to accommodate this bias along with the expression for PES (Figure 2C). We assumed that gE = 75% (Table 1). We also assumed that this bias similarly affects those with and without prior infection. This is a valid assumption considering that both are seeking healthcare for the same reason, another assumption central to the test-negative design strategy.16, 17
A proportion gI of cases (current active infections) could be misclassified as controls, because of lack of testing or due to imperfect sensitivity of the testing method, thereby introducing another form of bias. The 2-by-2 table is thus modified for this bias along with the expression for PES (Figure 2D). We assumed that gI = 75% (Table 1). We also assumed that this bias similarly affects those with and without prior infection.16, 17
Estimation of PES may occur at a time when vaccination is being scaled up, as in the current COVID-19 pandemic. This could introduce bias as vaccination is another form of immune protection. Using the Vaccination Model, the 2-by-2 table is modified in presence of vaccination along with the expression for PES (Figure 2E). We assumed that vaccination is being linearly scaled up to reach the vaccine coverage attained in Qatar during the duration of the simulation. We also assumed that PES is the same regardless of vaccination status; that is, hybrid immunity of prior infection and vaccination is superior to that of either prior infection or vaccination separately.36, 38
Since different forms of bias may act synergistically when present together, the impact of the above biases was also investigated by applying all of them simultaneously.
Real-world application: Effectiveness of prior infection in preventing reinfection in Qatar
To validate the test-negative design, PES was estimated in Qatar using national-level routine PCR testing data. Only persons being PCR tested for clinical suspicion of infection due to symptoms between March 8 and April 21, 2021 were eligible for inclusion in this analysis. This study duration was chosen because there are existing estimates for PES during this time, but using a conventional, cohort study design.4 This allows validation of the estimate generated using the test-negative design.
Prior infection was defined as a PCR-confirmed infection ≥90 days before a new PCR-positive test.2, 6 Individuals infected during the 90 days preceding the PCR test were thus excluded. Based on existing evidence39-41 and viral genome sequencing,3, 22 a SARS-CoV-2 Alpha variant case was defined as an S-gene “target failure” case using the TaqPath COVID-19 Combo Kit platform (Thermo Fisher Scientific, USA42) applying the criterion of a PCR cycle threshold (Ct) value ≤30 for both the N and ORF1ab genes, but a negative outcome for the S gene.3, 4, 41 With essentially only Beta and Alpha cases identified between March 8 and April 21, 2021,22-27 a Beta case was proxied as the complement of the Alpha criterion, that is, any case with a Ct value ≤30 for the N, ORF1ab, and S genes.
Only the first PCR-positive test during the study was included for each case, and only the first PCR-negative test during the study was included for each control, per established protocol for the test-negative design.22, 23, 26, 28 Alpha and Beta cases were exact matched one-to-one to controls (PCR-negative persons) by sex, 10-year age group, nationality, and calendar week of PCR test. Matching of cases and controls was done to control for known differences in the risk of exposure to SARS-CoV-2 infection in Qatar.13, 43-46 Further description of Qatar’s databases and methods of analysis can be found in previous publications.1-4, 22, 23, 26, 28, 36, 43
Socio-demographic characteristics of study samples were described using frequency distributions and measures of central tendency. The odds ratio, comparing odds of prior infection among cases versus controls, and its associated 95% confidence interval (CI) were derived using conditional logistic regression, factoring matching in the study design. This analytical approach is done to minimize potential bias due to variation in epidemic phase16, 47 and other confounders.13, 43-46, 48,49 PES and its associated 95% CI were calculated by applying the following equation:
PES = 1™ odds ratio of prior infection among cases versus controls
Statistical analyses were conducted in STATA/SE version 17.0.50 The study was approved by the Hamad Medical Corporation and Weill Cornell Medicine-Qatar Institutional Review Boards with waiver of informed consent.
Results
Protection of prior infection using the test-negative design and impact of bias
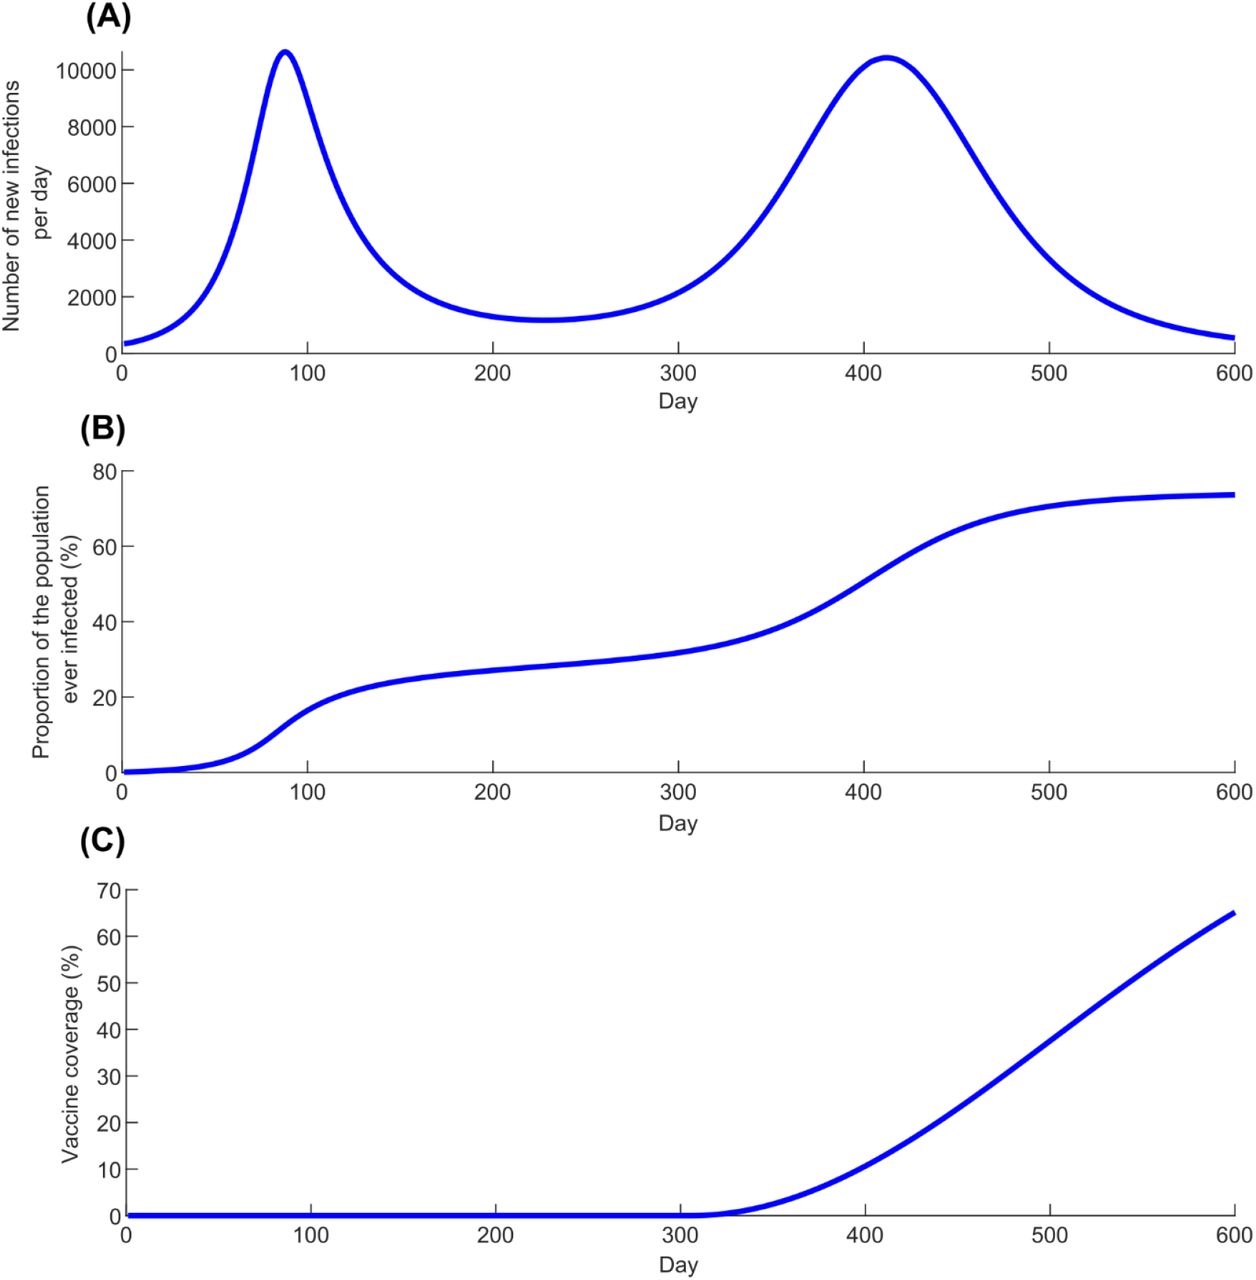
Figure 3 shows simulated evolution of the SARS-CoV-2 epidemic in its two waves (Figure 3A), the proportion of the population ever infected (Figure 3B), and vaccine coverage (Figure 3C). Figure 4A shows the estimated PES using the test-negative design (labeled as  ), by application of the expression in Figure 2A, compared to the true PE (labeled as
  ), here assumed at 80% (Table 1). Apart from the very early phase of the epidemic, when the number of reinfections was minimal, the difference between
  and
and  was no more than several percentage points. The difference became negligible as the epidemic progressed.

Simulated SARS-CoV-2 epidemic through two epidemic waves. A) Daily number of new infections. B) Proportion of the population ever infected. C) Scale-up of vaccine coverage.

Estimated effectiveness of prior infection in preventing reinfection using the test-negative study design  compared with the true effectiveness of prior infection in preventing reinfection
  . A)
. A)  versus
  in presence of no waning of protection (Baseline Model). B)
  versus
  month by month after the prior infection in presence of gradual waning of protection against reinfection (Waning of Immunity Model).
Assuming that only 25% of prior infections are documented (Table 1), Figure 5A shows the impact of misclassification of prior infection, by application of the expression in Figure 2B. This form of bias resulted in underestimation of  . When the proportion of the population ever infected was below 50% (Figure 3B),
  was only few percentage points lower than that of
  . However, the underestimation increased to as much as 30 percentage points when the proportion of the population ever infected was ∼75%.

Impact of bias in estimating effectiveness of prior infection in preventing reinfection using the test-negative study design  ). A) Impact of misclassification of prior infection. B) Impact of misclassification of latent infection. C) Impact of misclassification of current active infection. D) Impact of scale-up of vaccination in the population.
Misclassification of latent infection (Figure 5B), misclassification of current active infection (Figure 5C), and scale-up of vaccination (Figure 5D), all resulted in negligible bias in estimated  . Application of the above forms of bias at the same time suggested that there is no synergy when biases are combined (Figure S1).
Applying the Waning of Immunity Model, Figure 4B shows  versus
  , month by month after prior infection, assuming that there is a gradual linear waning in protection of prior infection against reinfection. This comparison was done after the second wave at day 600 after the virus introduction (Figure 3A).
  provided a robust approximation of
  and its waning month by month.
Application: Effectiveness of prior infection in preventing reinfection in Qatar
Figure 6 presents a flowchart describing the population selection process for estimating PES in Qatar using the test-negative design. The median age of study subjects was 32-34 years, at least half were males, and they came from diverse countries (Table 2). Study samples were broadly representative of Qatar’s demographics.43, 51

Flowchart describing the population selection process to estimate effectiveness of prior infection in preventing reinfection using the test-negative study design.
Demographic characteristics of subjects in the samples used to estimate effectiveness of prior infection in preventing reinfection using the test-negative study design.
Among the 4,645 Alpha cases (PCR-positive persons), 7 had a record of prior infection, compared to 232 among their matched controls (PCR-negative persons). PES against Alpha was estimated at 97.0% (95% CI: 93.6-98.6). Among the 13,753 Beta cases, 124 had a record of prior infection, compared to 815 among their matched controls. PES against Beta was estimated at 85.5% (95% CI: 82.4-88.1).
During the study duration (March 8, 2021 to April 21, 2021), we conducted earlier two matched cohort studies to estimate PES for Alpha and for Beta.4 For Alpha, cohort-study estimates were 97.6% (95% CI: 95.7-98.7%) and 96.4% (95% CI: 92.1-98.3%).4 For Beta, cohort-study estimates were 92.3% (95% CI: 90.3-93.8%) and 86.4% (95% CI: 82.5-89.5%).4
Discussion
Study results show that the test-negative design can be used to generate rigorous estimates for protection afforded by prior infection against reinfection, even though most prior infections are undocumented. Estimates were robust despite several forms of potential bias, and even under rather extreme assumptions for these biases. The test-negative design was also applied to Qatar’s routine PCR testing data, and results were validated by comparing test-negative estimates to those generated using conventional cohort study designs.4 Application of the test-negative design should be feasible in different countries as long as there are databases for infection testing that are of reasonable quality and that can be linked to documented prior infection status (and preferably to vaccination status). Such databases are available and have been used extensively in vaccine effectiveness studies, such as for SARS-CoV-2 infection.18-23, 28
Of the considered biases, only misclassification of prior infection status could have a large effect on PES estimation, but mainly where more than 50% of the population already had a prior infection. This situation is unlikely to have been reached for SARS-CoV-2 infection in most countries.52 Even in such situations, the direction (and magnitude) of bias is known; it underestimates PES. Therefore, the test-negative design can still provide a lower bound for the true PES, which may be sufficient to inform public health decision making. Thus, this bias may not restrict the utility of this method.
The test-negative study design has strengths that conventional designs may lack. Cohort study designs can be affected by bias resulting from different infection testing frequencies in the two arms of the study. This bias does not affect the test-negative design, as it uses only those who are tested. An example can be seen in comparing the results of the test-negative design to the results of our earlier cohort design.4 In the cohort design, adjustment for testing frequency reduced PES from 97.6% (95% CI: 95.7-98.7%) to 95.8% (95% CI: 92.5-97.7%) for Alpha,4 very similar to the test-negative estimate of 97.0% (95% CI: 93.6-98.6). Similarly for Beta, adjustment for testing frequency reduced PES from 92.3% (95% CI: 90.3-93.8%) to 86.5% (95% CI: 83.0-89.2%),4 very similar to the test-negative estimate of 85.5% (95% CI: 82.4-88.1). Accordingly, the test-negative design may provide a more robust estimate than the cohort design.
The test-negative design may also be preferable to the cohort design for other reasons. Cohort designs rely on cohorts that may not be strictly comparable, and it may not be possible to control for all differences in risk of exposure to the infection by matching and analysis adjustments. For example, in our earlier cohort study,4 we compared those with a record of a prior PCR-confirmed infection to those with an antibody-negative test, but these two groups may differ in ways that cannot be controlled. Meanwhile, the test-negative design is perhaps less susceptible to such differences, as cases and controls are intentionally recruited for the same healthcare-seeking behavior. Lastly, while the test-negative design can be biased by misclassification of prior infection, the cohort design is perhaps more affected by this bias. The odds ratio metric in the test-negative design is less affected by this bias than the relative risk, incidence rate ratio, or hazard ratio metrics in the cohort design.
In regard to limitations, specific forms of bias were investigated, but other sources of bias are possible, and these may depend on the database being analyzed.26 There is already a volume of literature investigating other forms of bias for the test-negative design in the context of vaccine effectiveness estimation,16, 17 some of which may apply in the context of PES estimation. While this study demonstrated use of the test-negative design to estimate PES, other factors need to be considered in actual application. For instance, the algorithm for matching needs to be developed with knowledge of the local epidemiology to ensure that matching can effectively control differences in the risk of exposure to the infection.
In conclusion, the test-negative design offers a feasible and robust method to estimate protection of prior infection in preventing reinfection. This method should be considered to provide rapid, rigorous estimates of protection offered by prior infection for different variants of SARS-CoV-2, such as the Omicron that emerged recently.
Data Availability
The dataset of this study is a property of the Qatar Ministry of Public Health that was provided to the researchers through a restricted-access agreement that prevents sharing the dataset with a third party or publicly. Future access to this dataset can be considered through a direct application for data access to Her Excellency the Minister of Public Health (https://www.moph.gov.qa/english/Pages/default.aspx). Aggregate data are available within the manuscript and its Supplementary information.
Author contributions
HHA and MT constructed, coded, and parameterized the mathematical models, conducted the mathematical modeling analyses, and co-wrote the first draft of the article. HC performed the statistical analyses and co-wrote the first draft of the article. LJA conceived and designed the study, led the mathematical modeling and statistical analyses, and co-wrote the first draft of the article. PT and MRH conducted the multiplex, RT-qPCR variant screening and viral genome sequencing. HY, FMB, and HAK conducted viral genome sequencing. All authors contributed to data collection and acquisition, database development, discussion and interpretation of the results, and to the writing of the manuscript. All authors have read and approved the final manuscript.
Competing interests
Dr. Butt has received institutional grant funding from Gilead Sciences unrelated to the work presented in this paper. Otherwise we declare no competing interests.
Supplementary Material

Impact of combined biases in estimating effectiveness of prior infection in preventing reinfection using the test-negative study design  . This figure shows the results applying simultaneously misclassification of prior infection, misclassification of latent infection, misclassification of current active infection, and scale-up of vaccination in the population.
Acknowledgements
We acknowledge the many dedicated individuals at Hamad Medical Corporation, the Ministry of Public Health, the Primary Health Care Corporation, the Qatar Biobank, Sidra Medicine, and Weill Cornell Medicine – Qatar for their diligent efforts and contributions to make this study possible.
HHA acknowledges the joint support of Qatar University and Marubeni M-QJRC-2020-5. The authors are grateful for support from the Biomedical Research Program and the Biostatistics, Epidemiology, and Biomathematics Research Core, both at Weill Cornell Medicine-Qatar, as well as for support provided by the Ministry of Public Health, Hamad Medical Corporation, and Sidra Medicine. The authors are also grateful for the Qatar Genome Programme and Qatar University Biomedical Research Center for institutional support for the reagents needed for the viral genome sequencing. Statements made herein are solely the responsibility of the authors. The funders of the study had no role in study design, data collection, data analysis, data interpretation, or writing of the article. The developed mathematical models were made possible thanks to modeling infrastructure developed through NPRP grant number 9-040-3-008 (Principal investigator: LJA) and NPRP grant number 12S-0216-190094 (Principal investigator: LJA) from the Qatar National Research Fund (a member of Qatar Foundation; https://www.qnrf.org). The statements made herein are solely the responsibility of the authors. The funders had no role in study design, data collection and analysis, decision to publish, or preparation of the manuscript.
References


