
Abstract
Pediatric COVID-19 (pCOVID-19) is rarely severe, however a minority of SARS-CoV-2-infected children may develop MIS-C, a multisystem inflammatory syndrome with significant morbidity. In this longitudinal multi-institutional study, we used multi-omics to identify novel time- and treatment-related immunopathological signatures in children with COVID-19 (n=105) and MIS-C (n=76). pCOVID-19 was characterized by enhanced type I IFN responses, and MIS-C by type II IFN- and NF-κB dependent responses, matrisome activation, and increased levels of Spike protein. Reduced levels of IL-33 in pCOVID-19, and of CCL22 in MIS-C suggested suppression of Th2 responses. Expansion of TRBV11-2 T-cell clonotypes in MIS-C was associated with inflammation and signatures of T-cell activation, and was reversed by glucocorticoids. The association of MIS-C with the combination of HLA A*02, B*35, C*04 alleles suggests genetic susceptibility. MIS-C B cells showed higher mutation load. Use of IVIG was identified as a confounding factor in the interpretation of autoantibody levels.
Introduction
Following infection with severe acute respiratory syndrome coronavirus 2 (SARS-CoV-2), most children develop mild and self-limiting symptoms of coronavirus disease 2019 (COVID-19) [1] although severe cases and fatal outcomes have been also reported [2]. Furthermore, approximately 3-4 weeks after exposure to SARS-CoV-2, some children develop a hyperinflammatory response resembling Kawasaki Disease (KD) and toxic shock syndrome that has been termed multisystem inflammatory syndrome in children (MIS-C) [3, 4].
The mechanisms underlying the phenotypic heterogeneity of pediatric COVID-19 (pCOVID-19) and MIS-C remain ill-defined. Older age, male sex, obesity, co-existing comorbidities genetic defects of TLR3- and TLR7-dependent type I interferon (IFN) pathway, and neutralizing autoantibodies against type I IFNs are associated with more severe clinical outcomes in adults with COVID-19 (aCOVID-19) [5–8]. More limited information is available on the immune response to SARS-CoV-2 infection in children [9]. Elevated serum levels of several inflammatory biomarkers, an expansion of T cell clonotypes expressing the T-cell receptor TRBV11-2 gene (possibly in response to a SARS-CoV-2 superantigen), and presence of autoantibodies directed against several self-antigens have been reported in MIS-C [10–14].
While the magnitude of the inflammatory response in MIS-C correlates with disease severity [13, 15], and use of methylprednisolone and intravenous immunoglobulins (IVIG) improves clinical outcome [16], the temporal trajectory of immune and inflammatory responses during the course of the disease and how they are affected by therapeutic interventions has not been elucidated. In this study, we used a multi-omics approach to comparatively assess innate and adaptive immune responses of pCOVID-19 and MIS-C. We identified distinct signatures associated with various clinical phenotypes of pediatric SARS-CoV-2 infection and described age-, time- and treatment-related perturbations of innate and adaptive immune responses. These data may help define the pathophysiology of these distinct phenotypes in children and guide treatment.
Results
Characteristics of the study cohorts
We included a total of 181 pediatric patients (105 with pCOVID-19 and 76 with MIS-C) and 60 pediatric healthy controls (pHC) that were enrolled at multiple institutions in Italy, Chile, Israel, and the United States. Samples were collected from March 30, 2020 to February 8, 2021. The demographic, clinical and laboratory characteristics of patients and pHC are reported in Table 1 and in Supplementary Methods. The number of patients from each cohort analyzed with various assays is outlined in Figure 1.
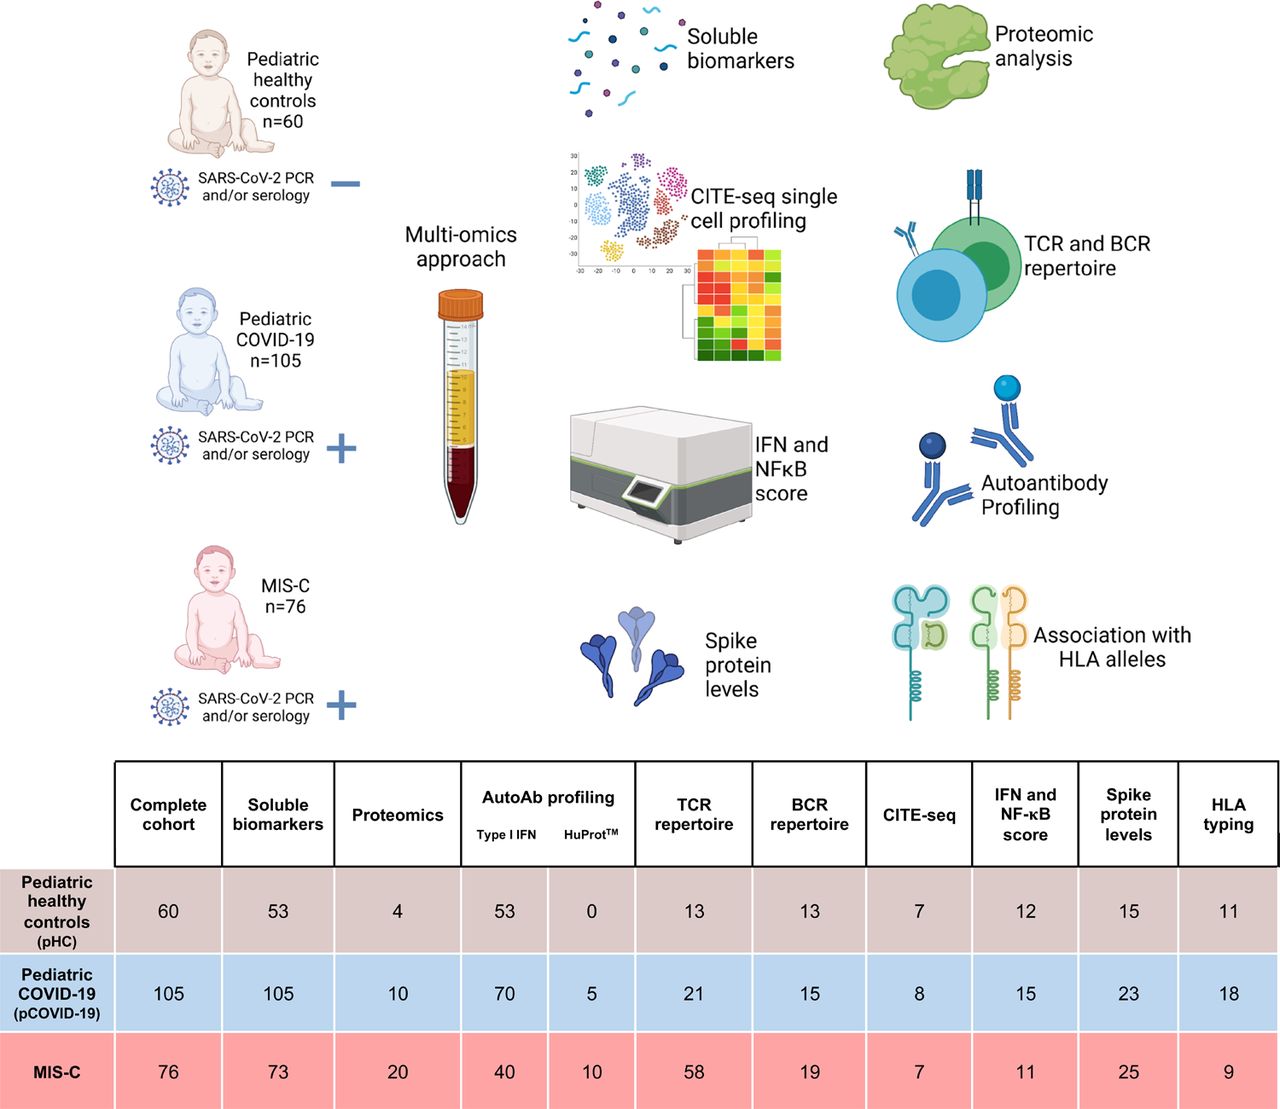
The number of subjects included in each analysis is shown. AutoAb, autoantibody; BCR, B cell receptor; CITE-Seq, cellular indexing of transcriptomes and epitopes by sequencing; HLA, human leukocyte antigen; HuProtTM, human proteome microarray; IFN, interferon; NF-κB, nuclear factor-κB; TCR, T cell receptor.
Consistent with the well-described clinical course of pCOVID-19, 95% of the 105 subjects experienced either no (n=3), mild (n=81), or moderate (n=16) symptoms. The clinical severity was not affected by age, sex, or ethnicity, and there were no fatal outcomes.
MIS-C diagnosis was based on the Center for Disease Control and Prevention (CDC) Health Advisory case definition (see Methods), but only patients with evidence of prior SARS-CoV-2 infection (as determined by positive PCR and/or serology) were included. MIS-C patients were divided into moderate (MIS-C-M: n= 52, 68%) and severe (MIS-C-S: n=24, 32%) groups, as previously described [13]. Gastrointestinal involvement was common (n=65, 86%). Among 53 (70%) children with cardiovascular manifestations, isolated myocarditis and/or heart failure were seen in 42 (79%) and coronary artery involvement in 11 (21%) children, 7 of which also had associated myocarditis and/or heart failure. Distributive or cardiogenic shock was observed in 36 patients (47%). All children received glucocorticoids (n=69, 91%) and/or IVIG (n=46, 61%). All patients improved significantly during the hospitalization and were eventually discharged.
Analysis of soluble biomarkers reveals distinctive signatures of pCOVID-19 and MIS-C in the early phase of the disease
To explore the early immune and inflammatory response that characterizes pCOVID-19 and MIS-C, we measured levels of 50 soluble biomarkers in serum or plasma obtained from 55 children with pCOVID-19 within 7 days since onset of symptoms (median, 2 days; IQR, 0.75-3 days), and in 48 children with MIS-C within 7 days from hospitalization (median, 2 days; IQR, 1-4 days). Soluble biomarkers were also measured in 62 MIS-C patients > 7 days after admission (median, 14.5 days; IQR, 10.75-32 days) and in 53 pHC. Distinctive signatures characterized pCOVID-19 and MIS-C. Higher levels of IFN-α2a were detected in pCOVID-19 (Figure 2A and Figure S1A). We corroborated these findings using a whole-blood 28-gene NanoString assay capturing expression of type I IFN-stimulated genes in both myeloid and lymphoid cells [17]. High levels of IFN-α2a in pCOVID-19 were associated with a higher type I IFN score (Figure 2B). In addition, pCOVID-19 was also characterized by low levels of IL-33 (Figure 2A), an epithelial and endothelial cell alarmin. To investigate how immune and inflammatory responses evolve over time in pCOVID-19, we analyzed levels of soluble biomarkers in blood samples that were collected in 105 pCOVID-19 patients at various time points after onset of symptoms or positive PCR and observed a rapid decline of IFN-α2a, IFN-γ, IL-10, CXCL10, CCL2 and ferritin (Figure S2A). Analysis of MIS-C samples obtained within 7 days of hospitalization demonstrated a significant increase in biomarkers related to type II IFN signaling (IFN-γ, CXCL9, CXCL10), macrophage activation (IL-6, sTNFRI, IL-10, sCD25, IL-17, TNF-α, sCD163, CCL2, CCL3, CCL4, ferritin), endothelial injury (VEGF, sVCAM-1/sCD106, sE-Selectin/sCD62E), matrisome-related inflammation [18] (MMP-9, sST2/sIL-33R, CX3CL1) and septic shock (LBP), and low levels of CCL22. For most of these biomarkers, levels tended to decrease at later time points during hospitalization (Figure 2A and Figure S2B), likely indicative of inflammation resolution and recovery. Consistent with this broad inflammatory signature, NanoString analysis of a 15-gene type II IFN-dependent and of 11 NF-κB-responsive genes revealed significantly higher scores in paired samples obtained from MIS-C patients at earlier versus later time points during hospitalization (Figure 2C), and a similar pattern was observed also for type I IFN score (Figure 2B). Although some pCOVID-19 patients showed elevation of several inflammatory biomarkers (Figure 2A and Figure S2B), their response was generally not as prominent as in MIS-C (Table S1), and no differences were observed in the NanoString type II IFN and NF-κB scores between pCOVID-19 and pHC (Figure 2C).
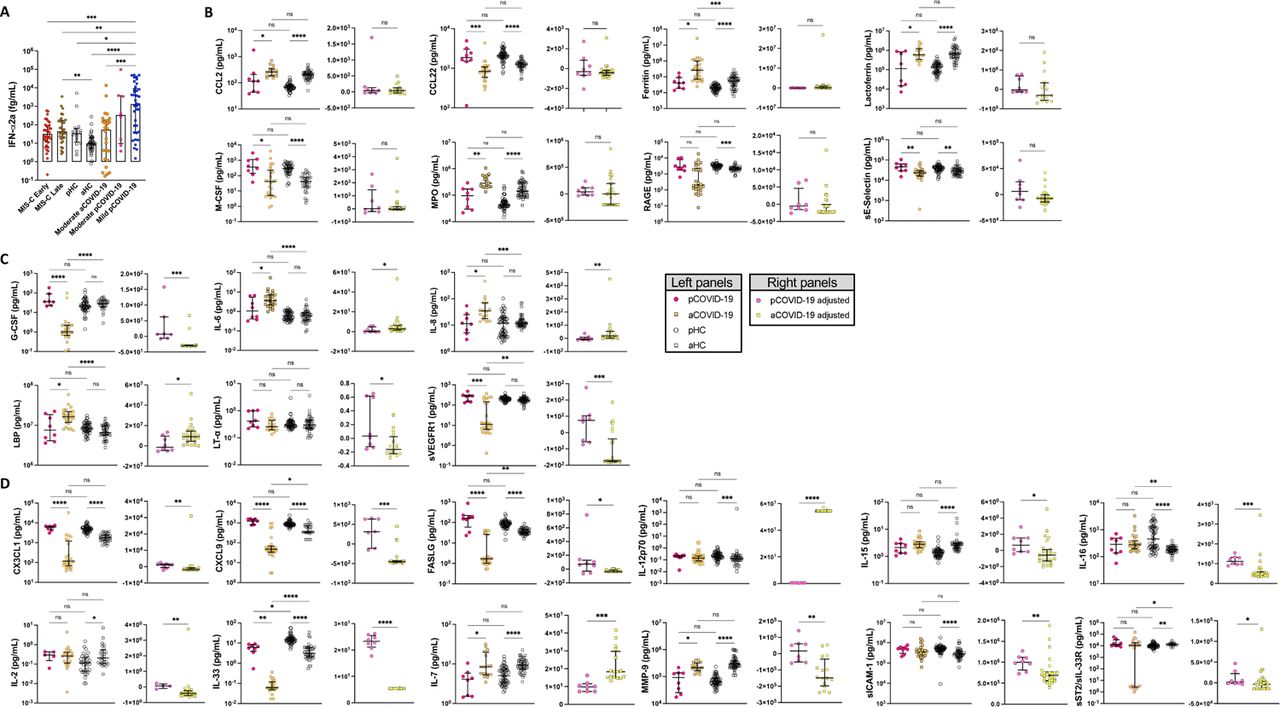
A) Children with mild acute COVID-19 (n=38) in the first 7 days since symptom onset have significantly higher IFN-⍺2a levels compared to healthy pediatric controls [pHC] (n=15), healthy adult controls [aHC] (n=40), children with MIS-C (both in the first 7 days since hospitalization (n=36) and later in the course of the disease (n=32)), and adults with moderate acute COVID-19 (n=26). B-D) Comparison of soluble biomarkers measured within 7 days of symptom onset in children (n=8) and adults (n=26) with moderate acute COVID-19, as well as pHC (n=53) and aHC (n=45), both unadjusted (left graphs; Kruskal-Wallis test) and adjusted for the baseline differences in healthy subjects of the same age group (right graphs, Mann-Whitney test). B) Biomarkers whose serum levels were significantly different in healthy children and adults, but not in diseased subjects. C) Biomarkers that differed significantly in pediatric vs. adult acute COVID-19, but not between healthy children and adults. D) Biomarkers for which both age and SARS-CoV-2 infection independently contributed to differences in levels in children and adults.
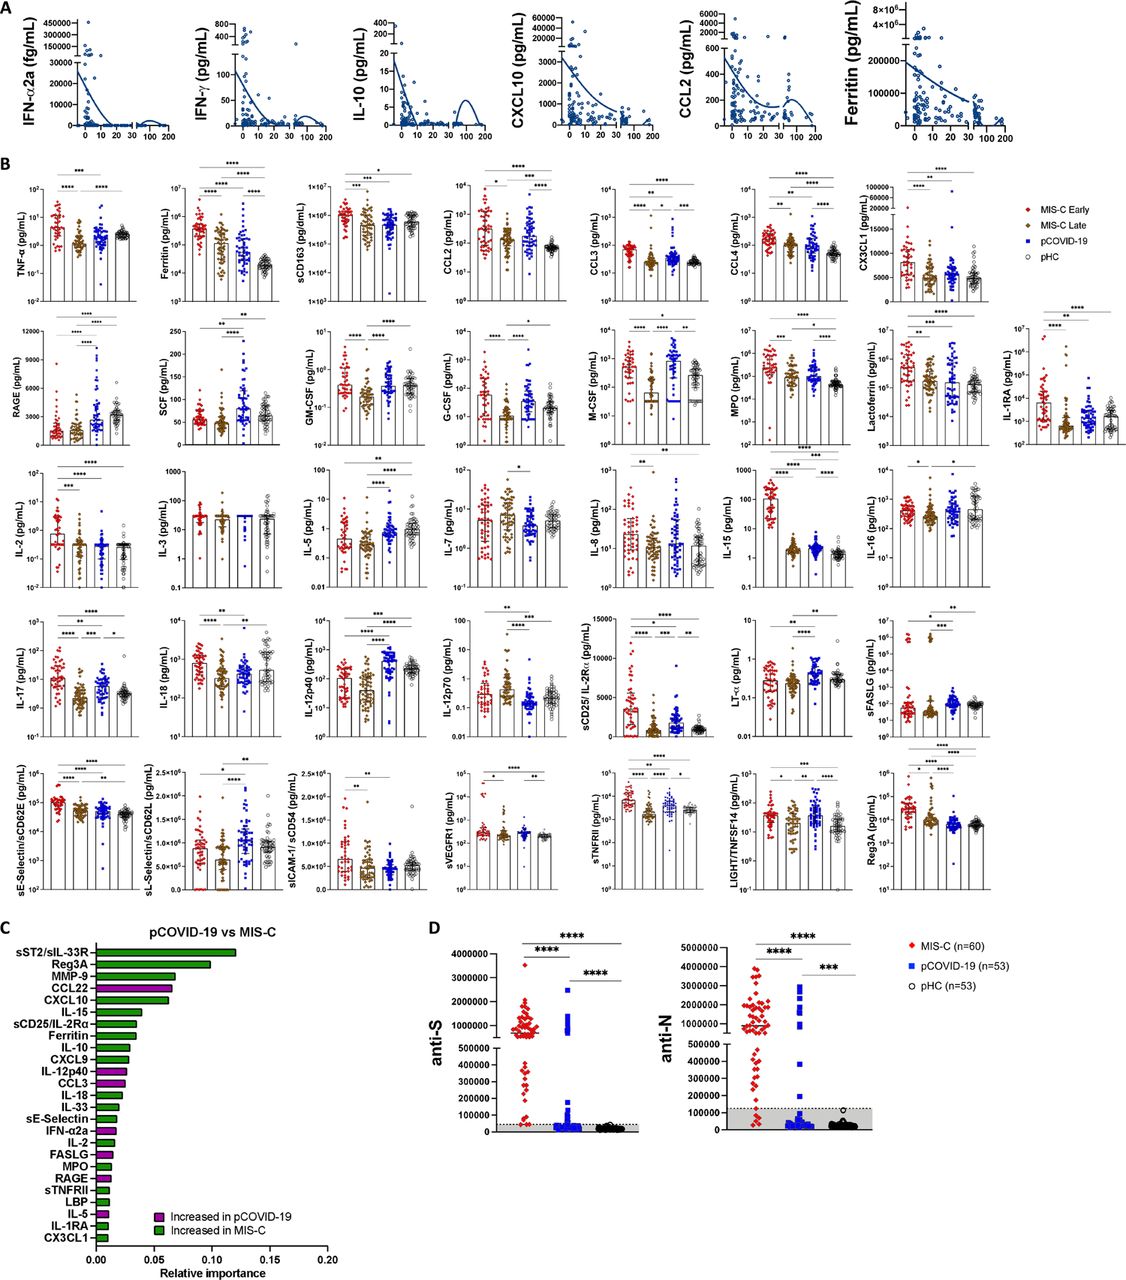
A. Longitudinal analysis of IFN-⍺2a, IFN-γ, IL-10, CXCL10, CCL2 and ferritin levels in 105 pCOVID-19 patients. X-axis shows time from onset of symptoms or (for asymptomatic children) positive PCR. B. Comparison of serum biomarker levels in children with early (within 7 days since admission) and late (>7days) MIS-C, pCOVID-19 (within 7 days from symptom onset) and pHC. Univariate analysis by Kruskal-Wallis test. P values are marked as follows: * <0.05, ** <0.01, *** <0.001, **** <0.0001. C. Random forest classification comparing pCOVID-19 (within 7 days from symptom onset) to MIS-C (within 7 days of hospitalization). D. Levels of anti-Spike (anti-S) and anti-Nucleocapsid (anti-N) antibodies in MIS-C and pCOVID-19 patients and in pHC. Values are expressed in Light Units. Positivity cut-off values are 45,000 for anti-S, and 125,000 for anti-N antibodies.
Statistical analysis of differences in individual biomarker levels in 2-group comparisons

A) Comparison of serum biomarker levels in children with multi-system inflammatory syndrome in children (MIS-C) early (within 7 days since admission) and MIS-C late (>7days), pediatric COVID-19 (pCOVID-19) within 7 days from symptom onset, and pediatric healthy controls (pHC). B) Comparison of type I interferon (IFN) score in MIS-C early, MIS-C late, pHC, pCOVID-19 with elevated (pCOVID-19hi) and lower (pCOVID-19low) IFN-α2a levels,. C) Comparison of NF-κB score and type II IFN score in MIS-C early, MIS-C late, pCOVID-19, and pHC. D) Random forest classification comparing early pCOVID-19 (within first 7 days of symptoms) to pHC. E) Random forest classification comparing MIS-C Early (within first 7 days of hospitalization) to pHC. F) Serum Spike protein levels in MIS-C, pCOVID-19 and pHC. Statistical analysis in panels A-C and F was performed by Kruskal-Wallis test for multiple comparisons. P values are marked as follows: * <0.05, ** <0.01, *** <0.001, and **** <0.0001.
Feature importance analysis based on random forest classification (that also included age, sex and ethnicity) identified low levels of IL-33 and increased levels of IL-6, TNF-α, IL-15, ferritin, IL-10, CCL2, IFN-α2a, IFN-γ and MPO as the most important parameters distinguishing pCOVID-19 from pHC (Figure 2D). Using the same approach, elevated levels of ferritin, sST2/sIL-33R, MPO, sTNFRI, IL-6, sVCAM-1, CXCL10, MMP-9, IL-10, IL-15, sCD25, Reg3A, and low levels of CCL22 emerged as the most important parameters distinguishing early MIS-C from pHC (Figure 2E). Furthermore, random forest classification identified molecules involved in matrisome (sST2/sIL-33R and MMP-9), intestinal inflammation and myocardial damage (Reg3A) and T cell homeostasis (CCL22) as the most important factors distinguishing MIS-C from pCOVID-19 (Figure S2C). Multivariate regression analysis identified IL-33 and CCL22 as the only biomarkers whose levels were significantly different in pCOVID-19 vs. pHC, and in MIS-C vs. pCOVID-19, respectively (Table S2). The prominent inflammatory signature of MIS-C was associated with significantly elevated levels of soluble Spike protein, a pattern that was observed only in a minority of cases of pCOVID-19 (Figure 2F). Finally, anti-Spike (anti-S) and anti-Nucleocapsid (anti-N) antibody levels were significantly higher in MIS-C than in pCOVID-19 (Figure S2D), consistent with the limited time interval between onset and symptoms and sample collection in the pCOVID-19 group.
Biomarkers with significantly different concentrations in the first 7 days of illness (for pediatric COVID-19) or hospitalization (for MIS-C) by multivariate analysis adjusted for age, sex and ethnicity.
To investigate whether age plays an important role in modulating inflammatory responses, we compared levels of soluble biomarkers measured in 8 children and in 26 adults with a similar, moderate degree of COVID-19 severity, whose blood samples were collected within 7 days of symptom onset and within 7 days of admission, respectively. For this purpose, we took advantage of soluble biomarker data that we had previously generated in aCOVID-19 [19]. Groups of pHC (n=53) and adult healthy controls (aHC, n=45) were studied in parallel. For most biomarkers (38/48), blood levels differed between pHC and aHC (Table S1), indicating that age plays an important role in setting baseline immune status. After adjustment for these baseline differences, we identified three groups of biomarkers: a first group in which serum levels were significantly different in pHC and aHC (Figure S1B), indicating that the difference of unadjusted blood levels observed between pCOVID-19 and aCOVID-19 is probably driven by age, rather than COVID-19 itself. A second group of biomarkers differed significantly in pCOVID-19 versus aCOVID-19, but not between pHC and aHC (Figure S1C), suggesting that the nature and severity of inflammatory responses induced by SARS-CoV-2 infection differentially affects patients of different age. Finally, levels of a third group of soluble biomarkers appeared to be influenced both by age and SARS-CoV-2 infection (Figure S1D).
Proteomic analysis confirms distinctive immune response and inflammatory signatures in MIS-C and pCOVID-19
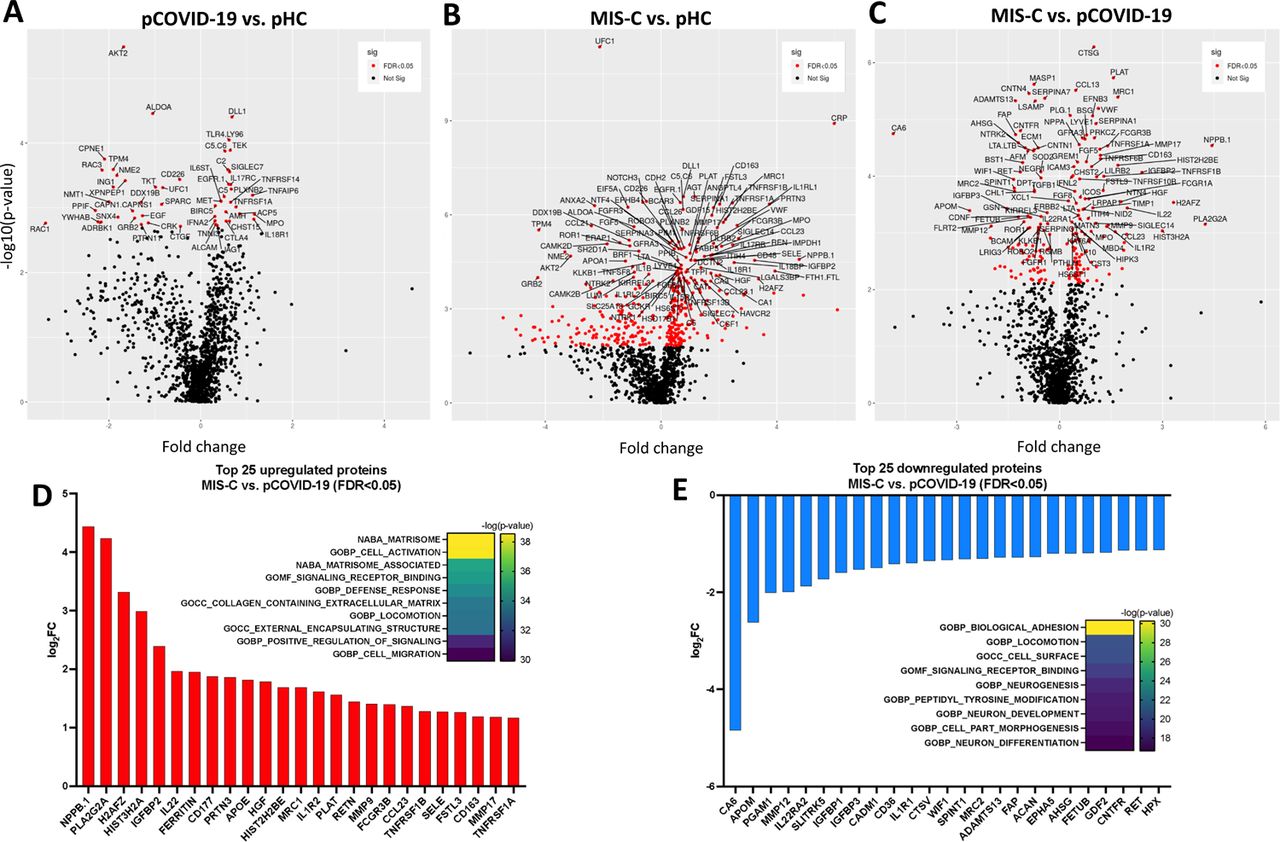
To gain additional insights into the broad circulating protein landscape of MIS-C and pCOVID-19 compared to healthy children, we performed proteomic profiling of a subgroup of subjects using SOMAscan® [20], an aptamer-based proteomics assay, measuring 1305 human protein analytes in plasma samples (Figure 3). In 10 pCOVID-19 patients, we observed a limited number of up- and down-regulated proteins (26 and 25, respectively) relative to 4 pHC, including increased levels of myeloid activation-associated proteins (MPO, IL18R1, TNFAIP6, ACP5), and SIGLEC7 (an inhibitor of NK cell pyroptosis and inflammasome activation) [21] (Figure 3A-B and Figure S3A; FDR<0.05, p<0.05). Gene set enrichment analysis (GSEA) revealed molecular signatures of immune activation, including type I IFN responses, compatible with active SARS-CoV-2 viral infection (Figure 3A).

A-C) Volcano plots showing group comparisons (pCOVID-19, MIS-C and pHC), reporting fold changes, expressed as a log2 scale, on the x-axis, and the p value, expressed as -log10(p value), on the y-axis. The plots denote the FDR-corrected significant analytes with red color coding. D-E) Top 25 up- and down-regulated plasma proteins obtained from the comparison between MIS-C (in the first seven days of hospitalization, n=20) and pCOVID-19 (in the first seven days from symptom onset, n=10). Heatmaps show the most significantly enriched pathways for every single comparison and the statistical significance is expressed as -log(p value). FDR, False Discovery Rate.

A-B) Upregulated (panel A) and downregulated (panel B) plasma proteins obtained from the comparison between pCOVID-19 (in the first 7 days from symptom onset, n=10) and pHC (n=4). Heatmaps show the most significantly enriched pathways for the group comparison and the statistical significance is expressed as -log(p value). C-D) Top 25 up- and down-regulated plasma proteins obtained from the comparison between MIS-C (within the first 7 days of hospitalization, n=20) and pHC (n=4). Heatmaps show the most significantly enriched pathways for the group comparison and the statistical significance is expressed as -log(p value). MIS-C, multisystem inflammatory syndrome in children; pCOVID-19, pediatric COVID-19; pHC, pediatric healthy controls.
A marked inflammatory profile was observed in 20 MIS-C patients, with a high number of significantly increased (n=242) and decreased proteins (n=158) compared to pHC (Figure 3C-D and Figure S3B; FDR<0.05, p<0.05). MIS-C patients had increased levels of several inflammatory biomarkers (serum amyloid A, CRP, ferritin, sST2/sIL-33R, CXCL9, CXCL10) and of B natriuretic peptide (NPPB.1), consistent with the characteristic cardiac involvement in MIS-C. GSEA showed hyperactivation of the matrisome-associated response, including extracellular matrix-associated proteins such as metallopeptidases. Overall, the inflammatory activation observed in MIS-C appeared to be higher and qualitatively different from pCOVID-19 (Figure S3C-E; FDR<0.05, p<0.05).
Serum biomarkers in MIS-C are affected by time interval and treatment
We hypothesized that the differences in soluble biomarker levels detected at early and later time points during the course of MIS-C (Figure 2A and Figure S2A) could be due to early intervention with systemic glucocorticoids and IVIG, which has been associated with an improved clinical outcome [16]. However, how these interventions modulate the inflammatory response has not been elucidated. We identified 9 patients for whom we had paired samples available prior to (median, 1 day prior; IQR 1.5 to 0 days) and after (median, +6 days, IQR +2.5 to +10 days) glucocorticoid administration. Biomarkers associated with type II IFN response (IFN-γ, CXCL9), T cell activation (sCD25), cell adhesion (sE-Selectin/sCD62E) and monocyte/macrophage activation (sTNFRII, M-CSF, ferritin, IL-6) decreased following systemic glucocorticoids (Figure S4A). We performed correlation analysis among biomarkers, factoring time interval from hospitalization, use of glucocorticoids and/or IVIG, and time interval from treatment, and observed a negative correlation between length of hospitalization and levels of most soluble biomarkers in patients who had received glucocorticoids, irrespective of whether IVIG was administered or not (Figure S4B-C). Levels of LBP correlated more closely with other inflammatory biomarkers in patients treated with both glucocorticoids and IVIG than in those treated with glucocorticoids only (Figure S4B-C). Furthermore, random forest regression analysis identified LBP as a variable of higher predictive importance in patients who received both glucocorticoids and IVIG (Figure S4D), suggesting that the addition of IVIG may play a role in controlling signs of septic shock, of which LBP is a biomarker [22].
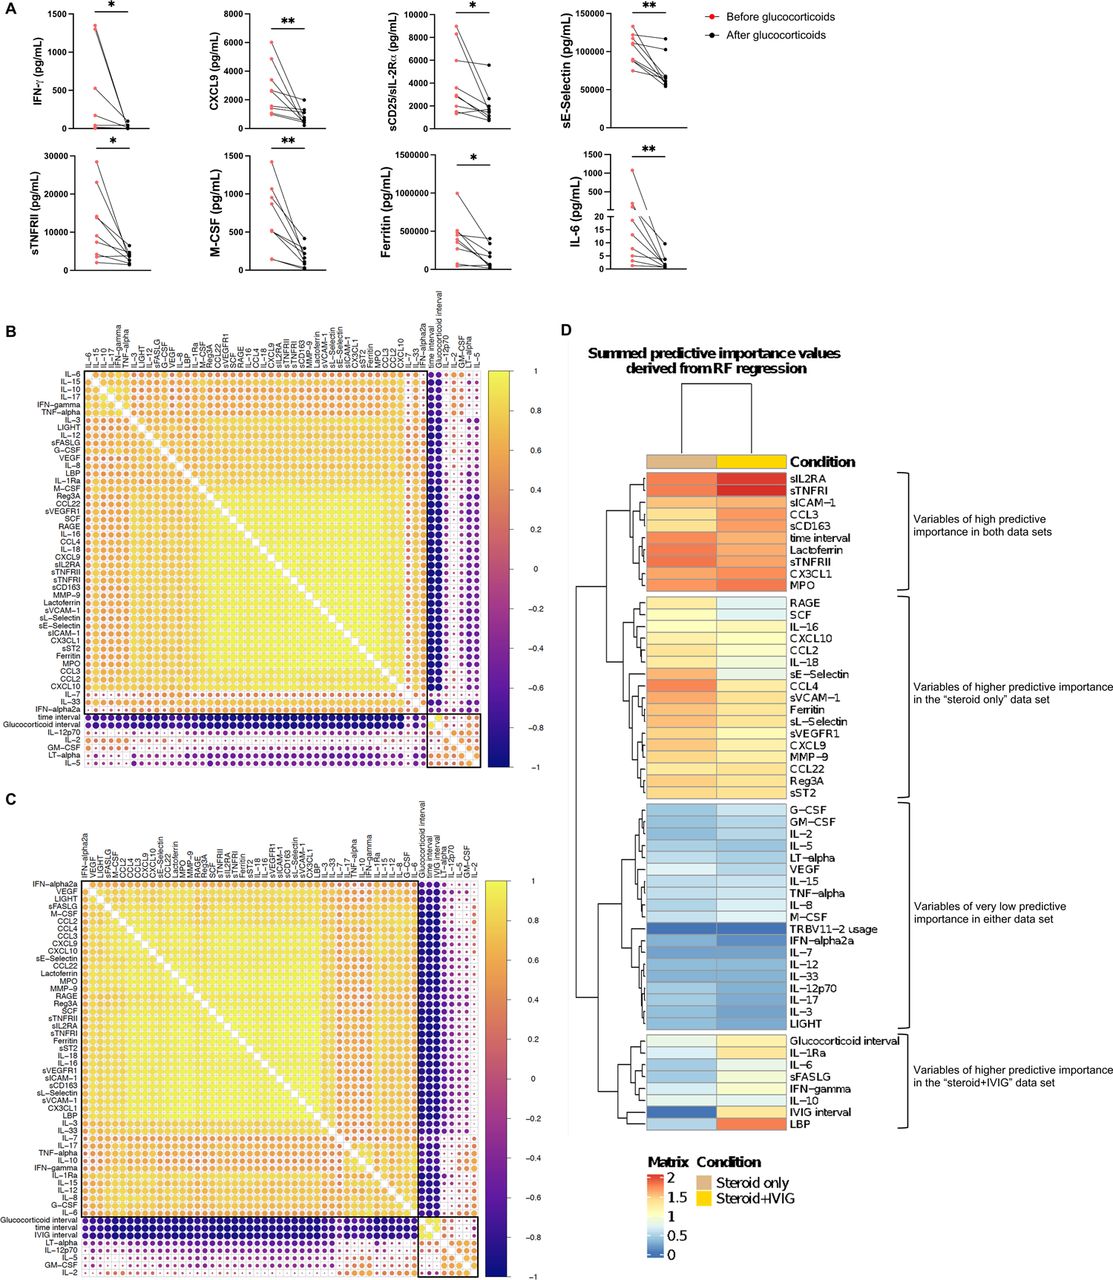
A) Biomarker changes following systemic glucocorticoids in 9 MIS-C patients. Samples were drawn at a median of 1 day (IQR −1.5, 0) prior to (red circles) and 6 days (IQR 2.5, 10) after (black circles) glucocorticoid administration. Biomarkers associated with Type II interferon (IFN) signaling (IFN-γ, CXCL9), T cell activation (sCD25/IL-2Rα), cellular adhesion (sE-Selectin) and monocyte/macrophage activation (TNFRII, M-CSF, Ferritin, IL-6) are shown. Mann-Whitney test was used for comparisons. *p<0.05, **p<0.01. B-C) Pearson correlation coefficients between biomarkers, time interval from admission and time interval from treatment in 59 samples from 25 patients who received systemic glucocorticoids but not IVIG (panel B) and in 102 samples from 37 patients who received both systemic glucocorticoids and IVIG (panel C). Biomarkers and the time interval variables are ordered by hierarchical clustering (with complete linkage) based on their overall correlation patterns that are visualized with the corrplot package in R. D) Summed predictive importance values derived from random forest regression of soluble biomarker values in 59 samples obtained at various time points after hospitalization from 25 MIS-C patients who received systemic glucocorticoids but not IVIG (left column) and in 102 samples from 37 MIS-C patients who received both systemic glucocorticoids and IVIG (right column). In each random forest regression model (composed of 1000 decision trees with one model per target), predictive importance value for each predictor-target pair is computed using the algorithm described in Huynh-Thu et al [See: Methods].
Multimodal single cell profiling of MIS-C and pCOVID-19 reveals distinct immune cell signatures
To better understand and compare the cell type specific gene expression profile of MIS-C and pCOVID-19, we performed single-cell CITE-seq [23, 24] simultaneously measuring 188 surface proteins, transcriptome, and BCR/TCR V(D)J in single peripheral blood mononuclear cells from 7 MIS-C, 8 pCOVID-19 and 7 age- and sex-matched pHC. Two longitudinal samples were available for 3 MIS-C patients. We also performed CITE-seq profiling on sorted non-naïve T and B cells to enhance TCR and BCR clonality analysis. We performed unsupervised clustering using the denoised and scaled by background (DSB)-normalized 188 surface protein markers (see Methods) to derive 24 annotated coarser level cell populations (Figure 4A). We integrated the CITE-seq data with previously published aCOVID-19 datasets by doing cell-cluster label transfer [24, 25]. The predicted transferred labels are largely concordant with the annotations (Figure S5A). As shown in Figure S5B, the frequency of non-classical monocytes was reduced in MIS-C patients; a similar pattern was observed in aCOVID-19, and especially in those with more severe disease [24]. Furthermore, reduced frequencies of plasmacytoid dendritic cells (pDC) were detected in aCOVID-19 (especially in severe disease) and a similar trend was observed in MIS-C. The proportion of pDCs was not altered in pCOVID-19, which could explain the elevated type I IFN responses in pCOVID-19 compared to aCOVID-19 [26]. Another characteristic of pCOVID-19 was the increased frequency of CD8+ memory T cells, which was also noted in adults with less severe disease (Figure S5B).

A) CITE-seq label transfer from previous adult COVID-19 experiments. Heatmap shows the overlap percentage of predicted markers from label transfer and annotated cell populations in this pediatric dataset. B) Frequencies of immune cell clusters for non classical monocytes, plasmacytoid dendritic cells (pDC) and CD8 memory T cells in adult healthy controls (aHC), adult patients with less severe (disease severity matrix low, DSM_low) COVID-19, adult patients with more severe (DSM_high) COVID-19, pediatric HC (pHC), pediatric COVID-19 (pCOVID-19) and MIS-C patients. P values shown are Wilcoxon test between indicated two groups. Adult COVID-19 data are from Liu et al, 2021 (see Methods). To avoid potential batch effects of independently annotated adult and pediatric populations, cell frequencies of pediatric dataset shown were obtained by label transfer from adult data (See Methods). C) From left to right: Monocyte RNA expression clusters, surface CD163 expression and S100A inflammatory gene expression in all three groups (pHC, pCOVID-19 and MIS-C) D) Gene Set Enrichment Analysis of pCOVID-19 vs. pHC at timepoints within 40 days of admission. Selected gene sets are grouped into functional/pathway categories. Dot color denotes normalized gene set enrichment score and size indicates –log10(adjusted p value). P values were adjusted using the Benjamini-Hochberg method.

A) UMAP visualization of single cell clusters based on protein expression profiles. B) Gene set enrichment analysis (GSEA) of MIS-C versus pHC (left), and MIS-C versus pCOVID-19 (right), at timepoints within 40 days of admission. Selected gene sets are grouped into functional/pathway categories. Dot color denotes normalized gene set enrichment score and size indicates –log10(adjusted p value). P values were adjusted using the Benjamini-Hochberg method. C) Gene set enrichment analysis (GSEA) result of pCOVID-19 vs. pHC (top) and MIS-C vs. pHC (bottom) based on the association with time (days since admission), only showing the type I IFN related response signatures. D) Heatmap of HALLMARK_TNFa_Signaling_via_NFkB gene set in CD4+ Memory T cells and Classical Monocytes. Heatmap showing the scaled average mRNA expression of leading-edge (LE) genes from the GSEA analysis of MIS-C vs. pCOVID-19. Shared LE genes and selected top LE from both cell types are labeled by gene symbol. The shared LE genes are annotated on the right column. Subjects are grouped by pHC, pCOVID-19 and MIS-C classes, and columns are ordered by days since admission; also shown are the days since admission of each sample (top of the heatmaps). E) Per-sample gene set signature scores of the HALLMARK_TNFα_Signaling_via_NFκB gene set in selected cell populations. Gene set scores were calculated using the gene set variation analysis of leading-edge genes from the MIS-C vs. pCOVID-19 model (See Methods). P values shown are adjusted p values from GSEA result in (B). MIS-C, multisystem inflammatory syndrome in children; pCOVID-19, pediatric COVID-19; pHC, pediatric healthy controls.
We next systemically assessed cell type specific transcriptional changes among pHC, pCOVID-19, and MIS-C (Figure 4B and Figure S5D). Linear models incorporating the primary variables of interest, including age and time effects (in MIS-C versus pCOVID-19), were fit for the “pseudobulk” gene expression values for each cell cluster/subset (see Methods). GSEA was then performed based on ranked differential expression genes to search for enriched biological pathways [27]. Strong T and B cell activation signatures were observed in both pCOVID-19 and MIS-C groups compared to pHC, together with increased antigen presentation in both innate and adaptive cell populations (Figure 4B and Figure S5D). Consistent with a recent report of increased cytotoxicity of NK cells in MIS-C patients [13], we also observed enrichment of the gene set “KEGG_Natural_Killer_cell_mediated_cytotoxicity” in CD16hi NK cells from MIS-C patients (Figure 4B, left panel). This enrichment signal was mainly driven by “leading edge”(LE) genes such as KIR2DL3, KIR3DL2, IFNGR1, CD244, LCK, and FASLG. CD16hiNK cells in pCOVID-19 did not have this signature (Figure 4B, left panel and Figure S5D).
Type I IFN signatures (including gene signatures induced by live viral challenge/vaccination [28, 29]) were strongly elevated in almost all immune cell subsets in pCOVID-19 but only in a few MIS-C adaptive cell populations; MIS-C exhibited broadly lower type I IFN signatures across cell types compared to pCOVID-19 (Figure 4B and Figure S5D). Consistent with our prior CITE-seq analysis in adults [24], time effect analysis (using CITE-Seq data from samples collected at various time points during hospitalization) hinted that the type I IFN signature in pCOVID-19 decreased over time in most cell types (Figures 4C).
Although classical monocyte cell frequencies were similar, the mRNA based uniform manifold approximation and projection (UMAP) visualization of monocytes showed separation among pHC, pCOVID-19, and MIS-C (Figure S5C, left panel). Specifically, MIS-C monocytes showed significantly higher levels of CD163 expression and of several S100A family inflammatory genes; the latter were also increased (although to a lesser degree) in pCOVID-19 monocytes compared to pHC (Figure S5C, middle and right). However, classical monocytes from MIS-C patients showed repressed inflammatory signatures (HALLMARK_TNFα_via_NFκB signaling and HALLMARK_inflammatory response pathways/gene sets) compared to both pCOVID-19 and pHC (Figures 4B, D and E); this decrease was driven by LE genes such as CXCL3, DUSP2, JUNB, IL1B, ICOSLG and IL15RA. Together with the more repressed type I IFN signatures in monocytes (Figures 4B and S5D), these data indicate an attenuated inflammatory state of MIS-C monocytes [28], which could partly be due to steroid and IVIG use. Intriguingly, the lymphocytes (CD4+ and CD8+ T cells and NK cells) and DC populations tended to have lower inflammatory signatures instead in pCOVID-19 than both MIS-C and pHC: e.g., pCOVID-19 had lower LE gene signature scores (of the HALLMARK_TNFα_via_NFκB signaling gene set) compared to MIS-C and controls (Figures 4B, D and E and S5D). This repressed inflammatory gene signatures in non-monocyte populations in pCOVID-19 could point to unique response mechanisms in children compared to adults.
TRBV11-2 usage is higher in MIS-C CD4+ T cells and decreases over time
Bulk high throughput sequencing of TCRβ (TRB) repertoire was performed to analyze the breadth of the SARS-CoV-2 specific TCR repertoire by identifying exact CDR3 amino acid sequence matches between the SARS-CoV-2-specific sequences previously reported in the ImmuneCODE database and our dataset, as previously described (See Methods). Breadth values represent the fraction of TRB clonotypes that are SARS-CoV-2 specific in each repertoire. By analyzing the TCR repertoire from blood samples obtained at various time intervals from onset of symptoms and hospitalization, we observed a modest increase in breadth of SARS-CoV-2 specific clonotypes in MIS-C and pCOVID-19 compared to pHC (Figure S6A), indicating that SARS-CoV-2 had not induced an increased proportion of unique SARS-CoV-2-specific CDR3 clonotypes in infected children.

A) Breadth of SARS-CoV-2 specific TRB clonotypes in pediatric healthy controls (pHC), pediatric COVID-19 (pCOVID-19) and MIS-C patients. B) Ratio of SARS-CoV-2 specific CDR3 clonotypes among unique TRBV11-2-positive versus TRBV11-2-negative clonotypes in pHC, pCOVID-19 and MIS-C. C) Frequencies of TRBJ gene usage among TRBV11-2-positive clonotypes in pHC, pCOVID-19 and MIS-C. ns, not significant. D) CDR3 length of TRBV11-2-positive clonotypes (weighted by clonotype abundance) in pHC, pCOVID-19 and MIS-C. E) Correlation between frequency of TRBV11-2 clonotypes and soluble biomarker levels. F) Pearson correlation coefficient values between indicated variables. Analysis conducted on 91 samples collected at various time points after hospitalization from 56 MIS-C patients who received glucocorticoids. Time interval is defined as days since admission; glucocorticoid interval is defined as days since initiation of systemic administration of glucocorticoids. G) Pairwise interaction strengths derived from random forest analysis. Columns identify predictors, and rows correspond to targets. Input data are the same as in panel F.
High-throughput sequencing analysis of TRB Variable (TRBV) gene usage revealed markedly increased frequency of TRBV11-2 clonotypes in MIS-C (Figure 5A), confirming previous reports [13, 14, 30, 31]. Interestingly, such increased frequency of TRBV11-2 clonotypes was restricted to MIS-C samples that were collected soon after hospitalization, whereas a rapid decline in the proportion of TRBV11-2 clonotypes was observed thereafter (Figure 5B), as also reported by others [31]. Both the increased TRBV11-2 usage and the progressive decline in the frequency of TRBV11-2 clonotypes were confirmed in CITE-seq profiling of CD4+ T cells (Figure 5C) and total T cells of MIS-C patients. Computational analysis revealed enrichment of unique SARS-CoV-2 specific CDR3 clonotypes among TRBV11-2 positive clonotypes in all groups (MIS-C, pCOVID-19, pHC); however, such enrichment was significantly lower in MIS-C compared to pCOVID-19 and pHC (Figure S6B). In silico structural modeling had previously shown that TRBV11-2 binds through its CDR2 (and not CDR3) region to a superantigen-like motif in the SARS-CoV-2 Spike protein [14, 30, 32].

A) TRBV gene usage, defined as the fraction of unique clonotypes per sample in which a given TRBV gene is present. Genes only present among clonotypes with ambiguous gene assignments are excluded from the figure. Non-parametric Kruskal-Wallis test was used for statistical testing to compare the three groups, resulting in a single p value per gene. ns: p > 0.05 (not significant), *: p<=0.05, **: p<=0.01, ***: p<=0.001, ****: p<=0.0001. TRBV genes are ordered with respect to their position in the locus. B) TRBV11−2 gene usage observed in MIS−C patients within the first 7 days of hospitalization (in blue) and at later time points (in yellow) during hospitalization. Pearson correlation coefficient (number of days from admission vs. TRBV11−2 gene usage) and its p value are shown for both time intervals. The inset plot in the figure provides a comparison between the TRBV11−2 gene usage distributions in these two-time intervals and a p value derived from the Wilcoxon rank sum test. C) Upper panel: TRBV11-2 usage (TRBV11-2 ratio among each sample) in CD4+ T cells among three groups (pHC, pCOVID-19 and MIS-C) within 40 days of admission. P values shown are Wilcoxon test between indicated two groups. Lower panel: TRBV11-2 usage frequency in MIS-C CD4+ T cells over time (days since admission). Pearson correlation (R) and associated p values are shown. Each dot indicates a sample. D) TRBV11-2 CD4+ T cell single cell level gene expression analysis of MIS-C samples. Heatmap showing the marker genes of TRBV11-2 positive (TRBV11-2pos) CD4+ T cells compared toTRBV11-2 negative (TRBV11-2neg) CD4+ T cells within MIS-C samples. Average log fold change (logFC) threshold 0.2 and p value 0.2 were used for marker gene cutoff. Differentially expressed genes with adjusted p value < 0.2 are marked with an asterisk (*). Comparison was done within MIS-C samples but showing scaled average gene expression level of TRBV11-2neg and TRBV11-2pos CD4+ T cells in all 3 groups (pHC, pCOVID-19 and MIS-C). E) Similar to Figure 5D, TRBV11-2 MIS-C CD4+ T cell single cell level gene expression analysis of cell surface markers. Heatmap showing the marker genes of TRBV11-2pos MIS-C CD4+ T cells compared to TRBV11-2neg CD4+ T cells (including all three groups of PHC, pCOVID-19 and MIS-C children). Average log fold change (logFC) threshold 0.2 and adjusted p value 0.2 were used for marker gene cutoff. F) Gene set pathway enrichment analysis of apoptosis signature in TRBV11-2pos CD4+ T cells from MIS-C patients. Dot color denotes normalized gene set enrichment score and size indicates –log10(adjusted p value). G) Mutation quantification of plasmablasts in the three groups. P values shown are Wilcoxon test between indicated two groups. H) Heatmap showing autoantibodies with the highest variance ordered by fold change, using a cut-off of four-fold change (see Methods). Comparisons were made between pCOVID-19 (n=5), MIS-C that did not receive IVIG (n=6), and MIS-C post-IVIG administration (MIS-C_IVIG, n=4). MIS-C, multisystem inflammatory syndrome in children; pCOVID-19, pediatric COVID-19; pHC, pediatric healthy controls.
High-throughput sequencing of TRB repertoire demonstrated that TRBV11-2 clonotypes of MIS-C patients were characterized by a diverse usage of associated TRBJ genes (Figure S6C) and a broad distribution of CDR3 length (Figure S6D), arguing against oligoclonal expansions.
We also observed that expansion of TRBV11-2 clonotypes in MIS-C positively correlates with levels of IL-15, IL-17, sCD25, IL-18, sTNFRI, and sTNFRII (Figure S6E). A similar correlation between frequency of TRBV11-2 clonotypes and biomarkers of inflammation has been previously reported [14]. Single cell gene expression analysis of these TRBV11-2 CD4+ T cell clones within MIS-C samples showed slightly higher average expression of effector genes like GZMK, PRF1, GZMA, and IL32 compared with other CD4+ MIS-C T cells (Figure 5D). In addition, MIS-C TRBV11-2 CD4+ T cells had increased expression of genes related to the immune cell synapse and adhesion formation including PSMB1, HAVCR2, SIRPG, CTLA4, RAC2, MSN, ITGB2, and SELL, and IL-2 and IL-15 response pathways including SIRPG, IL2RB, and IL2RG. HCST and DUSP2, which show enhanced expression upon T cell activation [33, 34] (Figure 5D). Differential expression analysis on the cell surface markers [CITE-seq antibody data (ADT)] revealed higher expression of T cell co-stimulatory molecules CD28 and CD150 (SLAM) (Figure 5E). Furthermore, the transcriptional signature of TRBV11-2 CD4+ T cells was characterized by increased expression of genes involved in apoptosis (Figure 5F). Together, these results suggest that TRBV11-2 expressing T cells represent a population of cells poised to respond to activating signals and undergo apoptosis. Finally, time interval from use of glucocorticoids negatively correlated with the frequency of TRBV11-2 clonotypes (Figure S6F) and emerged as one of the key factors predictive of reduced TRBV11-2 gene usage over time (Figure S6G).
It has been previously shown that MIS-C patients with a severe clinical phenotype and expansion of TRBV11-2 share the combination of HLA class I alleles A2, B35 and C04, indicating a possible contribution of HLA-mediated restriction in the process of TRBV11-2 expansion [30]. To determine whether a similar association was found in our patient cohort and avoid confounding factors due to different frequencies of HLA alleles in different ethnic groups, we restricted our analysis to a sub-cohort of Italian patients only (MIS-C, n=9; pCOVID-19, n=18; pHC, n=11). The A*02, B*35, C*04 allele combination was present in 5 of the 9 MIS-C and in none of the 18 pCOVID-19 and 11 pHC (Table S3, p=0.002). Of note, the combination of HLA A*02, B*35, C*04 allele was not associated with severity of the MIS-C phenotype, as it was found in 4 patients with moderate and one child with severe disease. Finally, MIS-C patients with the combination of HLA A*02, B*35, C*04 allele had a higher frequency of TRBV11-2 clonotypes compared to other MIS-C patients (0.143 ± 0.114 vs. 0.054 ± 0.017), although this difference was not statistically significant (p=0.34 with Mann-Whitney U test). Altogether, these data suggest a possible contribution of HLA alleles to the development of MIS-C.
HLA allele composition in Italian patients with MIS-C compared to children with COVID-19 and healthy children
MIS-C B cells show altered BCR immunoglobulin heavy chain (IgH) usage pattern and higher mutation load associated with B cell activation
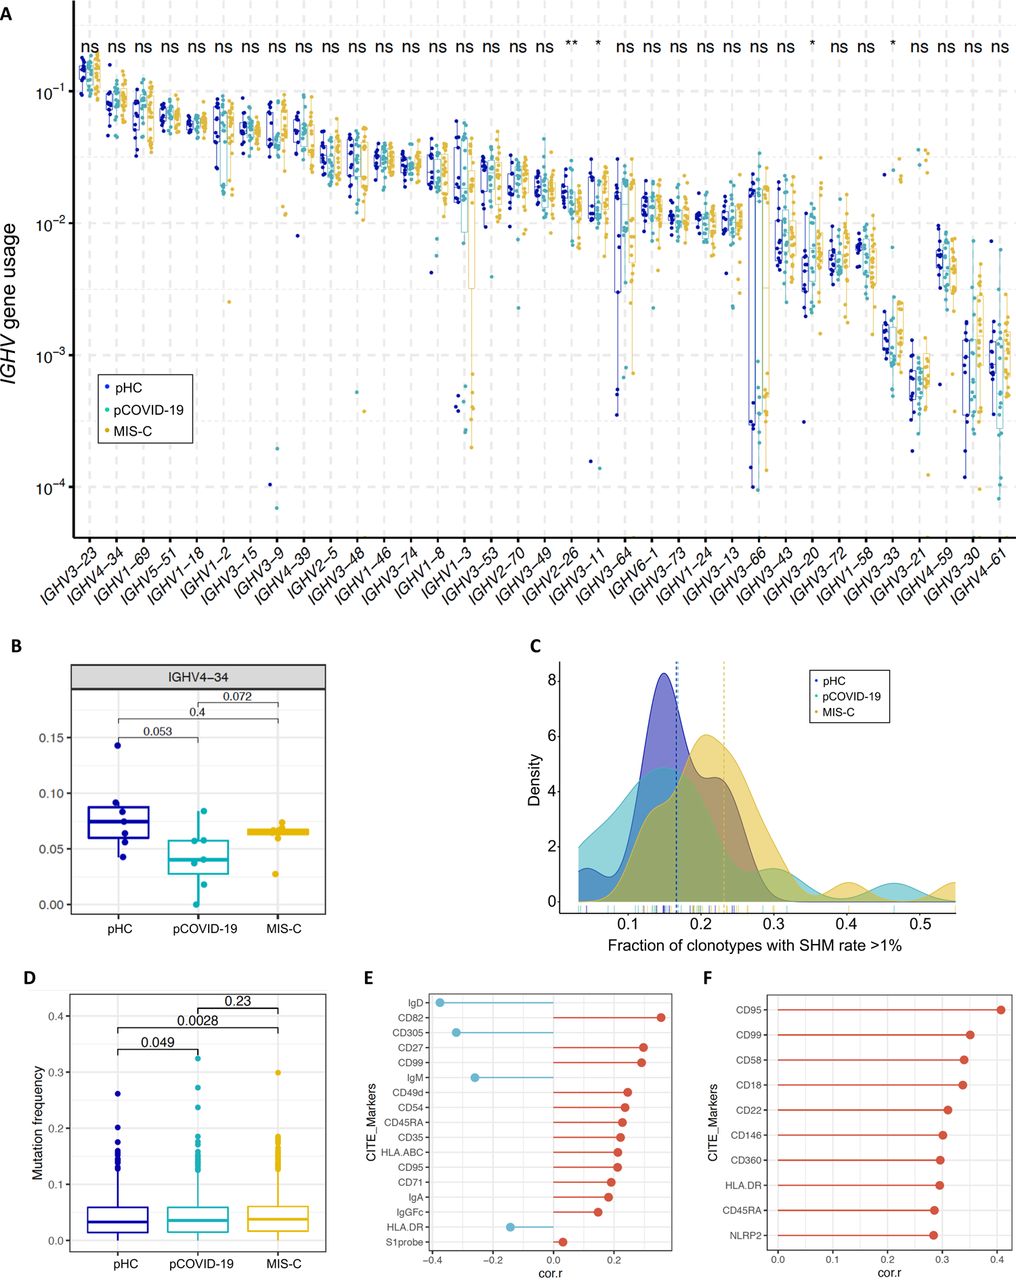
Previous studies have documented B cell abnormalities in severe aCOVID-19 and in MIS-C, with increased number of IgD-CD27-CD11c+ cells in the former [35] and of plasmablasts in both conditions [35, 36], skewed usage of IGH Variable (IGHV) genes, with increased frequency of IGHV4-34 and IGHV4-39 clonotypes [14, 35], and autoantibodies against a variety of self-antigens [12–14]. To further investigate the possible contribution of B cells in the pathophysiology of pCOVID-19 and MIS-C, we performed high throughput IGH repertoire sequencing in 13 pHC, 15 pCOVID-19, and 19 MIS-C. No major differences in the usage of IGHV genes (including IGHV4-34) were observed in the three groups (Figure S7A-B). We next examined the mutation frequency of immunoglobulin (Ig) genes. High-throughput sequencing identified an increased rate of somatic hypermutation (SHM) among MIS-C IGHV clonotypes (Figure S7C). CITE-Seq analysis revealed similar mutation frequencies in memory B cells (Figure S7D) but an increased frequency of SHM in plasmablasts (Figure 5G). We then searched for B cell surface markers correlating with mutation frequencies within memory B cells, and identified several markers associated with B cell activation: lower IgD, CD305, and IgM, and higher CD27, CD95, CD71, and CD99 [37–39] (Figure S7E). In addition, activation markers including CD95, CD99 and HLA-DR positively correlated with mutation frequency in plasmablasts (Figure S7F).

A) Usage of IGHV genes in pediatric healthy controls (pHC), children with acute COVID-19 (pCOVID-19) and MIS-C. ns, not significant. B) Frequency of IGHV4-34 B cell clonotypes in pHC, pCOVID-19 and MIS-C. C) Fraction of IGHV clonotypes with a somatic hypermutation (SHM) rate >1% among unique clonotypes identified by high-throughput sequencing. D) Quantification of somatic hypermutation in memory B cells from pHC, pCOVID-19 and MIS-C patients. P values shown were obtained by applying Wilcoxon test between indicated two groups. E) B cell surface markers correlating with mutation frequency in memory B cells from MIS-C patients. Pearson correlation values are shown. Top 10 and a few selected significant markers are shown. S1 probe: SARS-CoV-2 spike protein probe. F) Cell surface markers correlating with mutation frequency in plasmablasts from MIS-C patients. Pearson correlation values are shown. Top 10 significant markers are shown.
To investigate the presence of autoantibodies, we used the human proteomic (HuProtTM) assay comparing 10 MIS-C samples (4 with and 6 without prior IVIG treatment) to 5 pCOVID-19. We detected several autoantibodies in MIS-C, including previously reported TROVE2/Ro60 and ATP4A [14] (Figure 5H). However, positivity was mostly evident in MIS-C samples drawn after IVIG administration, suggesting that IVIG could be a confounding factor in the evaluation of the presence of autoantibody in MIS-C. Pre-existing neutralizing autoantibodies targeting IFN-α and/or IFN-ω are frequently detected in critical aCOVID-19 [8]. To investigate whether such autoantibodies are also present in children, we screened serum from pHC (n=53), pCOVID-19 (n=70), and MIS-C (n=40) for autoantibodies against IFN-α, IFN-β, IFN-ω, and IFN-γ. Low levels of immunoreactivity were detected in 1 pHC, 5 MIS-C and 5 p-COVID-19, but none of these samples blocked IFN-α, IFN-β, IFN-ω, or IFN-γ-induced STAT1 phosphorylation in healthy donor peripheral blood mononuclear cells.
Discussion
Defining the pathophysiology underlying distinct phenotypes of SARS-CoV-2 related diseases in children represents an important medical need. Here, by applying a multi-omics approach to a relatively large cohort of patients from multiple centers and of various ethnicities, we have demonstrated that pCOVID-19 and MIS-C have distinctive biomarker signatures, with MIS-C presenting higher and qualitatively different inflammatory activation compared to pCOVID-19. Innate immune responses, and in particular type I IFN-dependent signaling, play a critical role in controlling replication of respiratory tract viruses early after infection [40]. Consistent with this, it has been shown that pre-activated antiviral innate immunity in the upper airways controls early SARS-CoV-2 infection in children [26]. Defective IFN-α responses have been demonstrated in severe aCOVID-19 [41, 42], and it has been hypothesized that higher IFN-α levels may be responsible for the milder course of pCOVID-19 [43]. Our observations of intact frequencies of pDCs in pCOVID-19, associated with robustly elevated IFN-α2a levels and increased expression of type I IFN-dependent genes in peripheral blood samples collected within 7 days from onset of symptoms, support this hypothesis. None of the pCOVID-19 and MIS-C patients had neutralizing autoantibodies to type I IFN, which are associated with life-threatening aCOVID-19 [8]. However, this issue should be revisited using a more sensitive assay that has been recently described to detect these autoantibodies [8].
The identification of decreased IL-33 and CCL22 levels as distinctive features of pCOVID-19 and MIS-C, respectively, represents a novel finding of our study which needs validation in other cohorts. IL-33 is a member of the IL-1 cytokine family and is released mainly by epithelial cells upon infection, cell damage or exposure to allergens through a caspase 8-ripoptosome-dependent process [44, 45]. High IL-33 levels are increased in children with severe viral and bacterial infections [46–49]. We have previously reported increased IL-33 levels in critical aCOVID-19, whereas patients with moderate disease tended to have lower levels compared to aHC [19]. This difference, and the low IL-33 levels detected in pCOVID-19 (even when adjusted for the presence of allergic diseases) may be indicative of modest respiratory epithelium cell damage. CCL22 is a homeostatic chemokine that promotes regulatory T cell migration and function [50]. By dampening regulatory T cell responses, low CCL22 levels in MIS-C may favor uncontrolled inflammation. Importantly, both IL-33 and CCL22 are involved in Th2 responses. In particular, IL-33 promotes allergic inflammation by binding to its receptor (ST2) on the surface of Th2 lymphocytes and innate lymphoid type 2 (ILC2) cells [51]. CCL22 expression is induced by Th2 cytokines; upon binding to CCR4 on the surface of Th2 cells, it promotes Th2 cell trafficking [52]. Both IL-33 and CCL22 are negatively regulated by IFN-γ, which reduces the half-life of IL-33 through activation of the LMP2 proteasome [53] and inhibits CCL22 expression [54]. Along with increased levels of IFN-γ in MIS-C (and to a lesser extent in pCOVID-19), these observations indicate that SARS-CoV-2 infection in children triggers Th1 and suppresses Th2 responses.
In our study of MIS-C, consistent with previous observations [11–13, 15], we have demonstrated elevated levels of multiple soluble biomarkers associated with recruitment and activation of monocytes and neutrophils, vascular endothelium injury, matrisome activation, gastrointestinal and cardiac involvement, and septic shock. Activation of matrisome which encompasses proteins associated with the extracellular matrix including the endothelium [18], and increased levels of biomarkers indicative of endothelial cell damage in MIS-C, mirror what is observed in various vasculitides, including KD [55]. Together with the activation of the IL-33/ST2 axis, these markers may be useful in monitoring vascular and cardiac pathology in MIS-C.
In addition, CITE-Seq analysis revealed a MIS-C monocyte signature characterized by increased expression of several members of the S100A family of alarmins and of the scavenger receptor CD163 in comparison to pHC. However, MIS-C monocytes had lower type I IFN and NF-κB/inflammatory signatures and repressed antigen presentation genes, which were phenotypically similar to the inflammatory attenuated monocytes reported in severe aCOVID-19 [56]. The routine use of glucocorticoids and IVIG in MIS-C patients may have contributed to this anti-inflammatory state. In contrast, pCOVID-19 showed elevated inflammation and antigen presentation in monocytes compared to pHC, similar to mild aCOVID-19 [56]. However, while cellular activation signatures were apparent in non-monocyte populations like T cells, NK cells, and DCs of pCOVID-19 compared to pHC, these cells showed repressed expression of NF-κB/inflammatory genes, including genes like IL1B, JUN and IL15RA. This intriguing activated cellular state with repressed inflammatory genes might point to a unique response state in children, who tend to have asymptomatic or mild disease. For example, robust innate and adaptive responses were able to suppress and control viral load early and thus negative feedback circuits could have been triggered to avoid inflammatory overshoot by the time these patients were sampled.
By performing correlation strength and pairwise interactions, we have resolved the effect of time and treatment on the trajectory of soluble biomarkers of inflammation in MIS-C and demonstrated a rapid effect of glucocorticoids on levels of many soluble biomarkers. Use of IVIG had a significant impact on a limited number of biomarkers, among which LBP. To our knowledge, this is the first time that the specific effects of glucocorticoids and IVIG on MIS-C inflammatory biomarkers have been investigated.
High throughput sequencing of TRB revealed a similar breadth of SARS-CoV-2 specific clonotypes in pCOVID-19 and pHC. Previous studies have demonstrated that younger individuals have pre-existing CD4+ T cells to human endemic β-coronavirus that are cross-reactive to SARS-CoV-2 Spike protein [57]. These cross-reactive CD4+ T cells, whose frequency decreases with age [57], may also help contain virus replication, limiting at the same time the development of a larger pool of newly generated SARS-CoV-2 specific T cells in children with pCOVID-19. Consistent with this, a similar breadth of SARS-CoV-2 specific CDR3 clonotypes was also observed in children with MIS-C, several weeks after infection.
While no skewing in the usage of TRBV genes was observed in pCOVID-19, we have confirmed and extended previous observations demonstrating increased TRBV11-2 usage in MIS-C, and the polyclonal nature of TRBV11-2 expressing T cells [30, 32]. Structural modeling has suggested that amino acid residues within the CDR2 region encoded by the TRBV11-2 gene may bind to a superantigen-like motif at the C-terminal region of the Spike S1 subunit in a CDR3-independent manner [30, 32]. In this regard, it is interesting that high levels of soluble Spike protein were found in MIS-C patients. CITE-Seq analysis demonstrated that TRBV11-2 CD4+ T cells expressed higher levels of CD150 and CD28 on their surface, and their transcriptional profile was characterized by higher expression of genes involved in cell adhesion, activation and of the mitochondrial pathway of apoptosis. The proportion of TRBV11-2 clonotypes positively correlated with levels of various inflammatory biomarkers, and both the frequency of TRBV11-2 clonotypes and levels of most of these biomarkers decreased within 1-2 weeks after use of glucocorticoids. It is known that glucocorticoids preferentially mediate apoptosis of activated T cells, predominantly through the mitochondrial pathway [58–60]. We hypothesize that this is the mechanism leading to rapid decrease of TRBV11-2 clonotypes following use of glucocorticoids in MIS-C.
We have confirmed recent findings that MIS-C is associated with presence of the HLA-A2, C04, B35 alleles [30]. However, in our study, this association was independent of the severity of the disease and of the frequency of TRBV11-2 clonotypes. These observations argue for a genetic basis of susceptibility to MIS-C, but the precise mechanisms involved remain to be defined.
Finally, several studies have reported on the possible role of B cells in the pathogenesis of MIS-C, including an increased usage of IGHV4-34 [10, 14] (a gene associated with self-reactivity [61]) and a broad spectrum of autoantibodies directed against gastrointestinal, endothelial, cardiac and immune cell antigens [11–14]. In our study, we did not observe an increased frequency of IGHV4-34 clonotypes. However, we demonstrated an increased SHM rate in plasmablasts in MIS-C, correlating with increased expression of several activation markers on the cell surface of both memory B cells and plasmablasts. We also confirmed the presence of several autoantibodies. However, autoantibody positivity was largely restricted to samples obtained after IVIG administration, suggesting that use of IVIG is an important confounding factor. Similar observations have been recently obtained both in MIS-C and in KD (Burbelo P.D. et al., manuscript in preparation).
This study has some limitations. Only a few children with severe pCOVID-19 were included in the study, and therefore the results obtained may not apply to rare cases of life-threatening disease in children. We did not have longitudinal samples available for all MIS-C patients. However, the number of patients included in the study was sufficient to detect early and late signatures of the disease. Finally, while an increasing number of cases of pCOVID-19 due to the delta variant have been recently reported [62], almost all samples were collected prior to the emergence of this variant. Therefore, the impact of the delta variant on innate and adaptive immune responses in children with pCOVID-19 and MIS-C remains to be studied. Despite these limitations, this study has helped identify novel age-, time- and treatment-related immunopathological signatures that characterize MIS-C and pCOVID-19.
Data Availability
This manuscript will be submitted for peer-review and metadata will be included in this submission.
Funding
This work was supported by the Division of Intramural Research, National Institute of Allergy and Infectious Diseases and National Institute of Dental and Craniofacial Research, National Institutes of Health (grant ZIA AI001270-01 to LDN and ZIA AI001265 to HCS), by Regione Lombardia, Italy (project “Risposta immune in pazienti con COVID-19 e co-morbidità” to RC, AL, DM, GLM for Pavia, Italy and LI and AS for Brescia, Italy), by ANID COVID 0999, Fondecyt n° 11181222 (to MCP, Chile). In addition, this project has been funded in part with federal funds from the National Cancer Institute, National Institutes of Health, under Contract No. 75N91019D00024 (to DBK). The content of this publication does not necessarily reflect the views or policies of the Department of Health and Human Services, nor does mention of trade names, commercial products, or organizations imply endorsement by the U.S. Government. Moreover, the opinions and assertions expressed herein are those of the authors and are not to be construed as reflecting the views of Uniformed Services University of the Health Sciences or the United States Department of Defense. RC is a participant in the USA National Institutes of Health (NIH) Graduate Partnership Program between NIH and the University of Pavia, Italy. SV is funded by The Finnish Medical Foundation and Orion Research Foundation sr.
Author Contributions
KS, RC, SV, CL performed experiments, analyzed data, wrote and reviewed the manuscript and prepared figures and tables; OMD, CO, SA, FB, AADJ, LBR, ES, FP, DLF, DG, VO, JC, BAS, TH, MA, DBK, MSL, and RG-M performed experiments, analyzed results and contributed to the writing of the manuscript; KD, YZ, MB, TK, and JJD coordinated collection, processing and cataloguing of samples; SMH supervised analysis of autoantibodies; JL analyzed HLA typing; ALS and CLD performed DNA extraction and genomic sequencing allowing resolution of HLA alleles; IMK and TMS performed high-throughput sequencing of TCR and BCR repertoire; PDB and JIC performed serology studies; AC analyzed autoantibody data; MSV analyzed data; GAMS, KB, MAS and MM reviewed clinical metadata; ER, CV, MCP, AL, DM, GLM, FL, UR, VD, ALV, AG, EME, LI, AS, AB, SM, DG and MT consented patients, provided biological specimens and clinical metadata; HCS coordinated with LDN collection and processing of the samples and the research project overall; JST supervised CITE-Seq experiments and critically reviewed the draft of the manuscript; LDN coordinated and supervised the research project, wrote and revised the manuscript and prepared figures and tables.
Competing Interests Statement
TH is an employee and shareholder of CDI Laboratories. MA is a consultant for CDI Laboratories and the owner of Biomedical Hosting, LLC. TMS and IMK declare employment and equity ownership with Adaptive Biotechnologies.
Methods
Study population
The study included a total of 181 pediatric patients (≤ 18 years) with clinically and laboratory confirmed MIS-C (n=76), pediatric COVID-19 (pCOVID-19, n=105) and pediatric healthy controls (pHC, n=60). All subjects were recruited following protocols approved by local Institutional Review Boards (IRBs) or from NIH NIAID IRB, as indicated below:
Chile
IRB: Comité Ético Científico Facultad de Medicina Clínica Alemana Universidad del Desarrollo, Santiago, Chile Protocol: 2020-41
Title: Infección por Sars CoV-2 y enfermedad Covid-19: caracterización epidemiológica, clínica, virológica e inmunológica (SARS-CoV-2 infection and COVID-19: Epidemiologic, clinical, virologic and immunologic characterization)
Pavia, Italy
IRB: Ethics Committee of the Fondazione IRCCS Policlinico San Matteo, Pavia
Protocol: 20200037677
Title: Analisi comprensiva della risposta immunitaria innata ed adattativa durante la fase acuta e la convalescenza in COVID-19
Turin, Italy
IRB: Comitato Etico Interaziendale A.O.U. Città della Salute e della Scienza di Torino Protocol: 00282/2020
Title: Immunofenotipo SCiKH
Naples, Italy
IRB: Ethics Committee of the University of Naples Federico II Protocol: 158/20 for all COVID-19 patients
Title: Analisi comprensiva della risposta immunitaria innata ed adattativa durante la fase acuta e la convalescenza dell’infezione da COVID-19 (Comprehensive analysis of the innate and adaptive immune response in acute phase and convalescence of COVID-19 patients)
Brescia, Italy
IRB: Comitato Etico Provinciale
Protocol: NP-4000
Title: Indagini di laboratorio e infezione da COVID-19 - Studio CORONAlab
Monza, Italy
IRB: University of Milano Bicocca – San Gerardo Hospital, Monza and Ethics Committee of the National Institute of Infectious Diseases “Lazzaro Spallanzani”
Protocol: 84/2020
Title: Observational cohort study on the natural history of hospitalized SARS-COV-2 patients: the STORM trial.
Israel
IRB: Hadassah Medical Organization Institutional Review Board (IRB) for studies involving human subjects.
Protocol: HMO-235-20
Title: Collection of blood specimens from patients diagnosed with COVID19, SARS-COV-2 carriers and members of their families, for purposes of monitoring biomarkers and their immune response.
IRB NIAID-NIH
Protocol: 18-I-0041 (NCT03394053)
Title: Investigating the Mechanistic Biology of Primary Immunodeficiency Disorders
IRB NIAID-NIH
Protocol: 18-I-0128 (NCT 03610802)
Title: Send-In Sample Collection to Achieve Genetic and Immunologic Characterization of Primary Immunodeficiencies
For the comparison of pediatric and adult COVID-19 (pCOVID-19 and aCOVID-19, respectively), we used previously published data from our group on biomarkers in aCOVID-19 [1], as well as a cohort of healthy adults. For Nanostring and Spike protein levels, pHC samples were obtained from a cohort of healthy children studied by NIAID Translational Autoinflammatory Disease Studies (TADS) [2].
In the pCOVID-19 cohort, patients with laboratory confirmation of SARS-CoV-2 infection (positive PCR ± anti-S/anti-N serology) in the absence of simultaneous bacterial co-infections (such as acute appendicitis or blood culture-positive sepsis) were enrolled. The severity of the disease was defined as follows: 1) asymptomatic, 2) mild, 3) moderate, 4) severe and 5) critical as per the NIH COVID-19 Treatment Guidelines [3].
MIS-C diagnosis was based on the Center for Disease Control and Prevention (CDC) Health Advisory case definition [4], but only patients with evidence of prior SARS-CoV-2 infection (as determined by positive PCR ± anti-S/anti-N serology) were included. MIS-C patients were divided into moderate (MIS-C-M) and severe (MIS-C-S) groups based on clinical criteria. In particular, as previously reported [5], MIS-C-S patients were defined if they manifested cardiac and/or pulmonary failure (requiring vasoactive medication and/or significant respiratory support with positive pressure or mechanical ventilation).
Demographic, clinical and laboratory features are reported in Table 1.
Measurement of soluble biomarkers
Cytokine, chemokine and other biomarker analysis was performed on EDTA plasma or sera obtained from patients with pCOVID-19 (n=105), MIS-C (n=73) and pHC (n=53). Among the entire cohort, samples from children with pCOVID-19 within 7 days since onset of symptoms (n=55), and from children with MIS-C within 7 days from hospitalization (n=48) were considered to investigate the early phase on these conditions. Because of limited available volume, patient samples were analyzed as single determinations. Duplicate determinations of control samples and samples from pHC yielded coefficients of variation that were normally <20%. Blood samples were centrifuged, and serum or plasma samples frozen immediately in a − 85°C freezer prior to analysis. Levels of soluble biomarkers whose data were concordant between both plasma and sera, were measured as previously described [1]. The 50 soluble biomarkers included: interferon (IFN)-γ, IL-10, IL-2, IL-6, IL-8, TNF-α, GM-CSF, IL-12p40, IL-15, IL-16, IL-17, IL-5, LT-α ( TNF-β), VEGF, CXCL10, CCL22 (MDC), CCL3 (MIP-1α), CCL4 (MIP-1β), IL2Rα (CD25), FASLG, sICAM-1, IL-3, IL-33, RAGE, sL-selectin, sVCAM-1, CD163, CXCL9, G-CSF, IL1RA, IL-18, M-CSF, Reg3A, sST2 (sIL-33R), sE-selectin, CX3CL1, SCF, sVEGFR1, sTNFRII, sTNFRI, LBP, MMP-9, Ferritin, MPO, IFN-α2a, IL-12p70, IL-7, CCL2 (MCP-1), TNFSF14 (Light), and Lactoferrin. In particular, depending on the nature of the analyte, measurements were obtained using the V-PLEX Human Cytokine 30-Plex Kit (Meso Scale Discovery, Rockville, MD) and analyzed on a MESO QuickPlex SQ 120 reader (Meso Scale Discovery, Rockville, MD), or using a customized, magnetic bead-based, multiplex assay (R&D Systems, Minneapolis, MN) according to the manufacturers’ specifications for standards and dilutions, and the magnetic beads were analyzed on Bio-Plex 3D instrumentation (Bio-Rad, Hercules, CS). Standard curves were analyzed using nonlinear curve fitting and unknowns were calculated based on the derived equation. Samples that exceeded the highest standards were reanalyzed at higher dilution dilute until the values fell within the range of the known standards. Two control plasma samples and a control sample spiked with a known quantity of each analyte were analyzed on each plate to assess the inter-plate variation and to determine the effect of the biological matrix on the measurement of each analyte. For most analytes, the control samples had <25% variation from plate to plate, and the recoveries were generally >70%.
Spike Protein measurement
SARS-CoV-2 spike protein was detected in patient plasma or serum using COVID-19 Spike Protein ELISA Kit and following manufacturer’s instruction (ab274342, Abcam, Cambridge, MA, USA).
SARS-CoV-2 antibody testing
SARS-CoV-2 anti-spike and anti-nucleocapsid antibody testing was performed via luciferase immunoprecipitation systems assay, as previously described [6].
Statistics for Biomarker, SARS-CoV-2 Spike Protein and Antibody Analysis
For the biomarker values that were below the lower limit of detection (LLOQ) the actual measured concentrations were used or, if unavailable and reported as zeros (for 26 of the 50 biomarkers), values were extrapolated as LLOQ divided by two. The exception was made for the comparison of pCOVID-19 and aCOVID-19, due to the absence of LLOQ for the biomarker measurements in adults. Therefore, only values over zeros were used for that analysis.
The univariate analysis comparing biomarkers between or among the subject groups included only values measured in the first seven days from symptom onset for the acute COVID-19 cases or from hospitalization for subjects with MIS-C. The comparison was performed using Mann-Whitney U test (when two groups were compared) or Kruskal-Wallis test (corrected for multiple comparisons) when multiple groups were compared. Biomarkers differing significantly between or among groups were then included in the multivariate model together with age, sex and ethnicity. For the comparison of pCOVID-19 with pHC, allergic conditions (allergic rhinitis, asthma, atopic dermatitis) were also included as a variable in multivariate regression analysis, and. In addition, the analysis was repeated after the exclusion of allergic pHC, with unchanged results.These analyses were completed with IBM SPSS Statistics v.27 and GraphPad Prism version 9 [7].
For the random forest classification, we used Python v. 3.7.9 and the following libraries: pandas==1.2.2, numpy==1.18.5, scikit-learn==0.23.2, matplotlib==3.3.2. Three models were trained with 53 attributes: (Training set size / Validation set size / Accuracy) pHC vs MIS-C (78/ 20 / 95%), MIS-C vs. pCOVID-19 (80 / 20 / 100%) and pHC vs. pCOVID-19 (85 / 22 / 100%).
Trained with Python sklearn library’s RandomForestClassifier object, using parameters: n_estimator=2000, random_state=42 for data set. Results represent the relative importance of the each 53 attribute provided by the model attribute RandomForestClassifier.feature_importances_. Attribute’s direction of influence was based on the increase/decrease of its mean values between compared groups. For the comparison of pHC with pCOVID-19, the classification was then repeated after the exclusion of allergic pHC, with similar results.
NanoString Assay
Total RNA was extracted from whole blood samples collected in PAXgene tubes (Qiagen, Germantown, MD). Gene expression of selected genes was determined by NanoString (NanoString Technologies, Seattle, WA) and a 28-gene type I IFN score and an 11-gene NF-κB score was calculated as previously described [8]. An IFN-γ score was calculated based on 15 IFN-γ-regulated genes [9]. Briefly, the 28-gene type I IFN score is the sum of the z-scores of 28 type I IFN response genes, the 11-gene NF-κB score is the sum of the z-scores of 11 NF-κB target genes and the 15-gene IFN-γ score is the sum of the z-scores of 15 response genes.
Individual gene z-scores were calculated using the mean and standard deviation of the NanoString counts from pHC [2]. Nonparametric two-tailed Kruskal-Wallis test (corrected for multiple comparison) was used for group comparisons and p values below 0.05 were considered statistically significant. Statistical analyses were performed using GraphPad Prism version 8.00 for Mac OS.
SOMAscan® Proteomic Discovery Platform Analysis
SOMAscan®, an aptamer-based proteomics assay, was used to measure 1305 human protein analytes in plasma (SomaLogic, Inc; Boulder, CO, USA). The platform technology is described in Candia et al. [10]. Sample data was normalized to remove hybridization variation within a run. Overall scaling was performed on a per-plate basis to remove overall intensity differences between runs. This was followed by median normalization across the different sample types to remove other assay biases within the run. The statistical analysis of SOMAscan® results was performed using R Studio (R Core Team, 2020) [11], also using a specifically developed webtool for basic data plotting and analysis [12]. For each group comparison, top up- and downregulated proteins have been identified by selecting all the proteins with FDR<0.05 and p value<0.05, and then ordering them according to increased or decreased fold change, expressed in a log2 scale.
Volcano plots show group comparisons, reporting fold change, expressed as a log2 scale, on the x-axis, and the p value, expressed as -log10(p value), on the y-axis. The plot does denote the FDR-corrected significant analytes with red color coding. Pathway enrichment analysis was performed on differentially expressed biomarkers between the groups (pCOVID-19, MIS-C, pHC). The analysis was performed using the Molecular Signatures Database v7.4, part of the Gene Set Enrichment Analysis (GSEA) software, a joint project of UC San Diego and Broad Institute [13]. Heatmaps show the most significantly enriched pathways for every single comparison and the statistical significance is expressed as -log(p value).
Biomarker Interaction Analysis
The potential interactions between all variables in the biomarker and timeline data (MIS-C samples only) were characterized by first scaling the values of each variable (with the scale function in R); then, Pearson correlation coefficients and random forest regression based interaction strengths between the variables were computed. The latter approach allowed us to integrate the biomarker levels with the timeline variables in a multivariate setting, while taking into account the potential linear and nonlinear interactions between all variables. Another advantage of this modeling approach is that it mitigates potential biases that could originate from model misspecification since random forest is designed to identify model structures (decision tree ensembles) optimal for any given data set.
Pearson correlation coefficients were computed using the corr.test function (psych package in R). Biomarkers and the time interval variables are ordered by hierarchical clustering (with complete linkage) based on their overall correlation patterns that were visualized with the corrplot function (corrplot package in R).
Random forest regression models were developed using the GENIE3 algorithm described in Huynh-Thu et al. [14]. Each model was composed of 1000 decision trees that collectively predict a given variable’s value using all remaining variables as predictors. GENIE3 algorithm also identifies a predictive importance value of a given predictor in each predictor-target pair, which is also referred to as the interaction strength [14]. To assess the difference in the overall predictive importance (derived by GENIE3) of each variable with and without IVIG treatment, we summed the interaction strengths associated with each predictor-target pair for a given predictor variable in either treatment condition (steroid treatment applied in both conditions).
The resulting values were visualized using the Complexheatmap package in R. The variables were clustered based on their summed interaction strengths by implementing agglomerative hierarchical clustering with Euclidean distance and complete linkage.
HLA typing
Genomic DNAs were extracted from patients’ whole blood using the QIAsymphony DNA Midi Kit and quantified using a fluorescence dye-based assay (PicoGreen dsDNA reagent) by a microplate reader (Molecular Devices SpectraMax Gemini XS). Whole genome sequencing libraries are generated from fragmented DNA using the Illumina TruSeq DNA PCR-Free HT Library Preparation Kit with minor modifications for automation (Hamilton STAR Liquid Handling System) and IDT for Illumina TruSeq DNA UD Indexes (96 Indexes, 96 Samples) adapters. Sequencing libraries were quantified using the KAPA qPCR Quantification Kit (Roche Light Cycler 480 Instrument II) and combined as 24-plex pools after normalization and sequencing on an Illumina NovaSeq 6000 using a S4 Reagent Kit (300 cycles) using 151+8+8+151 cycle run parameters. Primary sequencing data was demuxed using the Illumina HAS2.2 pipeline and sample-level quality control for base quality, coverage, duplicates, and contamination (FREEMIX < 0.05 by VerifyBamID) was conducted. All sequencing data were then processed with Burrows–Wheeler Aligner (BWA) and the Genome Analysis Toolkit (GATK) best-practice pipeline for alignment and variant call. Samples underwent whole genome sequencing at >=30X median depth. Raw fastq files were trimmed using Trimmomatic v0.39 [15] and mapped to the hg38 human reference genome using BWA-MEM v07.17. PCR Duplicates were marked using Samblaster v0.1.2.5 [16] and GATK4 v4.1.9.0 was used to perform BAM recalibration, and HLA*LA [17] was used to call HLA genotypes.
Bulk TCR and BCR Repertoire
Hypervariable complementarity determining regions (CDR)3 of T-cell receptor (TCR) β-chains and B-cell receptor (BCR) immunoglobulin heavy (IGH) locus present in the human peripheral blood mononuclear cell (PBMC) samples were sequenced in a high-throughput manner using the immunoSEQ assay [18] after amplification of the extracted DNA in a bias-controlled multiplex PCR. The resulting CDR3 sequences were collapsed and filtered to quantify the absolute abundance and frequency of each unique CDR3 region with Adaptive Biotechnologies’ pipeline [19].
Somatic hypermutation (SHM) rate was computed by first matching the germline sequences to IMGT gene identification, flagging the IGH assay mutations (mismatches) to V-gene segments as SHM in the same pipeline. Then, the number of detected SHMs was divided with the number of nucleotides in the region where each SHM set is observed (V gene region) to compute the fraction of clonotypes with >1% SHM rate per nucleotide. The alternative SHM rate metric, which is based on the mutation counts divided by the total number of nucleotides in the V gene region, produced similar results when we compared the SHM rate distributions between the pHC, pCOVID-19, and MIS-C samples.
We computed the TCR repertoire statistics, including gene usage, using Immunarch [20]. SARS-CoV-2-specific breadth and depth of each sample was computed using the approach described in Snyder et al. [19] by utilizing the SARS-CoV-2-specific CDR3 sequences previously reported in the ImmuneCODE database [21].
The R package ggpubr was used for visualization of the results with violin, bubble, box, and density plots, whereas the non-parametric Wilcoxon rank sum and Kruskal-Wallis testing and Pearson correlation calculations (along with regression lines showing the 95% confidence intervals) were also performed with ggpubr. Random forest (RF) regression models were built to compute the interactions between biomarker levels, gene usage, and timeline variables with GENIE3 (GEne Network Inference with Ensemble of trees) [14] using scaled inputs.
CITE-seq Experimental Methods
a) Single cell CITE-seq processing
Frozen PBMC samples were thawed, recovered and washed using RPMI media with 10% FBS and 10mg/mL DNase I (STEMCELL) and then processed as previously described [22] for CITE-seq staining. In brief, samples from different donors were pooled and different timepoints from the same donor were pooled separately so that each pool contains only one timepoint from one donor. PBMC pools were Fc blocked (Human TruStain FcX, BioLegend) and stained with Totalseq-C human ‘hashtag’ antibodies (BioLegend), washed with staining buffer (2% BSA in PBS). A fraction of the combined cells was used for sorting non-naïve T and B cells (see below). For the unsorted cell fraction, hashtagged PBMC pools were combined and cells were stained with a cocktail of TotalSeq-C human lyophilized panel (BioLegend) of 198 surface proteins (plus 6 isotype controls, repository table). Then, cells were washed, resuspended in PBS, and counted before proceeding immediately to the single cell partition step.
b) Sorting of non-naïve B- and T-cell populations
Pooled PBMC samples from different donors were washed with PBS and incubated with Zombie Red Fixable viability dye (1:1000 in PBS, BioLegend, San Diego, CA) for 20 minutes at 4°C protected from light. Then cells were washed with flow staining buffer (10% FBS in PBS) and Fc blocked (Human TruStain FcX, BioLegend) for 15 minutes on ice. The fluorescence-labeled antibody cocktail against human CD45 (APC/Cyanine7), CD3 (AF488), CD19 (APC), CCR7 (BV786), CD95 (BV650), IgD (PerCP-Cy5.5) and CD27(PE/Cyanine7; all antibodies obtained from Biolegend) were added at the end of blocking and incubated for 20 minutes at 4°C in the dark. Cells were washed and sorted on a BD Aria sorter (BD Biosciences, San Jose, CA) in Biosafety Level 3 (BSL3) lab. Non-naïve B cell population were gated by CD45+CD19+IgD- or CD27+ and non-naïve T cell population were gated by CD45+CD3+CCR7low or CD95+.
c) Single cell RNA sequencing
PBMC samples were partitioned into single cell Gel-Bead in Emulsion (GEM) mixed together with the reverse transcription (RT) mix using 10x 5’ Chromium Single Cell Immune Profiling Next GEM v1.1 chemistry (10x Genomics, Pleasanton, CA), as previously described [22]. The RT step was conducted in the Veriti Thermo Cycler (ThermoFisher Scientific, Waltham, MA). Single cell gene expression, cell surface protein, T cell receptor (TCR) and B cell receptor (BCR) libraries were prepared as instructed by 10x Genomics user guides (https://www.10xgenomics.com/resources/user-guides/). All libraries were quality controlled using Bioanalyzer (Agilent, Santa Clara, CA) and quantified using Qubit Fluorometric (ThermoFisher). 10x Genomics 5’ Single cell gene expression, cell surface protein tag, TCR and BCR libraries were pooled and sequenced on Illumina NovaSeq platform (Illumina, San Diego, CA) using the sequencing parameters recommended by the 10x Genomics 5’ v1.1 user guide.
d) Bulk RNA sequencing and single cell sample demultiplexing
For each sample, 100,000-500,000 cells were processed in Trizol using the miRNAeasy micro kit (Qiagen, Germantown, MD) and standard RNA sequencing libraries were generated using Illumina Truseq library preparation kits. The results of bulk RNA sequencing were used for demultiplex of CITE-seq samples by generating SNP calls for each donor. Sequencing results were demultiplexed and converted to FASTQ format using Illumina bcl2fastq software. The sequencing reads were adapter and quality trimmed and then aligned to the human genome using the splice-aware STAR aligner and SNP calls were generated using the previously published protocol [23]. The software package demuxlet [24] was used to then match single cell gene expression data to each donor and identify empty droplets and doublets. Because multiple samples from different timepoints for each donor were collected and could not be demultiplexed by this method alone, ‘hashtag’ antibodies (Biolegend) were used to uniquely label the different time points.
CITE-seq quantification and statistical analysis
a) Single cell data processing and clustering
The single cell data processing, CITE-seq protein data denoise and clustering were performed as described before [22]. Specifically, CellRanger (10x Genomics) version 3.1.0 was used to map cDNA libraries to the hg19 genome reference and to count antibody tag features. Data were further processed using Seurat (v.3.1.0) [25] running in R v3.6.1. After filtering to single cell based on demuxlet output, we further demultiplexed the timepoints using the hashtag antibody staining. We removed cells with less than 250 or greater than 4,000 detected genes, greater than 20% mitochondrial reads, cell surface protein tag greater than 200,000, and hashtag antibody counts greater than 50,000. The protein data was normalized and denoised using the DSB method (Mulè et al., 2020) [available at https://github.com/niaid/dsb]. The following parameters were used in the dsb normalization function: define.pseudocount = TRUE, pseudocount.use = 10, denoise_counts = TRUE, use.isotype.control = TRUE. The DSB-normalized protein data, excluding the isotype control antibodies, were used to generate the Euclidean distance matrix computed for all single cells. Then the shared nearest neighbor (SNN) graph followed by k-nearest neighbors clustering were built using the FindNeighbors and FindClusters functions in Seurat (v3.1.0), respectively. Major cell clusters were then manually annotated using the surface protein together with gene expression.
b) Label transfer for cell annotations
To compare the cell population frequencies directly with aCOVID-19 patients and avoid potential annotation batch effect, the previously published aCOVID-19 dataset [22] was projected onto CITE-seq data—query from this experiment in Seurat (v3.1.0) [25] using FindTransferAnchors function. Log normalization and first 30 PCs were used for the integration. Cell annotations were then predicted using TransferData function and the predicated labels were added to the metadata as predicated.id column.
c) Pseudobulk differential expression and gene set enrichment analysis
Pseudobulk gene differential expression analysis and gene set enrichment analysis were performed as described before [22]. Briefly, all unsorted cells in a given sample were computationally “pooled” according to their cluster assignment by summing all reads for a given gene. Pseudobulk libraries made up by few cells and therefore likely not modeled properly by bulk differential expression methods were removed from analysis for each cell-type separately to remove samples that contained fewer than 5 cells and less than 40000 unique molecular identifier counts detected after pooling. Lowly expressed genes were removed for each cell type individually using the filterByExpr function from edgeR [26]. Differentially expressed genes were identified using the limma voom [27] workflow which models the log of the cpm (counts per million) of each gene. Scaling factors for library size normalization were calculated with the calcNormFactors function with method = “RLE”. Genes were ranked using the moderated T statistics for the relevant coefficient from the limma voom model. Enriched gene sets were identified using the pre-ranked GSEA algorithm implemented in the FGSEA R package [https://www.biorxiv.org/content/10.1101/060012v3]. Gene set list used for enrichment assessment was the same list used in Liu et al., see [22] for details of gene sets. Selected pathways shown in figures were manually curated to select gene sets relevant to immunology and often enriched in several cell-types across the various differential expression comparisons.
d) Models used for differential expression: MIS-C patients and pediatric COVID-19 patients vs. pHCs
Using the pseudobulk limma voom workflow as described in “Pseudobulk differential expression and gene set enrichment analysis”, differentially expressed genes between patient samples (with admission days < 41) and pHC were identified with a model with the following formula in R: ∼ 0 + mis-c_vs_pediatric_healthy + age and ∼ 0 + pediatric_covid_vs_healthy + age, where patient_vs_healthy is a factor variable with two levels. The contrasts.fit function was then used to compare the estimated means between patient and pediatric healthy controls.
e) Models used for differential expression: MIS-C patients vs. pediatric
COVID-19 patients Similarly, differentially expressed genes between MIS-C samples (with admission days < 41) and pediatric COVID-19 were identified with a model with the following formula in R: ∼ 0 + mis-c_vs_pediatric_covid + days_since_admission + age, where mis-c_vs_pediatric_covid is a factor variable with two levels, time effect was considered using the days_since_admission term. The contrasts.fit function was then used to compare the estimated means between MIS-C and pediatric COVID-19.
f) Models used for differential expression: time effect of MIS-C patients and COVID-19 patients gene expression
Differentially expressed genes of MIS-C samples and pediatric COVID-19 samples associated with time respectively, were identified with a model with the following formula in R: ∼ days_since_admission + age. The contrasts.fit function was then used to estimated changes associated with disease time course of MIS-C and pediatric COVID-19 respectively.
g) Gene set module scores Calculation
Selected module scores (gene set signature score) representing enriched pathway activities were calculated for each sample as reported before [22]. Specifically, leading edge genes identified by GSEA from the MIS-C versus pediatric COVID-19 model above were used to enhance signal-to-noise ratio and highlight mainly the differences between MIS-C versus pediatric COVID-19. The pseudobulk gene counts were normalized with the varianceStabilizingTransformation function from DEseq2 (doi:10.1186/s13059-014-0550-8) for the score calculation. The scores were generated using gene set variation analysis (GSVA) method from the GSVA R package (doi:10.1186/1471-2105-14-7).
h) TCR and BCR data processing
CellRanger (10x Genomics) version 3.1.0 was used to assemble V(D)J contigs (https://support.10xgenomics.com/single-cell-vdj/software/pipelines/latest/algorithms/annotation). For TCR data, the V(D)J assignment and clonotype were from 10x CellRanger output of the filtered_contig_annotations.csv file. For BCR data, V(D)J sequencing contigs from 10x CellRanger output was processed using Immcantation v2.7.0 toolbox (https://immcantation.readthedocs.io/en/latest/index.html). IgBLAST and IMGT germline sequence databases and Change-O package [28] were used for sequence alignment and V(D)J annotations. BCR sequence genotype inference and mutation load quantification were performed with reference to the pipeline from Mathew et al. [29] using the TIgGER package [30] and SHazaM package [28]. The TCR and BCR sequence data, contig assignments and estimated BCR mutation frequencies were integrated with the single-cell RNA-seq Seurat object in the metadata.
HuProt™ Autoantibody analysis
Autoantibody analysis was performed using HuProt™ v4.0 human protein microarrays and processed by CDI Laboratories (Baltimore, MD). IgG profiling was performed for 15 serum samples from 5 children with acute COVID19 and 10 children with MIS-C, of whom 4 had received IVIG. Briefly, the arrays were blocked and probed with the samples at a 1:1,000 dilution and incubated at room temperature for 1 hour. Then the arrays were washed and probed with Alexa-647-anti-human-IgG (Fc) for signal detection as previously described. Utilizing CDI software, quantile normalization of the raw signal intensities (F635 median for IgG; F532 median for IgA) was performed on all arrays. The data of several proteins that directly bind with secondary antibodies detected through buffer incubation without any serum were excluded (such as IGHG1, IGHG3 and so on) alongside the controls (such as Rhodamine+IgG64, Anti-human IgG, GST 10ng/ul etc.). The quantile normalized IgG binding intensities of the remaining 23040 protein targets were then visualized using the Morpheus, https://software.broadinstitute.org/morpheus. The T-test was used to compare the different groups and candidates were identified using the following criteria: the variance for the data points was greater than 1000000, the fold-change of average signal intensity was greater than 4 between the 2 groups, and the false discovery rate was <0.5.
Multiplex particle-based anticytokine autoantibody screening assay and functional evaluation
Plasma samples were screened for autoantibodies against IFN-α, IFN-β, IFN-ω and IFN-γ in a multiplex particle-based assay [31], in which differentially fluorescent magnetic beads were covalently coupled to recombinant human proteins (2.5 ug/reaction). Beads were combined and incubated for 30 minutes with diluted plasma samples (1 to 100 dilution). Beads were then washed and incubated with PE-labeled goat anti-human IgG (1 ug/mL) for an additional 30 minutes. Beads were washed again, resuspended in assay buffer, and analyzed on a BioPlex X200 instrument. Plasmas with a fluorescence intensity > 1500 were tested for blocking activity. The blocking activity of autoantibodies was determined by assessing STAT1 phosphorylation in healthy control cells following stimulation with the appropriate cytokines in the presence of 10% healthy control or patient plasma. Surface-stained healthy control PBMCs were cultured in serum-free RPMI medium with 10% healthy control or patient plasma and were either left unstimulated or stimulated with 10 ng/mL of IFN-α, IFN-β, or IFN-ω or 400 units/mL of IFN-γ for 15 minutes at 37°C. Cells were fixed, permeabilized, and stained for intranuclear pSTAT1 (Y701). Cells were acquired on a BD LSRFortessa cytometer, gated on CD14+ monocytes, and analyzed with FlowJo software.
Acknowledgements
We thank the patients, their families, and healthy donors for placing their trust in us. We thank Andrea Catzola, MD, and Luca Pierri, MD, from the Pediatric COVID19 HUB at the University of Naples Federico II, and Evelyn Nuñez, from the Unidad de Inmunología y Reumatología, Hospital de niños Dr. Roberto del Río, for helping with consenting patients and samples collection, without any compensation. We thank CDI Antygen HuProt Division (Baltimore, MD and Mayaguez, PR), and in particular Shuang Liu, Bradley Moore, Shaohui Hu, Pedro Ramos and Oscar Candelario for HuProt™ Autoantibody analysis.
Footnotes
↵† List of participants and their affiliations appear at the end of the paper
References
References
- 1.
- 2.
- 3.
- 4.
- 5.
- 6.
- 7.
- 8.
- 9.
- 10.
- 11.
- 12.
- 13.
- 14.
- 15.
- 16.
- 17.
- 18.
- 19.
- 20.
- 21.
- 22.
- 23.
- 24.
- 25.
- 26.
- 27.
- 28.
- 29.
- 30.
- 31.


