
Abstract
The human cerebral cortex plays a crucial role in brain functions. However, genetic influences on the human cortical functional organizations are not well understood. Using a parcellation-based approach with resting-state and task-evoked functional magnetic resonance imaging (fMRI) from 40,253 individuals, we identified 47 loci associated with functional areas and networks at rest, 15 of which also affected the functional connectivity during task performance. Heritability and locus-specific genetic effects patterns were observed across different brain functional areas and networks. Specific functional areas and networks were identified to share genetic influences with cognition, mental health, and major brain disorders (such as Alzheimer’s disease and schizophrenia). For example, in both resting and task fMRI, the APOE ε4 locus strongly associated with Alzheimer’s disease was particularly associated with the visual cortex in the secondary visual and default mode networks. In summary, by analyzing biobank-scale fMRI data in high-resolution brain parcellation, this study substantially advances our understanding of the genetic determinants of cerebral cortex functions, and the genetic links between brain functions and complex brain traits and disorders.
The human cerebral cortex is the largest part of the human brain and controls complex brain functions. Based on known functional and topographic specializations at different scales, the cerebral cortex of the human brain can be divided into distinct areas and networks, providing insight into the brain’s functional architecture1, 2. To define such brain partitions, a few brain parcellations1, 3–8 have been developed over the past decade9. In functional magnetic resonance imaging10, 11 (fMRI), cerebral cortex functions can be evaluated by measuring functional connectivity, correlation of blood-oxygen-level dependent (BOLD) activity, among multiple cortical areas along a given parcellation. In particular, resting-state fMRI captures the intrinsic functional organization of the cortex without any explicit stimuli, whereas task-evoked fMRI measures extrinsic cortical interaction and temporal synchrony in response to a specific task12, 13. A variety of clinical applications of both task-evoked and resting-state fMRI have revealed changes in brain function in multiple neurological and psychiatric disorders14–16, such as schizophrenia17, 18, Alzheimer’s disease19, Parkinson’s disease20, autism spectrum disorders21, and major depressive disorder (MDD)22.
Twin studies have established that brain functional organizations characterized by resting and task fMRI are moderately heritable23–30 (heritability range was (0.2,0.6) in a recent review31). The narrow sense single-nucleotide polymorphism (SNP) heritability of resting fMRI traits was reported to be around 10% across the entire brain and higher than 30% in some functional regions32. The heritability of brain functional traits was typically lower than that of brain structural traits32–35. Nevertheless, brain functional traits could more directly connect genetic variations to mechanisms underlying behavioral differences36. A few genome-wide association study (GWAS)32, 34, 37 have been recently conducted on resting fMRI traits using a whole brain spatial independent component analysis (ICA)38–40 approach. The whole brain ICA is a parcellation-free dimension reduction method that estimates the functional brain regions (i.e., ICA components/regions) directly from the fMRI data. Although ICA is a powerful and popular fMRI tool, it is a data-driven method, which might limit its generalizability and interpretability12. For example, the ICA components estimated from training data may form a sample-dependent functional network and it is not clear if they can be generalized to independent datasets. Moreover, it might be difficult to use ICA to compare intrinsic and extrinsic functional architectures, since the ICA components estimated in resting and task fMRI may not be well-aligned. Additionally, ICA attempts to capture major variations in the data. As a result, ICA regions typically have large sizes, limiting their ability to capture high-resolution details of brain functionality. For example, an earlier study40 defined 55 ICA components in the UK Biobank41 (UKB) dataset, most of which are distributed across multiple areas and networks37.
In this paper, we used a parcellation-based approach to provide fine-grained details about the genetic architecture of cerebral cortex functional organizations. A recently developed human brain parcellation1, which partitioned the cerebral cortex into 360 areas (referred to as the Glasser360 atlas hereafter, Table S1), was used to analyze resting and task fMRI data of 40,253 individuals in the UKB study. The task implemented in the UKB study was an emotional processing task42, 43, known to robustly activate amygdala and visual systems. The Glasser360 atlas was constructed using high-quality multi-modality data from the Human Connectome Project (HCP44) and greatly improved the neuroanatomical resolution of human cerebral cortex annotations. The 360 cortical areas were grouped into 12 functional networks45, including four well-known sensory networks (the primary visual, secondary visual, auditory, and somatomotor), four cognitive networks (the cingulo-opercular, default mode, dorsal attention, and frontoparietal), the language network, and three recently identified networks (the posterior multimodal, ventral multimodal, and orbito-affective) (Figs. 1A-B, Fig. S1A). In addition to pairwise functional connectivity among areas, we developed a parcellation-based dimension reduction procedure to generate network level fMRI traits via a combined principal component analysis (PCA) and ICA methods32 in a training-validation design (Fig. S1B, Methods). The area level functional connectivity pairs within each network and between each pair of networks were aggregated into network level traits. Genetic architectures were examined at both area and network levels for brain functions using these functional connectivity traits. Together, there were 8,531 area level traits and 1,066 network level traits for resting fMRI and 8,531 area level traits and 919 network level traits for task fMRI. Compared to the whole brain ICA-based GWAS32, 34, 37 in the prior literature for resting fMRI, the current parcellation-based study 1) enabled the comparison between intrinsic and extrinsic functional architectures using both resting and task fMRI; and 2) uncovered much more and finer detail on the genetic influences on specific functional areas and networks and their genetic links with brain traits and disorders.

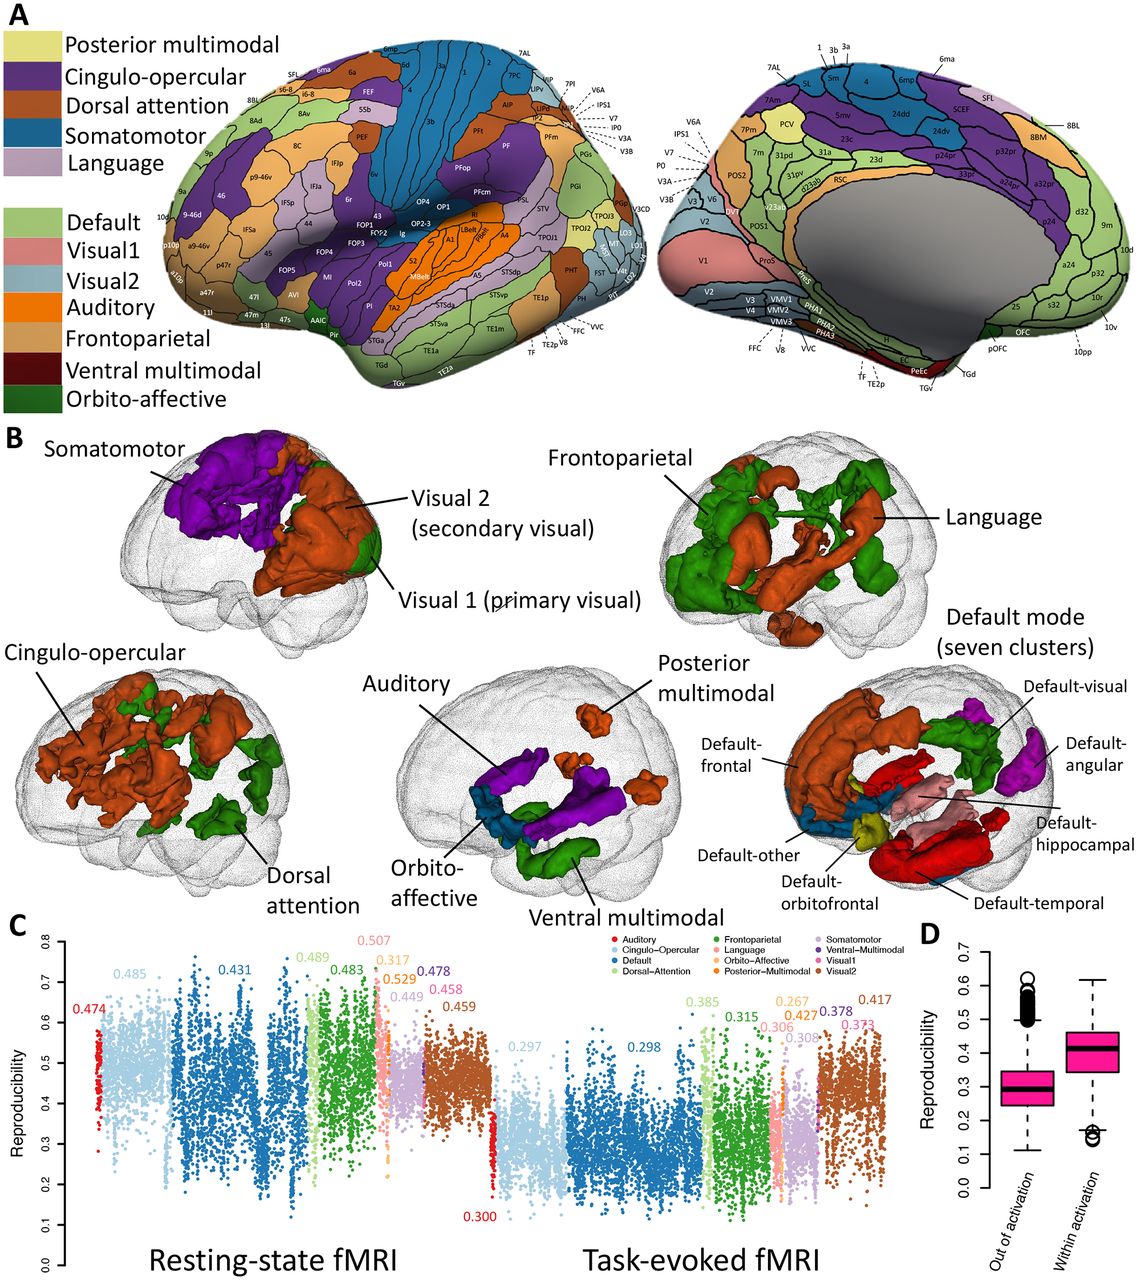
(A) Functional areas defined in the Glasser360 atlas (left hemisphere). See Table S1 for information of these areas and Figure S1 for maps of the whole brain (both hemispheres). Visual1, the primary visual network; Visual2, the secondary visual network. (B) Annotation of the 12 functional networks in the human brain. The default mode network (bottom right) is divided into seven clusters, mainly based on their physical locations. See Figure S11 for more information of the seven clusters. (C) Reproducibility of area level functional connectivity across the 12 networks in resting (left panel) and task (right panel) fMRI. (D) Comparison of reproducibility between the activated areas (within activation) and the nonactivated areas (out of activation) in task fMRI. The activation map can be found in Figure S8.
RESULTS
Consistency and reproducibility of the cerebral cortex functional organizations
In this section, we examined the consistency and reproducibility of functional connectivity using annotations defined in the Glasser360 atlas in the UKB study. As in Glasser, et al. 1, we first compared the group means of two independent sets of UKB subjects: the UKB phases 1 and 2 data (imaging data released up through 201846, n = 17,374) and the UKB phase 3 data (data released in early 2020, n = 16,852, removing the relatives of subjects in early released data). Figures S2-S3 illustrate the consistent spatial patterns of functional connectivity across the two independent groups. The group mean maps were highly similar, with the correlation across the 64,620 (360 × 359/2) functional connectivity being 0.996 in resting fMRI and 0.994 in task fMRI. These results may suggest that the HCP-trained Glasser360 atlas can provide a set of well-defined and biologically meaningful brain functional traits that are generalizable across datasets.
Furthermore, we evaluated the reproducibility of the Glasser360 atlas using the repeat scans from the UKB repeat imaging visit (n = 2,771, average time between visits = 2 years). We performed two analyses. The first analysis is to compare the group mean maps of the original imaging visit to those of the repeat visit. Functional connectivity maps were highly consistent between the two visits, with correlation of 0.997 and 0.994 for resting and task fMRIs, respectively (Figs. S4-S5). The second analysis quantified individual-level differences between the two visits. Specifically, we evaluated the reproducibility of each functional connectivity by calculating the correlation between two observations from all revisited individuals. Overall, the average reproducibility was 0.37 (standard error = 0.11) for resting fMRI and 0.30 (standard error = 0.08) for task fMRI (Figs. S6A-B). A few patterns were observed. For example, the reproducibility of within-network connectivity was high in resting fMRI but decreased in task fMRI (Fig. 1C, mean = 0.46 vs. 0.32, P < 2.2 × 10⁻¹⁶). During task fMRI, the connectivity within activated functional areas (defined by group-level Z-statistic maps, Supplementary Note) showed higher reproducibility than that within nonactivated areas (Fig. 1D, Fig. S7A, mean = 0.40 vs. 0.30, P < 2.2 × 10⁻¹⁶). The majority of activated areas were in the secondary visual, dorsal attention, and somatomotor networks (Fig. S8). Additionally, we found that connectivity with low reproducibility (e.g., < 0.25) typically had low connectivity strength as well, suggesting that weak connectivity might be noisier than medium or strong connectivity (Figs. S6C-D). We also evaluated the reproducibility of our network level traits. The mean reproducibility was 0.43 (standard error = 0.08) for resting fMRI and 0.40 (standard error = 0.08) for task fMRI. These results indicate that network level traits are more reproducible, likely due to the reduction of noise that occurred during our dimension reduction procedure.
Finally, we compared the spatial patterns of UKB and HCP studies. The correlation between UKB and HCP was 0.90 for resting fMRI and 0.78 for task fMRI in the group mean analysis (Fig. S9). These results demonstrate a substantial level of overall consistency between the typical subjects in a healthy young adult cohort and those of middle age and older age. Next, we examined the reproducibility of the Glasser360 atlas using the repeated scans in HCP study (n = 1075, average time between two scans = 1 day). The average reproducibility was 0.40 (standard error = 0.09) for resting fMRI and 0.22 (standard error = 0.11) for task fMRI (the emotion task) (Fig. S7B). These results show that the two studies have similar reproducibility, suggesting that the quality of fMRI traits in the biobank-scale UKB study is comparable to that of the HCP project when using the Glasser360 atlas. Similar to the UKB study, the activated connectivity of HCP task fMRI had higher reproducibility than the nonactivated connectivity (Fig. S7C, mean = 0.382 vs. 0.225, P < 2.2 × 10⁻¹⁶). In general, the excellent group mean map consistency, as well as the similar reproducibility between the UKB and the HCP studies, provide confidence that the Glasser360 atlas will be able to consistently annotate the functional organization of typical subjects in a healthy population.
Heritability of human cerebral cortex functional connectivity at rest and during a task
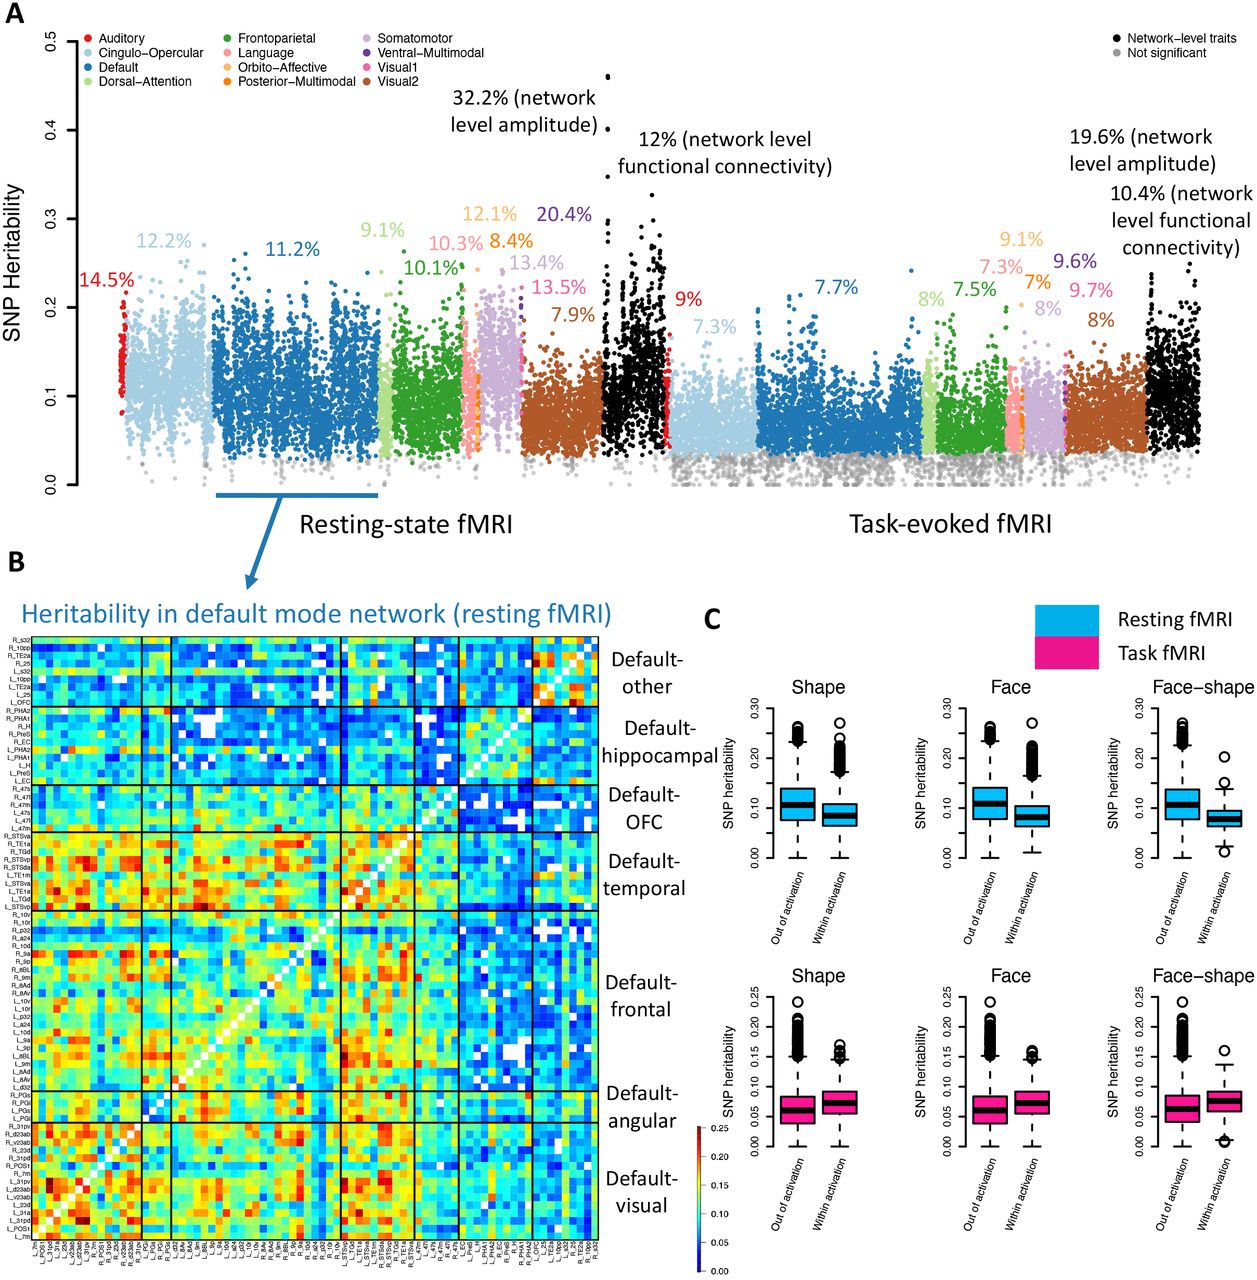
We next examined the heritability pattern of functional connectivity across different functional areas and networks. Using UKB individuals of white British ancestry (n = 34,641 for resting and 32,144 for task), SNP heritability was estimated via GCTA47 for the 8,531 area level within-network functional connectivity traits in both resting and task fMRI. The mean heritability (h2) was 10.4% for resting and 6.6% for task fMRI. Overall, the SNP heritability of 97.9% (8,349/8,531) resting functional connectivity and 80.8% (6,894/8,531) task functional connectivity traits remained significant after adjusting for multiple comparisons using the Benjamini-Hochberg procedure to control the false discovery rate (FDR) at 0.05 level (Table S2). We also estimated the heritability of the 1,985 network level traits (1,066 for resting and 919 for task). The mean h2 was 32.2% for amplitude and 12% for functional connectivity in resting fMRI; and that was 19.6% for amplitude and 10.4% for functional connectivity in task fMRI (Table S3). Consistent with the results above on reproducibility, the higher heritability of network level fMRI traits may suggest that our dimension reduction approach reduces noise by aggregating fMRI signals or that genetics have a stronger influence on broader brain networks rather than specific region pairs.
Figure 2A and Figure S10A illustrate the heritability pattern across different networks. The mean heritability was highest in the ventral multimodal network during resting fMRI (mean = 20.4%). The ventral multimodal is a recently identified network45, consisting of four cortical areas (left/right TF and PeEc, Fig. S1A) on the ventral surface of the temporal lobe45. One possible function of this network is to represent higher-order semantic categories45. In addition, the mean heritability of task fMRI was lower than that of resting fMRI in all networks except for the secondary visual network, where more than half (52.32%) of connectivity had greater heritability during task fMRI (Fig. S10B). This might be partly because the secondary visual network is highly activated, which follows our results on reproducibility.

(A) SNP heritability of fMRI traits, including 8,531 area level and 1,066 network level traits from resting fMRI (left panel), and 8,531 area level traits and 919 network level traits from task fMRI (right panel). (B) Significant SNP heritability of the functional connectivity within the default mode network in resting fMRI. We grouped all functional areas in the default mode network into seven clusters. These areas were mainly organized by their physical locations (Fig. S11). OFC, orbitofrontal complex. (C) Comparison of SNP heritability between the activated areas (within activation, defined in task fMRI) and the nonactivated areas (out of activation) in resting fMRI (upper panel) and task fMRI (lower panel).
In each network, the heritability pattern across functional areas was identified. For example, according to physical locations, the areas of the default mode network can be divided into seven clusters (Fig. S11). There is no significant correlation between the physical distance of these default mode area pairs and their heritability measurements (P = 0.563). In the visual cluster (including the precuneus, calcarine, and cingulate) and the temporal cluster, the default mode connectivity was most heritable. Additionally, the connectivity between the two clusters and the angular and frontal clusters showed high heritability, indicating the high degree of genetic control of functional interaction among these physically disconnected regions (Fig. 2B). In the somatomotor network, the left/right 3a, 3b, and 4 areas (in the postcentral, precentral, and paracentral) and the left/right 7AL and 7PC areas (in the superior parietal) form two separate connectivity clusters. We found that the 3a, 3b, and 4 areas had the highest heritability within the somatomotor network, while the heritability of the 7AL and 7PC areas was low. In addition, the connectivity associated with the left OP2-3 area (in the Rolandic operculum and insula) had high heritability (Fig. S12). In the cingulo-opercular network, the insula-related areas (e.g., the left/right FOP5, PoI1, FOP3, FOP1, FOP4, MI, and Pol2) exhibited the highest heritability. However, the heritability of the adjacent para-insular area (the left/right Pl, in the temporal pole and superior temporal) was low (Fig. S13). The insula is a functionally diverse part of the cortex involved in multiple functions, including emotion, cognition, and sensory perception48, 49. The insula has been found to have the highest heritability in surface curvature analysis of cortical morphometry29. Additionally, the connectivity of a few areas showed consistently high heritability in resting fMRI, including the left/right IPS1 areas (in the superior occipital) of the secondary visual network and the right TE1m and left/right TE1p areas (in the inferior temporal and middle temporal) of the frontoparietal network (Fig. S14). In task fMRI, we also observed a few areas that had higher heritability than others, including the visual cluster, left OFC (orbitofrontal complex), and left/right 25 areas (in the olfactory cortex) of the default mode network (Fig. S15); the left/right RSC (in the middle cingulate), POS2 (in the precuneus and cuneus), 7Pm (in the precuneus) areas of the frontoparietal network (Fig. S16); and the middle cingulate-related areas (e.g., the left/right p24pr, a24pr, and left 33pr) of the cingulo-opercular network (Fig. S17). In summary, our results illustrate the variations of genetic influences in the cerebral cortex and underscore the important functional areas whose interactions are strongly influenced by genetic factors.
We also explored the relationship between heritability and reproducibility and activation maps. For all 12 networks, both resting and task fMRI showed strong positive correlations between heritability and reproducibility (overall correlation = 0.47 for resting and 0.40 for task, P < 2.2 × 10⁻¹⁶, Fig. S18). These results may suggest that functional interactions that are more reproducible tend to be more genetically controlled. The heritability pattern was also correlated with the activation maps. In resting fMRI, the heritability of task-defined activated connectivity was lower than that of nonactivated connectivity (Fig. 2C, mean = 8.9% vs. 10.8%, P < 2.2 × 10⁻¹⁶). However, in task fMRI, activated connectivity had a higher heritability than nonactivated connectivity (mean = 7.4% vs. 6.3%, P < 2.2 × 10⁻¹⁶). These differences can be partially explained by the observation that the activated connectivity had greater reproducibility than the nonactivated connectivity in task fMRI, and may also due to the task-related changes in brain functions and inter-regional connectivity50. Some genetic effects may only be detected when activating a particular brain region, which is like a gene-environment interaction and implies that we would need broad numbers of tasks to be able to detect more genetic influences on some specific brain functions. Our findings are also related to previous observations that the correlation between two activated regions increases during task performance, whereas the correlation between other regions is decreased51. Overall, these results provide insights into the genetic influences on the intrinsic and extrinsic functional architecture and link the genetic variation patterns to reproducibility and activation maps.
Genetic loci associated with cerebral cortex functional areas and networks
GWAS was performed for the 8,531 × 2 within-network connectivity traits in resting and task fMRI using UKB individuals of white British ancestry (Methods). The LDSC intercepts52 were close to one, suggesting no genomic inflation of test statistics due to confounding factors (mean intercept = 1.003, standard error = 0.010). At a stringent significance level 2.93 × 10⁻¹² (5 × 10⁻⁸/8,531/2, additionally adjusted for the number of traits studied), we identified 32 genomic regions (cytogenetic bands) associated with resting connectivity, 9 of which were also associated with task connectivity (Fig. 3A and Table S4).
Enrichment of locus-specific genetic effects was observed across different areas and networks in resting fMRI. Many of the fMRI-associated genetic variants are known to affect gene expressions in previously published human brain expression quantitative trait loci (eQTL) datasets53, 54. For example, most of the associations of the 2q14.1 locus were in the somatomotor network. The 2q14.1 locus was also particularly associated with the right MST and right V6 areas (in the middle temporal and cuneus) of the secondary visual network and a few areas (e.g., the left/right 43 in the Rolandic operculum and the p24pr in the middle cingulate) of the cingulo-opercular network (Fig. S19). Figure S20 illustrates the genes presented at this locus and shows that the index variant (and its proxy variants, linkage disequilibrium [LD] r2 > 0.8) are associated with the expression of PAX8 and FOXD4L1 in brain tissues53, suggesting that the two genes are relevant to neuronal function. The 10q23.33 and 10q26.3 loci were mainly associated with the cingulo-opercular, somatomotor, auditory, and default mode networks (Figs. S21-S22). The index variants were eQTLs of NOC3L, PLCE1, and INPP5A (Fig. S23). Moreover, most of the 10q26.3-associated areas of the default mode network were in the hippocampal cluster (Fig. S24). The 3p11.1 locus had genetic effects on a few specific areas, including right PSL (Perisylvian language area, in the superior temporal) and left PF (in the supramarginal) areas of the cingulo-opercular network and the left PGs (in the angular) and the left 31a areas (in the middle cingulate) of the default mode network (Fig. 3B and Figs. S25-S26). The 11q22.1 locus was associated with the auditory network (especially the left MBelt [medial belt complex] area) and the insula-related areas (e.g., the left/right PoI1, PoI2, FOP3, MI, FOP4) of the cingulo-opercular network (Fig. S27). The significant variants were eQTLs of CFAP300 (Fig. S28). The 15q14 locus was mainly associated with areas of the somatomotor and cingulo-opercular networks, such as the left FOP2 (in the Rolandic operculum) and the left 6r (in the opercular part of the inferior frontal) (Figs. S29-S30). Interesting, all associations at the 19q13.32 locus, which was the major risk factor of Alzheimer’s disease, were in the secondary visual network (such as the left LO1 and right V3CD in middle occipital, left/right V3A in superior occipital, and left/right V6 in cuneus), with one exception in the visual cluster of the default mode network (Fig. 3C and Figs. S31-S32). These results highlight the close relationship between the 19q13.32 locus and the visual cortex. Similarly, the variants in 10q26.13 locus was particularly associated with the visual cluster of the default mode network and were eQTLs of LHPP and EEF1AKMT2 (Figs. S33-S34). The 17p11.2 locus was mainly associated with the insula-related areas (e.g., the left/right MI and FPO4) and the middle cingulate-related areas (e.g., the left/right a24pr and p32pr) of the cingulo-opercular network (Fig. S35). The significant variants were eQTLs of GRAPL (Fig. S36). The variants in 3q24 locus were related to the cingulo-opercular and frontoparietal networks and were eQTLs of ZIC4 (Figs. S37-S38). Additionally, we found that the 4q24 locus was mainly associated the left 6ma area (in the superior frontal) of the cingulo-opercular network, the 14q23.1 locus with the left IPS1 area (in the superior occipital) of the secondary visual network, and the 2p21 locus with the left i6-8 area (in the middle frontal) of the frontoparietal network (Figs. S39-S44).

(A) Ideogram of 47 genomic regions influencing fMRI traits, including 32 regions identified by area level traits (P < 2.93 × 10⁻¹²) and 15 more identified by network level traits (P < 2.51 × 10⁻¹¹). The point colors represent the 12 networks (and their interactions, named Between networks). Each signal point indicates that at least one of the fMRI traits (area level or network level) of this network is associated with the genomic region. The name of regions replicated at the Bonferroni significance level and nominal significance level were highlighted in red and brown labels, respectively. (B) Functional areas in the cingulo-opercular and default mode networks associated with the 3p11.1 region (P < 2.93 × 10⁻¹²). These associations were enriched in the right PSL (Perisylvian language area, in the superior temporal) and the left PF (in the supramarginal) areas of the cingulo-opercular network and the left PGs (in the angular) and the left 31a areas (in the middle cingulate) of the default mode network. (C) Functional areas associated with the 19q13.32 region (P < 2.93 × 10⁻¹²). Most of these areas were in the secondary visual network.
Among the 9 significant genomic regions identified in task fMRI, the 10q23.33 locus was mainly associated with the visual cluster of the default mode network (Figs. S45-S46), especially the left/right 31pv areas (in the middle cingulate) (Fig. S47). For other loci (e.g., 10q26.3, 3p11.1, and 19q13.32), the associated networks were similar to those in resting fMRI, although the number of connectivity traits surviving the stringent significance level became much smaller. We examined the pair-wise genetic correlations between the 8,531 connectivity in resting and task fMRI via the cross-trait LD score regression55 (Methods). The average genetic correlation among all of the 8,531 pairs was 0.554, 3,598 of which were significant at the FDR 5% level (Fig. S48, mean = 0.710, standard error = 0.192). The genetic correlations were strongly associated with the corresponding phenotypic correlations (correlation = 0.340, P < 2.2 × 10⁻¹⁶), and were also related to the reproducibility of fMRI (correlation = 0.168, P < 2.2 × 10⁻¹⁶). Although it was more difficult to identify associated loci for task fMRI, these strong genetic correlations suggest the overall similarity of the genetic architecture on brain functions at rest and during a task.
Next, we performed GWAS for the 1,985 network level traits to identify variants associated with connectivity within each of the 12 network and between each pair of networks. At the 2.51 × 10⁻¹¹ (5 × 10⁻⁸/1,985) significance level, we identified 41 (15 additional) genomic regions for resting fMRI, 14 of which were also associated with task fMRI (Table S5). On average, these 41 genetic regions explained 13.5% of the heritability of network level fMRI traits. Together, the area and network level analysis identified 47 genomic regions for resting fMRI, 15 of which were also associated with task fMRI (Fig. 3A). A recent whole brain ICA-based fMRI study34 identified 21 genomic regions using 1,777 resting fMRI traits (P < 2.81 × 10⁻¹¹, 5 × 10⁻⁸/1,777), 16 of which were also identified in our study. These results may suggest the higher power of our parcellation-based approach. Of the 47 loci, 19 had been linked to brain structural connectivity in a recent study of white matter microstructure using diffusion MRI (dMRI)46 (Table S6). A few of the 19 overlapped loci had wide genetic effects on multiple white matter tracts and functional networks, such as the 16q24.2, 3p11.1, 16q24.2, and 15q14 (Fig. S49).
Finally, we aimed to replicate the identified genomic loci using independent European and non-European datasets. First, we repeated GWAS on a European dataset with 4,882 subjects, including European individuals in the UKB phase 4 data (early 2021 release, removed the relatives of our discovery sample) and individuals of white but non-British ancestry in UKB phases 1 to 3 data. For the 266 independent (LD r2 < 0.1) network-locus associations in resting fMRI, 60 (22.6%) passed the Bonferroni significance level (1.9 × 10⁻⁴, 0.05/266) in this validation GWAS, and 190 (71.4%) were significant at nominal significance level (0.05). All of the 190 significant associations had concordant directions in the two GWAS (Fig. S50A). Of the 47 identified genomic loci, at least one association of 13 loci (27.7%) passed the Bonferroni significance level and 37 (78.7%) can be validated at 0.05 nominal significance level. For task fMRI, 33% (i.e., 19/57) network-locus associations passed the nominal significance level, all of which had the same effect signs in the two GWAS (Fig. S50B). The 17 associations were related to nine genomic loci, four (the 10q23.33, 16q24.2, 10q26.3, and 19q13.32) of which were significant at the Bonferroni significance level. Next, we performed GWAS on two UKB non-European validation datasets: the UKB Asian (UKBA, n = 469) and UKB Black (UKBBL, n = 261). Of the 47 genomic loci, 16 (3 also in task) were validated in UKBA and 10 (5 also in task) were significant in UKBBL at nominal significance level, none of them survived the Bonferroni significance level (Tables S4-S5). Particularly, the 15q14 locus can be consistently validated for both resting and task fMRI in UKBA and UKBBL (P < 5.0 × 10⁻³).
The shared genetic influences with complex brain traits and disorders
To evaluate the shared genetic influences between brain functional organizations and complex brain traits and diseases, we carried out association lookups for independent (LD r2 < 0.1) significant variants (and variants in LD, r2 ≥ 0.6) detected in UKB white British GWAS. In the NHGRI-EBI GWAS catalog56, our results tagged variants reported for a wide range of complex traits and diseases, such as neurological disorders, neuropsychiatric disorders, mental health and psychological traits, migraine, cognitive traits, educational attainment, sleep, smoking/drinking, and anthropometric measurements (Table S7). To explore the detailed colocalization pattern across brain functional regions, we took the index variants of colocalized traits/diseases and performed variant-specific association analysis for all of the 64,620 functional connectivity (Methods). Below we highlighted colocalizations in a few genomic regions. All these loci have been replicated at nominal significance level in our validation GWAS.
We found a colocalization with Alzheimer’s disease at rs429358 (19q13.32), one of the two variants in the APOE ε4 locus (Fig. 4A). In both resting and task fMRI, the secondary visual network had the strongest association with rs429358 (Fig. 4B and Fig. S51A). The allele associated with increased risk for Alzheimer’s disease (“C”) was associated with decreased functional connectivity in visual cortex (Fig. S52). Visual deficits were one of the first symptoms of Alzheimer’s disease57 and functional connectivity deficits in the visual cortex have been reported in Alzheimer’s disease58, 59. Decreased eigenvector centrality in visual cortex was associated with APOE ε4 carriership among normal elderly subjects60. In addition, the risk allele at rs429358 was associated with decreased default mode activity at the Bonferroni significance level in variant-specific analysis (3.86 × 10⁻⁷, 0.05/64,620/2), with distinct patterns in resting and task fMRI. In resting fMRI, the associations were mainly in the visual cluster and the left/right 10d areas (in the superior frontal). Decreased default mode network connectivity in the posterior cingulate cortex/precuneus, orbital and middle frontal cortex, and inferior parietal lobe in APOE ε4 carriers is consistently reported in various studies across adulthood (see Section 3.3.1 and Table 2 of Foo, et al. 31). Regardless of APOE carrier status, results from previous studies are consistent in finding decreased functional connectivity in the default mode network in subjects with Alzheimer’s disease and mild cognitive impairment, as summarized in Dennis and Thompson 61 and Badhwar, et al. 19. For task fMRI, most of the significant rs429358 effects were on the interactions between the visual cluster and a few areas in the frontal cluster, including the left/right p32 (in the medial superior frontal), a24 (in the pregenual anterior cingulate cortex), and 8Ad (in the superior frontal) areas (Fig. S51B). The reduced deactivation of the default mode network during tasks has been consistently observed in different stages of Alzheimer’s disease62 and normal carriers of the APOE ε463. Biologically, amyloid-β (Aβ) accumulation preferentially starts in several of the core regions of the default mode network, and the earliest Aβ accumulation is further associated with hypoconnectivity within the default mode network and between default mode network and the frontoparietal network64. Additionally, we found the risk allele at rs429358 decreased the functional connectivity of middle temporal areas in the language network (e.g., the left/right TPOJ and STSdp) and the left IP0 area (in the middle occipital) of the dorsal attention network in task fMRI, but not in resting fMRI (Fig. S53). We also tested the association between rs429358 and MRI traits of other imaging modalities, including structural connectivity traits from dMRI46 and regional brain volumes from structural MRI (sMRI)65. The fMRI traits had much stronger associations (smaller P values) with rs429358 than these structural traits. Together, these results suggest the fMRI traits of brain functions, especially the ones from the visual cortex in the secondary visual and default mode networks, might be more directly related to the genetic pathways of APOE ε4 to Alzheimer’s disease than brain morphology. These fMRI traits could be used as imaging biomarkers in etiologic study of Alzheimer’s disease and drug development targeting APOE ε4.

(A) In the 19q13.32, we observed colocalization (LD r2 ≥ 0.6) between Alzheimer’s disease (index variant rs429358) and the functional connectivity within the secondary visual network (visual 2 <-> visual 2, index variant rs429358) in task fMRI. (B) We illustrated the P-value of the association between the rs429358 and different neuroimaging traits, including functional connectivity in resting fMRI, functional connectivity in task fMRI, diffusion tensor imaging (DTI) from dMRI, and regional brain volumes from sMRI. The strongest genetic effects were in the secondary visual network of resting and task fMRI. (C) In 6q16.1, we observed colocalization between migraine (index variant rs11759769) and the functional connectivity of the default mode network (Default <-> Default, index variant rs11152952) in resting fMRI. (D) In 2q14.1, insomnia (index variant rs62158170) was colocalized with the functional connectivity between the auditory and posterior multimodal networks (Auditory <-> Posterior-Multimodal, index variant rs56093896) in resting fMRI. (E) We illustrated the P-value of the rs62158170 on functional connectivity in resting fMRI. We displayed the functional connectivity passing the Bonferroni significance level (P < 3.86 × 10⁻⁷) in this variant-specific analysis.
In the 17p11.2 and 2p16.1 regions, we observed colocalizations between the default mode network and multiple psychiatric disorders, including schizophrenia66, 67, autism spectrum disorder68, MDD69, and epilepsy70. For example, we tagged the rs4273100 (nearest gene EPN2, 17p11.2) and rs1518395 (VRK2, 2p16.1), which have been implicated with schizophrenia (Fig. S54). Rs1518395 was also a risk variant for MDD and the rs2947349 (VRK2, 2p16.1) was associated with epilepsy. In resting fMRI, all three index variants exhibited the strongest associations with the default mode network, especially the frontal cluster (Figs. S55-S56). In addition, we observed colocalizations with cognitive ability and education71 in the 17p11.2 region (e.g., rs12602286, EPN2) and with psychological traits (e.g., neuroticism72 and subjective well-being73, rs2678897, VRK2) in the 2p16.1 region, which were also mainly related to the default mode network (Fig. S57).
In the 10q23.33 and 6q16.1 regions, our identified variants tagged those that have been implicated with migraine74, 75 (Fig. 4C and Fig. S58). For example, the index variant rs11187838 (PLCE1, 10q23.33) affected multiple networks and had the strongest associations in the auditory and cingulo-opercular networks (Fig. S59). The index variant rs11759769 (FHL5, 6q16.1) was mainly associated with the auditory, cingulo-opercular, and ventral multimodal networks in resting fMRI (Fig. S60). We also found colocalizations with brain aneurysm76 in rs11187838 and with cerebral blood flow77 in rs2971609 (FHL5, 6q16.1). Migraine is a heterogeneous disorder and no neuroimaging biomarker has been well established in previous small sample fMRI studies78. Our results may help identify whether the risk variants of migraine predispose to migraine in particular brain regions or networks. Specifically, our findings suggest the genetic overlaps among migraine, cerebrovascular traits, and brain function across multiple networks and highlight the enrichment in the auditory and cingulo-opercular networks.
Colocalizations with cognitive ability71, intelligence79, and education71 were observed in the 10q26.13, 5q15, and 3p11.1 regions (Fig. S61). The index variants of theses cognitive traits were associated with a few specific functional areas in the temporal and parietal lobes. For example, in the 10q26.13 locus, our tagged variants associated with math ability, education71, and cocaine dependence80 (rs2629540, FAM53B). Rs2629540 variant was particularly associated with the precuneus-related areas in different networks, such as the right PCV in the posterior multimodal network, the left/right 7Pm in the frontoparietal network, and the right 31pd in the default mode network (Fig. S62). The precuneus is involved in a variety of complex functions and responds to a wide variety of cognitive processes81. In the 5q15 region, we observed colocalizations with cognitive performance, math ability, and education71 (rs114468556, NR2F1), most of which were related to the left/right TPOJ2 areas (in the middle temporal) of the posterior multimodal network (Fig. S63A). The NR2F1 is well studied in the arealization of the cerebral cortex82. In the 3p11.1, we found colocalizations with intelligence79 (rs7652296, EPHA3). The EPHA3 is involved in axon guidance83 and the rs7652296 was mainly associated with between-network connectivity of a few temporal and parietal areas, such as the right PSL (Perisylvian language area, in the superior temporal) and the left PF (in the supramarginal) of the cingulo-opercular network; the left PHT (in the middle temporal) of the dorsal attention network; the right PFm (in the inferior parietal) and the left TE1p (in the inferior temporal and middle temporal) of the frontoparietal network; the left PSL (in the superior temporal) and the right STSdp (in the middle temporal) of the language network; and the left PGs (in the angular) of the default mode network (Fig. S63B). These findings partially support the parieto-frontal integration theory of intelligence84, 85, uncovering the genetic overlaps between cognitive functions and specific temporal and parietal functional areas.
In addition, we found colocalized genetic effects with psychological traits (e.g., risk-taking behaviors86) in the 3q24 (rs2279829, ZIC4) and 3p12.1 (rs6762267, CADM2) regions (Fig. S64). Rs2279829 and rs6762267 were mainly related to the interactions among the frontoparietal, cingulo-opercular, and default mode networks, with the strongest genetic effects being on a few frontal areas (e.g., the left/right i6-8, left/right p9-46v, left a10p, right p24, right PEF). Increasing evidence suggests the frontal lobe plays an important role in risk-taking and risk behaviors87 (Fig. S65). Finally, the 2q14.1 region had colocalizations with insomnia88 and sleep traits89 (rs62158170, PAX8, Fig. 4D). The strongest genetic effects were on the somatomotor network (Fig. 4E). In summary, brain functions measured in fMRI has substantial area-specific genetic overlaps with complex brain traits and clinical outcomes. Uncovering the detailed genetic colocalized patterns may help understand how alterations in specific brain functions lead to risk for brain conditions and disorders.
To further explore the genetic links, we examined the genetic correlations55 between fMRI traits and 50 complex traits, most of which were colocalized traits in the above association lookups, as well as additionally mental health traits and major brain disorders. First, we examined the genetic correlations with 4 global functional connectivity and amplitude traits (2 trait for resting and 2 for task). At the FDR 5% level (4 × 50 tests), we found the global fMRI traits were significantly associated with hypertension, neuroticism (e.g., feeling nervous, worry), sleep traits, and task-taking behaviors (e.g., automobile speeding) (Table S8). For example, resting functional connectivity was negatively correlated with neuroticism (feeling nervous) (GC = −0.181, P < 1.14 × 10⁻⁴) and sleep duration (GC = −0.173, P < 1.58 × 10⁻⁴). Hypertension was negatively correlated with the global amplitude in task fMRI (GC = −0.282, P < 7.34 × 10⁻⁶).
Next, we explored the spatial patterns of genetic overlaps by evaluating the genetic correlations between complex traits and 8,531 functional connectivity. Enrichment of overlaps in specific brain functional areas and networks were observed in resting fMRI. For example, at the FDR 5% level (8,531 tests), cognitive function had genetic correlations with cognitive networks (the cingulo-opercular, default mode, frontoparietal, and dorsal attention), such as the right IFSa area (in the triangular part of inferior frontal) (Fig. 5A).

(A) We illustrated significant genetic correlations with cognitive function across different networks in resting fMRI at the FDR 5% level. These significant genetic correlations were particularly related to the functional connectivity of a few areas, such as the right IFSa in the cingulo−opercular network. (B) We illustrated significant genetic correlations with schizophrenia across different networks in resting fMRI at the FDR 5% level. These significant genetic correlations were particularly related to the functional connectivity of a few areas, such as the left 47s in the default mode network and the right LIPv in the secondary visual network. (C) We illustrated significant genetic correlations with cognitive function across different networks in task fMRI at the FDR 5% level. These significant genetic correlations were particularly related to the functional connectivity of a few areas, such as the left POS1 in the default mode network and the right V6 in the secondary visual network. Similar to the resting fMRI results in (A), genetic correlations with the default mode and dorsal attention networks were negative in task fMRI. However, the genetic correlations with the cingulo−opercular network became positive, and the somatomotor and secondary visual networks also had positive genetic correlations in task fMRI.
Most of the significant genetic correlations were negative, which suggest genetic effects predispose to less resting connectivity is associated with increased intelligence. For schizophrenia and cross-disorder90, we found consistent positive genetic correlations with the default mode network (e.g., the left/right 47s in the posterior orbital and the left/right 8BL in the medial superior frontal) and negative genetic correlations with the secondary visual network (e.g., the left/right LIPv in the superior parietal) (Fig. 5B and Fig. S66). Similarly, we found neuroticism (feeling nervous) had positive genetic correlations with the default mode network (e.g., the right PGi in the angular) and negative genetic correlations with the secondary visual network (e.g., the right FST in the middle temporal and the right VMV3 in the fusiform) (Fig. S67).
Task fMRI provided additional insights into the genetic correlations with cognitive function (Fig. 5C). Similar to resting fMRI, the default mode network had negative genetic correlations with cognitive function. The correlations were enriched in the connectivity between the visual cluster and the frontal cluster (Fig. S68A). Moreover, the secondary visual and somatomotor networks (e.g., the right V6 in the cuneus, the left VMV2 in the lingual, the left VIP in the superior parietal, and the right OP2-3 in in Rolandic operculum and insula) had positive genetic correlations with cognitive function (Fig. S68B). In summary, these results show the default mode network has negative genetic correlations with cognition and positive genetic correlations with brain disorders and neuroticism. The genetic correlations with cognition had opposite directions in the default mode network and the secondary visual network in task fMRI, pointing to genetic influences on task specific brain activity. Patterns of other complex traits (e.g., snoring, sleep during, hypertension, general risk tolerance, and education) were summarized in the Supplementary Note and Figures S69-S70. In summary, this section provides several lines of evidence for the shared genetic influences between brain functions and complex traits and diseases. Discovering such genetic co-variations in specific brain areas and networks might improve our understanding of how the brain function is affected by genetic risk factors and aid early detection and timely treatment of brain diseases.
Gene-level analysis and biological annotations
Using GWAS summary statistics of network level fMRI traits, MAGMA91 detected 67 significant genes with 352 associations (P < 1.34 × 10⁻⁹, adjusted for 1,985 phenotypes) (Table S9). We performed some functional lookups for these genes. First, nine genes (SSH2, CADM2, FAT3, ANO1, CSMD3, HELLS, CTR9, KANSL1, and ETV1) had a high probability of being loss-of-function (LoF) intolerant92 (pLI > 0.98), indicating its extremely intolerant of LoF variation. Second, 24 (UFL1, MEF2C, CPED1, TBC1D12, KANSL1, CRHR1, RNF112, TBC1D5, ANKRD32, DGKB, HSPG2, ZIC1, GRAP, MFAP4, FADD, NOC3L, CADM2, LRRC37A, EFCAB5, PLCB1, FAM53B, METTL10, ARL17B, and STH) of the 67 genes were also identified by a recent eQTL study of developing human brain93. Moreover, in the constructed transcriptional networks94, FAT3, MEF2C, CRHR1, NR2F1 and VRK2 were within the adult neurons, synaptic transmission, and neuron projection development function module; SSH2, HSPG2, and KANSL1 were within the superficial layer neurons and splicing module; and CADM2, PIP5K1B, ZIC1, CXXC4, ANKRD32, CSMD3 and GNA12 were within developing neurons and axon guidance module. These results indicate the fMRI-associated genes have potential functions in biological processes of brain development and healthy aging. In addition, we applied FUMA95 to map significant variants (P < 2.51 × 10⁻¹¹) to genes via physical position, eQTL association, and 3D chromatin (Hi-C) interaction. FUMA yielded 226 associated genes, 168 of which were not discovered in MAGMA (Table S10). In addition, 5 of the fMRI-associated genes (CALY, SLC47A1, SLC6A4, CYP2C8, and CYP2C9) were targets for 51 nervous system drugs96 (anatomical therapeutic chemical (ATC) code starts with “N”), such as 29 anti-depressants (N06A) to treat major depression disorder and related conditions, 13 anti-psychotics drugs (N05A) to manage psychosis, 4 psychostimulants (N06B) for ADHD and nootropics, and 2 anti-migraine (N02C) (Table S11).
To identify brain cell types where genetic variation leads to changes in brain function, we performed partitioned heritability analyses97 for cell type specific regulatory elements. Specifically, we estimated partitioned heritability enrichment within differentially accessible chromatin of neurons (NeuN+, including two subtypes GABAergic [NeuN+/Sox6+] and glutamatergic neurons [NeuN+/Sox6-]) and glial cells (NeuN-, including oligodendrocyte [NeuN-/Sox10+], microglia and astrocyte [NeuN-/Sox10-])98. To identify global enrichment across the whole brain, we performed partitioned heritability using global functional connectivity and amplitude traits in resting fMRI. As expected, we found enrichment of functional connectivity and amplitude in neuronal regulatory elements but not in glial (Fig. 6A). For further resolution across brain networks, we also performed enrichment analysis for the mean amplitude of the 12 networks. Neuronal enrichment was observed in most networks and the strongest enrichment was found in the posterior multimodal network (Fig. 6B). Overall, these results indicate that common variants associated with brain functional activity alter the function of regulatory elements in neurons, the cell type expected to influence brain functional interactions, supporting the biological validity of the identified genetic associations.

(A) Heritability enrichment of global functional connectivity and global amplitude of resting fMRI in regulatory elements of glial cells (glia, including all glial cells, oligodendrocyte subtype, and microglia/astrocyte subtype) and neuronal cells (neurons, including all neurons, GABAergic subtype, and glutamatergic subtype). The dashed lines indicate the nominal significance level. (B) Heritability enrichment of mean amplitude of the 12 networks in regulatory elements of glial and neuronal cell types. (C) Prediction accuracy of genetic variants and neuroimaging traits in fluid intelligence prediction analysis. Genetic PRS, polygenic risk scores of genetic variants; brain volume (sMRI), region brain volumes from sMRI; DTI parameters (dMRI), diffusion tensor imaging parameters from dMRI; All MRI traits, including brain volume, DTI parameters, resting fMRI, and task fMRI.
Intelligence prediction by integrating genetic and multi-modality MRI data
One ultimate goal in brain imaging genetics is to develop prediction models for brain complex traits and disorders99–101. In this section, we performed prediction for fluid intelligence using common genetic variants and neuroimaging traits from multiple modalities, including resting fMRI, task fMRI, dMRI, and sMRI. We examined the joint performance and relative contributions of these data types in a training, validation, and testing design (Methods). The genetic effects were aggregated using polygenic risk scores (PRS) via PRS-CS102 and the effects of imaging traits were estimated in ridge regression via glmnet103. All model parameters were tuned using the validation data and we evaluated the prediction performance on the independent testing data by calculating the correlation between the predicted values and the observed intelligence, while adjusting for the covariates.
The prediction performance was summarized in Figure 6C. The prediction correlation of genetic PRS is 0.228 (standard error = 0.019), suggesting that about 5.2% variation in fluid intelligence can be predicted by common genetic variants. The prediction correlation resting fMRI was 0.234, which was similar to that of task fMRI (correlation = 0.233). The performance was improved to 0.296 by jointly using resting and task fMRI, which suggests resting and task fMRI had unique contributions to intelligence prediction. The dMRI and sMRI traits had much lower prediction accuracy than fMRI traits. Specifically, the prediction correlation was 0.105 for diffusion tensor imaging (DTI) parameters and 0.08 for regional brain volumes. Moreover, adding these structural traits in addition to fMRI traits did not significantly improve the prediction performance (correlation = 0.299), indicating the prediction power of structural traits for intelligence can be largely captured by the functional traits. More importantly, by using both of the genetic PRS and neuroimaging traits, the prediction correlation moved up to 0.347, which was much higher than only using one of the two data types. These results illustrate the neuroimaging traits, especially the ones from resting and task fMRI, can substantially improve the prediction accuracy of intelligence on top of genetic PRS. Future studies can integrate genetic PRS and multi-modality MRI data for better prediction of brain conditions.
DISCUSSION
Using resting and task fMRI data from the UK Biobank, we provided fine details of genetic influences on cerebral cortex functional architectures through a parcellation-based approach. We showed the similarities and differences of the genetic architecture of intrinsic and extrinsic functional organizations in heritability analysis, association analysis, genetic links with cognition and disease, and prediction models of intelligence. Genetic colocalization and correlation analyses uncovered important brain functional areas and networks that were genetically implicated in specific diseases and traits, such as the substantial genetic links between the visual cortex and the Alzheimer’s disease.
At group mean level, prior literature has demonstrated that the intrinsic and extrinsic functional architectures are highly similar with small but consistent differences50, 104–108. These task-related changes are essential for the human brain to adaptively alter its functionality via rapid changes in inter-regional functional connectivity50. Using large-scale individual level data in the UK Biobank, we showed the overall genetic similarity between resting and task fMRI (e.g., mean genetic correlation = 0.7). Although the genetic differences between resting and task fMRI are small, multiple lines of evidence suggest such differences could be important and are genetically related to cognition and brain diseases. For example, cognitive function had genetic correlations with the secondary visual and somatomotor networks during task performance, but not at rest. Moreover, our prediction analysis illustrated that jointly using resting and task fMRI resulted in higher prediction accuracy, indicating there were distinct cognition-related components in resting and task fMRI.
Although many efforts have been made to understand the functional organizations of the human brain, there is no one widely-accepted standard pipeline for functional connectivity analysis in fMRI99. Our study is one of the first attempts to study the genetic architecture of brain functions using a parcellation-based approach in biobank-scale dataset. Compared to the recent whole brain ICA-based studies32, 34, our parcellation-based approach was able to uncover high-resolution fine details on the genetic effect patterns and enable the comparison between intrinsic and extrinsic functional architectures. However, there are still a few limitations in the present study. First, the UKB participants were mostly middle-aged to elderly Europeans. Although we have illustrated the overall consistency of group mean maps between the HCP and UKB cohorts, nonlinear aging effects on brain functional connectivity have been widely observed109. It is of great interest to study the gene-age interactions and evaluate the generalizability of UKB results across the lifespan110. It is also interesting to investigate the population-specific genetic components when more large-scale fMRI data from global populations become available111. Second, the UKB task fMRI data were from a single emotion processing task42, 43. Although previous studies have shown that the functional architectures of different tasks were highly similar50, 104, 106, multi-task fMRI data may provide new insights in genetic studies. It might be possible to impute/predict multi-task fMRI data for UKB using the multi-task HCP data as training reference panels. To enable comparison between resting and task fMRI, our study focused on functional connectivity traits. It is also of great interest to study the genetics influences on task activation measures/maps for task fMRI. In addition, fMRI traits show lower reproducibility than structural MRI traits and this may account for their decreased heritability. New feature extraction pipeline might help improve the reproducibility by jointly analyzing resting functional connectivity, task functional connectivity, and structural connectivity. Finally, we performed functional connectivity analyses using the full correlation measures extracted from the Glasser360 atlas. Future work is needed to evaluate the consistency of results between full and partial correlations and compare the Glasser360 atlas with other common brain parcellations4–8 in the large-scale UKB dataset.
METHODS
Methods are available in the Methods section.
Note: One supplementary information pdf file, one supplementary figure pdf file, and one supplementary table zip file are available.
Data Availability
Our GWAS summary statistics will be shared on Zenodo and at BIG-KP https://bigkp.org/. The individual-level data used in the present study can be applied from the UK Biobank (https://www.ukbiobank.ac.uk/) and HCP (https://www.humanconnectome.org/).
AUTHOR CONTRIBUTIONS
B.Z., HT.Z., J.L.S., and S.M.S. designed the study. B.Z., TF.L., Y.Y., D.X., X.W., Z.Z., TY. L, Z.W., and Z.F. analyzed the data. TF. L., Z.Z., and Y.S. downloaded the datasets, processed fMRI data, and undertook quantity controls. Y.L. and HP.Z. provided feedback on study design and results interpretation. B.Z. wrote the manuscript with feedback from all authors.
CORRESPINDENCE AND REQUESTS FOR MATERIALS
should be addressed to HT.Z.
COMPETETING FINANCIAL INTERESTS
The authors declare no competing financial interests.
METHODS
Imaging datasets
We used resting and task fMRI data from the UKB and HCP studies. The UKB study had obtained ethics approval from the North West Multicentre Research Ethics Committee (approval number: 11/NW/0382). All experimental procedures in the HCP study were approved by the institutional review boards at Washington University (approval number: 201204036). The image acquisition and preprocessing procedures were detailed in the Supplementary Note. This study used a parcellation-based approach based on the Glasser360 atlas1. Briefly, for each subject, we projected the resting and task fMRI data onto the Glasser360 atlas and obtained the 360 × 360 functional connectivity matrices. The original Glasser360 atlas is a surface-based parcellation for the cerebral cortex112 and it has been transformed to a volumetric atlas that is compatible with the UKB volume-based data (Supplementary Note). The 360 functional areas were grouped into 12 functional networks45 (Table S1). To aid interpretation, the 360 functional areas were labelled using the automated anatomical labeling atlas113. We mainly studied two sets of fMRI traits: area level traits and network level traits. Area level traits were the 8,531 functional connectivity among all area pairs within each of the 12 networks, which provided fine details on cerebral cortex functional organizations and enabled the comparison between intrinsic and extrinsic functional architectures. Network level traits were expected to aggregate area level interactions within and between networks. To ensure high robustness and generalizability, we only input functional connectivity with high reproducibility and extracted these low-rank traits via a combined PCA and ICA dimension reduction approach in a training-validation design32. Additionally, we considered the mean amplitude of each network, which was a measure of brain activity114. Together, there were 1,985 network level traits, 1,066 of which were from resting fMRI and 919 from task fMRI. Detailed steps of our parcellation-based dimension reduction procedure can be found in the Supplementary Note. We removed values greater than five times the median absolute deviation from the median for each continuous phenotype or covariate variable. We analyzed the following datasets separately: 1) the white British discovery GWAS, which used data of individuals of white British ancestry115 in UKB phases 1 to 3 data (n = 34,641 for resting and 32,144 for task, released up through 2020); 2) European validation GWAS: UKB white but Non-British individuals in phases 1 to 3 data and all White individuals in newly released UKB phase 4 data (UKBW, n = 4,882 for resting and 4,023 for task); 3) two non-European UKB validation GWAS: UKB Asian (UKBA, n = 469 for resting and 368 for task) and UKB Black (UKBBL, n = 261 for resting and 191 for task); and 4) the UKB first revisit data (n = 1,491 for resting and 1,362 for task). The average age (at imaging) of all subjects was 64.16 (standard error = 7.73), 51.6% were females. The assignment of ancestry in UKB was based on self-reported ethnicity (Data-Field 21000), which was verified in Bycroft, et al. 115.
Heritability and GWAS analysis
We downloaded the imputed data from UKB data resources. We performed the following quality controls on subjects with both imaging and genetics data: 1) excluded subjects with more than 10% missing genotypes; 2) excluded variants with minor allele frequency less than 0.01; 3) excluded variants with missing genotype rate larger than 10%; 4) excluded variants that failed the Hardy-Weinberg test at 1 × 10⁻⁷ level; and 5) removed variants with imputation INFO score less than 0.8. SNP heritability was estimated by GCTA47 using all autosomal SNPs in the white British discovery GWAS. We adjusted the effects of age (at imaging), age-squared, sex, age-sex interaction, age-squared-sex interaction, imaging site, the top 40 genetic principal components (PCs), as well as the head motion, head motion-squared, brain position, brain position-squared, and volumetric scaling. Genome-wide association analysis was performed in linear mixed effect model using fastGWA116, while adjusting the same set of covariates as in GCTA. GWAS were also separately performed via Plink117 in validation datasets, where we adjusted for top ten genetic PCs instead of top 40. For area level traits. the independent lead variants were clumped by Plink (--clump-r2 0.1 -- clump-kb 250). The genomic loci associated with network level traits were defined using FUMA95 (version 1.3.5e). To define the LD boundaries, FUMA identified independent significant variants, which were defined as variants with a P-value smaller than the predefined threshold and were independent of other significant variants (LD r2 < 0.6). FUMA then constructed LD blocks for these independent significant variants by tagging all variants in LD (r2 ≥ 0.6) with at least one independent significant variant and had a MAF ≥ 0.0005. These variants included those from the 1000 Genomes reference panel that may not have been included in the GWAS. Moreover, within these significant variants, independent lead variants were identified as those that were independent from each other (LD r2 < 0.1). If LD blocks of independent significant variants were close (<250 kb based on the closest boundary variants of LD blocks), they were merged into a single genomic locus. Thus, each genomic locus could contain multiple significant variants and lead variants. Independent significant variants and all the variants in LD with them (r2 ≥ 0.6) were searched on the NHGRI-EBI GWAS catalog (version 2019-09-24) to look for previously reported associations (P < 9 × 10⁻⁶) with any traits. We performed association analysis to illustrate association patterns for selected colocalized index variants across all 64,620 functional connectivity in resting and task fMRI. The significance threshold was set to be 3.86 × 10⁻⁷ (0.05/(64,620 × 2)). The same set of covariates used in the above GWAS analysis were adjusted in this analysis. LDSC55 (version 1.0.1) was used to estimate and test genetic correlations. We used the pre-calculated LD scores provided by LDSC, which were computed using 1000 Genomes European data. We used HapMap3118 variants and removed all variants in the major histocompatibility complex (MHC) region.
Gene-level analysis, biological annotation, and prediction
Gene-based association analysis was performed in UKB white British discovery GWAS for 18,796 protein-coding genes using MAGMA91 (version 1.08). Default MAGMA settings were used with zero window size around each gene. We then carried out FUMA functional annotation and mapping analysis, in which variants were annotated with their biological functionality and then were linked to 35,808 candidate genes by a combination of positional, eQTL, and 3D chromatin interaction mappings. Brain-related tissues/cells were selected in all options and the default values were used for all other parameters in FUMA. For the detected genes in MAGMA and FUMA, we performed lookups in the NHGRI-EBI GWAS catalog (version 2020-02-08) to explore their previously reported gene-trait associations. We performed heritability enrichment analysis via partitioned LDSC97. Baseline models were adjusted when estimating and testing the enrichment scores for our brain cell type specific annotations.
We built prediction models for fluid intelligence using both genetic variants and multi-type MRI traits, including 1,066 resting fMRI traits (network level), 919 task fMRI traits, 215 DTI parameters from dMRI46, and 101 regional brain volumes from sMRI65. After removing relatives, we randomly splitting the white British imaging subjects into three independent datasets: training (n = 18,889), validation (n = 6,338), and testing design (n = 6,359). The effect sizes of imaging predictors were estimated from the training data (n = 18,889) and the genetic variants were estimated from all UKB white British subjects except for the ones in validation and testing data (n = 131,166). We removed the effects of age, age-squared, sex, age-sex interaction, age-squared-sex interaction, imaging sites, head motion, brain position, and volumetric scaling on both MRI traits and fluid intelligence. We additional accounted for the top 40 genetic PCs for genetic variants. The genetic effects were trained via fastGWA and were aggregated using polygenic risk scores via PRS-CS102. The MRI traits were modeled using ridge regression via glmnet103 (R version 3.6.0). All model parameters were tuned in the validation data, and we evaluated the prediction performance on the testing data by calculation the correlation between the predicted values and the observed ones.
Code availability
We made use of publicly available software and tools. The codes used in fMRI preprocessing and the parcellation-based network level feature extraction pipeline will be shared on Zenodo.
Data availability
Our GWAS summary statistics will be shared on Zenodo and at BIG-KP https://bigkp.org/. The individual-level data used in the present study can be applied from the UK Biobank (https://www.ukbiobank.ac.uk/) and HCP (https://www.humanconnectome.org/).
ACKNOWLEDGEMENTS
This research was partially supported by U.S. NIH grants MH086633 (HT.Z.) and MH116527 (TF.L. and HP.Z.). We thank the individuals represented in the UK Biobank and HCP studies for their participation and the research teams for their work in collecting, processing and disseminating these datasets for analysis. We thank Doug Crabill for helpful conversations on computing. We would like to thank the University of North Carolina at Chapel Hill and Purdue University and their Research Computing group for providing computational resources and support that have contributed to these research results. We gratefully acknowledge all the studies and databases that made GWAS summary data available. This research has been conducted using the UK Biobank resource (application number 22783), subject to a data transfer agreement. HCP data were provided by the Human Connectome Project, WU-Minn Consortium (Principal Investigators: David Van Essen and Kamil Ugurbil; 1U54MH091657) funded by the 16 NIH Institutes and Centers that support the NIH Blueprint for Neuroscience Research; and by the McDonnell Center for Systems Neuroscience at Washington University.
REFERENCES
- 1.↵
- 2.↵
- 3.↵
- 4.↵
- 5.
- 6.
- 7.
- 8.↵
- 9.↵
- 10.↵
- 11.↵
- 12.↵
- 13.↵
- 14.↵
- 15.
- 16.↵
- 17.↵
- 18.↵
- 19.↵
- 20.↵
- 21.↵
- 22.↵
- 23.↵
- 24.
- 25.
- 26.
- 27.
- 28.
- 29.↵
- 30.↵
- 31.↵
- 32.↵
- 33.
- 34.↵
- 35.↵
- 36.↵
- 37.↵
- 38.↵
- 39.
- 40.↵
- 41.↵
- 42.↵
- 43.↵
- 44.↵
- 45.↵
- 46.↵
- 47.↵
- 48.↵
- 49.↵
- 50.↵
- 51.↵
- 52.↵
- 53.↵
- 54.↵
- 55.↵
- 56.↵
- 57.↵
- 58.↵
- 59.↵
- 60.↵
- 61.↵
- 62.↵
- 63.↵
- 64.↵
- 65.↵
- 66.↵
- 67.↵
- 68.↵
- 69.↵
- 70.↵
- 71.↵
- 72.↵
- 73.↵
- 74.↵
- 75.↵
- 76.↵
- 77.↵
- 78.↵
- 79.↵
- 80.↵
- 81.↵
- 82.↵
- 83.↵
- 84.↵
- 85.↵
- 86.↵
- 87.↵
- 88.↵
- 89.↵
- 90.↵
- 91.↵
- 92.↵
- 93.↵
- 94.↵
- 95.↵
- 96.↵
- 97.↵
- 98.↵
- 99.↵
- 100.
- 101.↵
- 102.↵
- 103.↵
- 104.↵
- 105.
- 106.↵
- 107.
- 108.↵
- 109.↵
- 110.↵
- 111.↵
- 112.↵
- 113.↵
- 114.↵
- 115.↵
- 116.↵
- 117.↵
- 118.↵


