
Abstract
Since March 6, when Colombia confirmed its first case of the coronavirus disease (Covid-19), the country healthcare system, with a limited testing capability, has struggled to monitor and report current cases. At the outbreak of a virus, data on cases is sparse and commonly severe cases, with a higher probability of a fatal resolution, are detected at a higher rate than mild cases. In addition, in an under-sampling situation, the number of total cases is under-estimated leading to a biased case fatality rate estimation, most likely inflating the virus mortality. Real time estimation of case fatality ratio can also be biased downwards by overlooking the delay between symptoms onset to death. In this communication, using reported data from Instituto Nacional de Salud up to December 28, we estimate the case fatality rate for Covid-19 in Colombia and some of its regions and cities adjusting for delay from onset to death. We then apply the method proposed by Russell et al. [1], and use our corrected case fatality rate to estimate the percentage of Covid-19 cases reported in Colombia as 42.95% (95% confidence interval: 42.50–43.41), which corresponds to a total of 3’661,621 estimated Covid-19 cases in the country.
I. INTRODUCTION
Keeping track of active cases in a pandemic is of paramount importance for epidemiological tracking in the early stages of the contagion spread. In more advanced stages of a pandemic where epidemiological routes cannot be constructed, effectively testing the population becomes a challenging task that must thrive to keep under-reporting as low as possible. The accuracy in measuring case incidence and prevalence, as well as mortality rates is decisive for high-quality epidemiological modelling that enables governments to propose and implement public policies to mitigate the impact of the pandemic [2–4].
Throughout the current Covid-19 pandemic, governments have mainly gathered databases of daily positive cases and positive deaths. Due to the finite resources of each country, tests for Covid-19 are performed only on a subset of the total country’s population. Different countries have different strategies to select those subsets. No matter how effective those strategies are, it is expected that some infected people do not ever get tested for Covid-19, and therefore are not reported into the positive Covid-19 cases databases. This phenomenon is known as under-reporting, and its magnitude varies especially in relation with the effectiveness of epidemiological tracing strategies, as well as tests availability [5].
In this work we show how disease cases databases can be used to estimate the magnitude of this under-reporting, thus yielding better-quality figures for case incidence and mortality rates. In particular, we analyse and report data from Colombia to assess its current situation of cumulative positive cases. Unlike seroprevalence studies, the method that we use does not need to perform further tests than the ones already performed, and whose results are contained in the cases databases.
Our method is based on the idea of comparing case fatality ratios (CFRs) between a target country, which in our case is Colombia, and a benchmark country, which in our case is the Republic of Korea. The benchmark country should be one that has a very effective testing strategy. This means that the scientific community is confident in that strategy, which also means that the benchmark country is expected to have low under-reporting. The method answers the question of how many positive cases would be detected in the target country if it were using the testing strategy of the benchmark country? Related to this question, we also explain how to account for differences between the population of the target and the benchmark country.
This paper is divided as follows. Section II lays out the data used for our study, and also details the method to correct CFRs. Section III presents the estimated status of Covid-19 in Colombia. Then section IV compares our results with other studies, and also discusses some limitations of our study. Finally, we conclude in section V.
II. METHODS AND MATERIALS
Since the main objective of our work is to estimate the true number of cumulative positive cases of Covid-19 in Colombia, in this section we explain a method to answer the following question: for an arbitrary geographical region, can we account for under-reporting to estimate the true number of cumulative positive cases?
A. Data
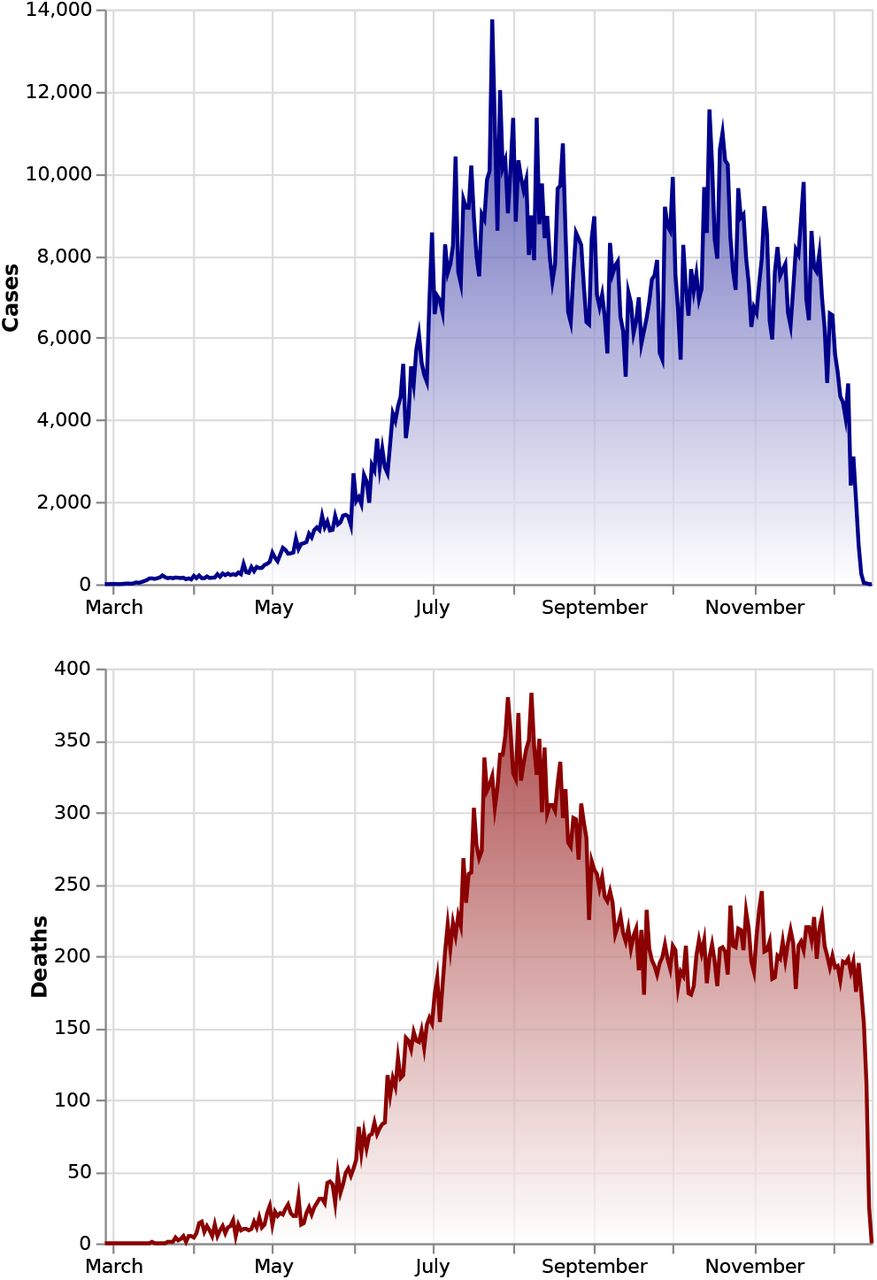
We use two datasets for our analysis. The first one is the data published by the Instituto Nacional de Salud (INS) [6], which is updated every day and reports all known Covid-19 cases in Colombia. For each case it provides its date of notification, location city, state or district, current status (recovered, recovery from home, being treated in an intensive care unit and passed away), age, sex, country of provenance, symptom onset date, date of death, date of diagnosis, date of recovery and the web report date. From this information we derive the case incidence as well as the distribution of days between onset date and date of death for the cases that resulted in death. For this, we need the onset date for every record in the database, and their corresponding dates of death, if the cases resulted in death. We also keep information about age and location of each case. To construct the case incidence time-series (see fig. 1) as well as the onsetto-death distribution we used data up to December 28, 2020.

Covid-19 cases and deaths incidence in Colombia. Up to December 28, 2020 there have been 1’594,497 confirmed cases and 47,175 confirmed deaths. Notice that there is a sudden drop at the latest days because data gathered in the future includes cases with onset and death dates in the past.
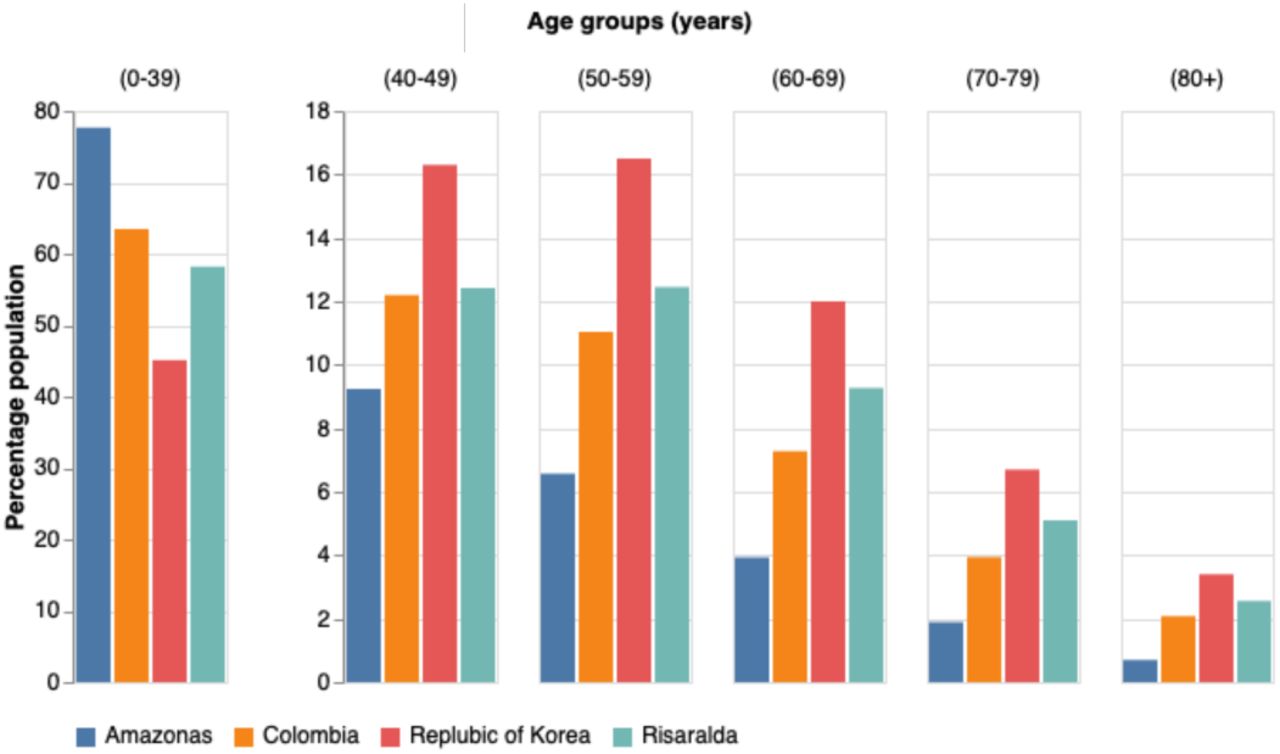
The other dataset is extracted from the demographic database maintained by the Departamento Administrativo Nacional de Estadística (DANE) [7]. We retrieve data containing the most recent projection for the year 2020 of the number of individuals per age group for all regions and cities of Colombia (see fig. 2). This demographic dataset will be needed in order to assess the vulnerability of each region to Covid-19, as it is well documented that death risk strongly depends on age [8–10].

Population demographic comparison between Amazonas (one of the youngest populations in Colombia), Risaralda (one of the oldest populations in Colombia), Colombia and the Republic of Korea.
B. Delay adjusted case fatality rate estimate
Dividing deaths-to-date by cases-to-death to compute the CFR (which we call from now on a naïve determination of the CFR, or nCFR) tends to yield a biased result, usually underestimating its true value [11, 12]. This happens because the outcome of active cases (i.e. recovery or death) is not known. An improved calculation of the CFR can be done by accounting for the delay from onset-to-death to estimate the number of cases expected to have a known outcome.
1. Evaluating the delay time distribution between onset-to-death
We used the reported dates to calculate the time interval from illness onset to death of the confirmed 29,480 cases that resolved in death from March 16 to September 19 2020. The totality of cases in this period were already resolved (i.e. recovered or dead). We fit the conditional probability density f (t) of the time between onset-to-death given death to Weibull, gamma, and log-normal distributions (as in the studies by Linton et al. [13], Verity et al. [14]). In all cases we use the maximum likelihood estimation (MLE) to determine the parameters and obtain credible intervals using PyMC3 [15]. Furthermore, we include a gaussian kernel density estimation (KDE) to fit the data more tightly. We select the best fit model by using the Akaike information criterion (AIC). Table I shows estimates for the three models plus the KDE. Although the lognormal distribution provided the best fit to data, we decided to use a gaussian KDE to approximate the onset-to-death distribution, as it is shown in fig. 3, because the lognormal fit was found to be largely inaccurate at the peak of the distribution (not shown). The mean time from illness onset to death given by the lognormal distribution was 22.8 days (95% CI: 22.5, 23.1), whereas with the KDE’s was 22.4 days. As a comparison, Verity et al. [14] obtained a mean time of 18.8 days (95% CI: 15.7, 49.7), and Linton et al. [13] found a mean time of 15.0 days (95% CI: 12.8, 17.5).
Illness onset to death time-delay distribution for Covid-19 outbreak in Colombia.

Probability density distribution of the time from illness onset to death. The gamma distribution has mean delay of 22.4 days and standard deviation of 12.7 days.
2. Adjusted case fatality ratio
The CFR is adjusted following the method proposed by Nishiura et al. [11]. We estimate the proportion of cases resolved using the case and death incidence to adjust the CFR to account for delay outcome (cCFR). The underestimation factor [1, 11, 12, 16, 17],
 scales the cumulative number of cases in the denominator of the cCFR, and accounts for the adjustment. Here ct is the daily case incidence (see top panel of fig. 1) at time t and ft = f (t) is the conditional probability density of the delay-time from onset-to-death (see fig. 3).
For Covid-19 the severity of the infection is highly correlated to the age of the infected individual [14], hence, for each region or city, we evaluate age-stratified estimates of the adjusted case fatality rate, cCFRri, where r stands for the region and i labels the age group. The age aggregated cCFR for a region is adjusted for the population demographics, and is given by
 Here, pri is the fraction of the population with age i for the region r.
C. Percentage of cases reported
The adjusted cCFR does not account for underreporting. In order to obtain an estimate of the potential level of under-reporting in Colombia and its regions our model follows the simple method proposed by Russell et al. [1] further adjusting for the country demography. We assume a baseline CFR (blCFR), taken from a benchmark country, and compare it with the estimated cCFR for Colombia and some of its regions and cities. We do an age-stratified analysis. If the cCFRri is higher than blCFRi, it indicates that only a portion of the real number of cases in this age group have been reported so far. The fraction of reported cases in region r and age group i is given by
 We also evaluate the fraction of cases reported in a region aggregated over age Rr. For this, we introduce the region baseline CFR,
 which accounts for the region population demographics through
  , and obtain
 The most recent literature offers several estimates CFR for Covid-19. Among those adjusting or controlling for under-reporting, we mention those by Verity et al. [14], Russell et al. [16], Shim et al. [17], Guan et al. [18]. In our analysis, we use as benchmark country the Republic of Korea. As baseline we use for this work the age stratified CFR data of July 14, 2020 [19], listed in Table II, since most of the cases from the first peak had already been resolved by this date.
Covid-19 case fatality rates stratified by age groups as of July 14, 2020 in the Republic of Korea.
III. RESULTS
In our analysis we consider all regions and cities in Colombia that have reported at least 40 fatal Covid-19 cases as of December 28, 2020. Table III shows the percentage of cases reported, the cCFR, blCFR and the total cases and deaths for all regions of Colombia. Note that the value of the blCFR fluctuates from region to region, evidencing the differences in population demographics between regions. For regions and cities with a younger population than the average of the country, the blCFR is lower compared to the value for the country. On the contrary, in those regions or cities in which the fraction of the population with age above 60 years is more significant, the blCFR is higher than the value for the country. As an example, consider fig. 2 where the age distribution of Amazonas, the region with the youngest population, is compared to the age distribution of Risaralda, the region with the oldest population. The corresponding blCFRs mirror the demographics, with Amazonas’ blCFR being 0.5% and Risaralda’s being 1.4%.
Percentage of Covid-19 cases reported in Colombia and its regions until December 28, 2020 with 95% confidence intervals. The corrected and baseline CFRs are also shown, along with the total number of positive cases and deaths to date.
We also present age-stratified reporting percentages for all the regions in Colombia (with at least 40 fatal Covid-19 cases) in table IV. A trend is notable: reporting percentage is much higher for the elder population, whereas it is quite low for the young population. We hypothesise that young people do not get tested as much as old people because if symptomatic, they only develop mild symptoms in most cases [10, 20]. This is an important source of uncertainty on the estimation of the virus propagation because young people are relevant vectors because of mobility reasons, especially in cities [21, 22].
Age-stratified percentage of Covid-19 cases reported in Colombia until December 28, 2020. For the country and its regions the age-stratified percentage of reported cases are shown with a 95% confidence interval.
Furthermore, the framework so far exposed can be used to evaluate reporting percentages and estimations of cCFRs in the past by truncating the datasets. However, there is a detail that has to be handled carefully. Notice that when we compute the cCFR, we are using the number of death people reported up to today, and we are using the case incidence curve reported up to today. This means that we are in the best state of knowledge that we can about today. However, tomorrow, we will have a state of knowledge about today better than the one we have today. This is because tomorrow there will be some cases with onset symptoms dates from today and from previous days. Similarly, tomorrow there will be reported cases of people that died today or in previous days. Therefore, we need to truncate the datasets based on the report day only. Thus, if we truncate the database a month ago, we ensure that we are reproducing the state of knowledge that we had one month ago.
The evolution of reporting percentage confidence intervals are shown in fig. 4. Qualitatively, almost all regions start with wide confidence intervals, and they become narrow as more people are reported positive or dead because of Covid-19. Also, in most regions the reporting percentage raises as time passes by. An important feature is that in some of the most inhabited regions, there are drops on the reporting percentage about July-August. This coincides with the peak of positive cases reported in Colombia. Even though the number of tests also incremented on those dates, they did not match the rate at which new cases and more importantly, new deaths rose.

95% confidence interval of the evolution of age-aggregated percentage of reported cases in regions of Colombia with more than 40 confirmed deaths.
These plots can also be useful to evaluate different public policies being carried out at each region. For instance, Boyacá closed their borders early on in the pandemic [23]. Later, they opened the borders, and naturally, the number of cases grew. The peak is found to be at the end of October and beginning of November. Nonetheless, despite a pronounced peak, the number of tests was enough to maintain the same reporting percentage over the course of those months, as seen in fig. 4. Another interesting case is Amazonas, the largest state in Colombia by area. It hit the headlines several times because it had the largest number of deaths per inhabitant at the start of the pandemic (around May) [24]. As a consequence, the government performed many tests (with respect to other states), making Amazonas the state with more performed tests per inhabitant. Despite this special attention that the state got, its reporting percentage is well below the average of Colombia.
IV. DISCUSSION
An important point has to be remarked on the validity of our results. We saw that we corrected the CFR for today with the information that we possess today. In the future we will have more information about today, and a better correction of the CFR for today can be estimated. To account for this lag of information we would need to predict how many cases will be reported in future days. To perform this prediction, we need to use information about how many people have been infected so far. And calculating how many people have been infected so far needs the prediction of new cases. Thus, this becomes an auto-consistent problem which falls beyond the scope of this work. Nonetheless, the further correction that can be achieved by solving this auto-consistent problem can be important, especially in the early stages of the pandemic. For instance, a simple prediction of new cases done by linear regression on the case incidence time-series can yield statistically significant differences in the reporting percentage that we estimate (not shown). More accurate predictions done by fitting epidemiological models can improve the accuracy of our last statement.
A. Our study compared to others
Comparing our results with the extant literature, we find that it is qualitatively consistent (in the case of the complete country of Colombia) with the study by Russell et al. [1]. They find a peak in the reporting percentage around May-June, but we find it centered in June (c.f. fig. 4). This can be due to different onset-to-death distributions taken into account: ours is deduced from a distribution built taking into account the onset-to-death, whereas theirs is a generalisation of a hospitalisation-todeath distribution from Wuhan. Then, the reporting percentage starts to grow in their study and ours. Furthermore, previous to May, we find an increase in the error, whereas their study still finds low error in the estimation of the reporting percentage. However, the magnitude of the estimation error rapidly decreases as more deaths are recorded. Furthermore, since our analysis includes the demographics of Colombia and its regions, this allows to identify their vulnerability. On average, Colombia has a younger population than the population from China [18], which is why our baseline CFR is lower than Russell’s, which is 1.4%. This explains why the range of reporting percentages is lower in our study than in theirs, where reporting percentages reach 50% in August.
Another important resource when trying to estimate the true number of infected Covid-19 cases in Colombia and its regions is a seroprevalence study. In Colombia, some seroprevalence studies were recently published. In table V we show the results for some Colombian cities. By dividing the reported number of deaths by an estimate of the cases given by the seroprevalence studies, we computed the corresponding nCFR for each city. We also added the results of seroprevalence studies for two of the most affected zones in Europe and the New York State. We see a high seroprevalence and low values of nCFR in all of Colombia regions. On the other hand, European zones show an opposite situation. In the case of New York, the study was done just before the days with a high number of daily deaths (29 March), which is why the nCFR is very low. Rosenberg et al. [25] mentioned that if they considered an average of 19 days between onset-to-death as an average, the nCFR would be 0.6 %, which still doubles the nCFR found in Colombia. As a conclusion, the nCFR of Colombia deduced by seroprevalence studies in all its regions is smaller than in other countries. We hypothesise that this could be due to the age-distribution of the countries: Colombia’s population is younger than USA’s, Spain’s and Italy’s.
nCFR of some cities in Colombia, as well as in the Lombardy region, Comunidad de Madrid, and New York State for comparison. The nCFR is computed using seroprevalence studies in those regions.
Also, Colombian seroprevalence studies are preliminary and the methodology details is not publish yet. Therefore, we do not know the possible biases. Particularly, the Montería study [26] has a possible bias because tested people were chosen randomly in different neighbourhoods and it is known that cities have intrinsically heterogeneous mobility patterns [21], thus making any uniform random samples problematic [27, 28].
B. Limitations
Our study makes some assumptions that directly impact the results, therefore, the figures given in this work have to consider the following limitations:
We do not account for comorbidities of the population which can influence the vulnerability (i.e. the baseline CFR) of a country or a region. The main comorbidities correlated with Covid-19 deaths are cerebrovascular disease, high-blood pressure, chronic obstructive pulmonar diseases, diabetes, among others [32].
Also, we ignore the burden of the healthcare system among other regional and socio-economical factors that might influence the capacity of a country or a region to attend all important Covid-19 cases.
Our results are liked and biased by the baseline CFR, which come from measured nCFRs from the Republic of Korea. An important effect is that reporting percentage (and therefore the estimation of seroprevalence) can change a lot for small errors in the estimation of the baseline CFR.
Our results ignore deaths under-counting. In fact, as we discussed by comparing our results to seroprevalence studies in Colombia, it seems that nCFRs are too low when compared with many other seroprevalence studies. Since it is expected that mortality is higher, it is a possibility that there is a strong death under-counting in Colombia.
We do not take into account different strains of Covid-19 and the different CFRs for each type [33, 34].
V. CONCLUSIONS
In the present study we accounted for the delay between symptom’s onset and death caused by the Covid-19 disease in order to estimate its case fatality ratio in Colombia and its regions. This estimation allows us to calculate the total number of infected people so far in Colombia and its regions, thus creating a clear picture of the magnitude of the pandemic in this country. In particular, we estimate that there have been a total number of 3’661,621 infected people in Colombia, in contrast with the confirmed 1’594,497, as of December 28, 2020. Moreover, the following are the states with the largest underreporting in Colombia: Amazonas, Magdalena, Norte de Santander and Putumayo. Furthermore, the capital city of Colombia, Bogotá, presents a reporting percentage close to 48%.
A remarkable feature of the method to estimate CFRs in Colombia and its regions was the inclusion of demographics, as Covid-19 has proven to have different mortalities for populations with different ages. Therefore, we saw that older populations were more vulnerable than younger ones. Indeed, our corrected CFRs have a correlation of 0.51 with the baseline CFRs, which account for regions demographics, indicating that younger (older) populations are expected to have lower (higher) mortalities.
Another phenomenon linked with age distributions is that the reporting percentage is much lower in the young population, whereas the old population presents large reporting percentage. We hypothesise that this happens because young people usually have low to mild symptoms, and most of the time they do not require to go to the hospital, and prefer not to take a Covid-19 test. This behaviour is seen in every single region of Colombia.
Finally, we also compared our results to seroprevalence studies from Colombia. Although most of those studies have only released preliminary results, they all indicate mortalities much lower than those reported in Europe and the United States of America. Also, compared to our results, the seroprevalence studies in Colombia show lower estimates of mortality, and thus, estimate more true cases of Covid-19 in the country than we do.
VI. DATA AVAILABILITY
We developed a Python library that eases the extraction, load and transformation of raw data from the INS database. The code is freely available at https://gitlab.com/hubrain/covid19. Also, we designed a dashboard were we keep a daily record of how reporting percentages are changing at each region which can be found at http://covid19.hubrain.co. Furthermore, the code to reproduce the figures and tables here presented is in https://gitlab.com/hubrain/covid19-paper.
Data Availability
We developed a Python library that eases the extraction, load and transformation of raw data from the INS database. The code is freely available at https://gitlab.com/hubrain/covid19. Also, we designed a dashboard were we keep a daily record of how reporting percentages are changing at each region which can be found at http://covid19.hubrain.co. Furthermore, the code to reproduce the figures and tables here presented is in https://gitlab.com/hubrain/covid19-paper.
Footnotes
↵* clviviescasr{at}unal.edu.co
References


