
Abstract
Purpose Determining the triggering factor of the sudden boost of the daily new COVID-19 cases arising in most European countries during 2020 Autumn.
Methods The dates of the boost were determined using a fitting of the two last months reported daily new cases in 18 European countries of latitude ranging from 39° to 62°.
Results The study proves no correlation between the country boost date and its 2 weeks preceding temperature, but shows an impressive linear correlation with its latitude. The country boost date corresponds to the time when its sun UV daily dose drops below ≈30% of that of 0° latitude.
Conclusions The previous studies, reporting a vitamin D blood level impact, compared COVID-19 severity between different patients populations and so can hardly discriminate whether the vitamin D blood level is a real factor of covid-19 severity or only a marker of another weakness being the primary severity factor. In contrary, the date of the boost is an intrapopulation observation and can thus only be triggered by a parameter globally affecting the population, i.e. the sun UV daily dose decreases. This result evidences that low vitamin blood D level is a contributing factor of COVID-19 severity.
Introduction
Most European countries underwent in autumn an unexpected boost of the daily new COVID-19 cases (Fig. 1), imposing in emergency new confinement rules and lockdowns.
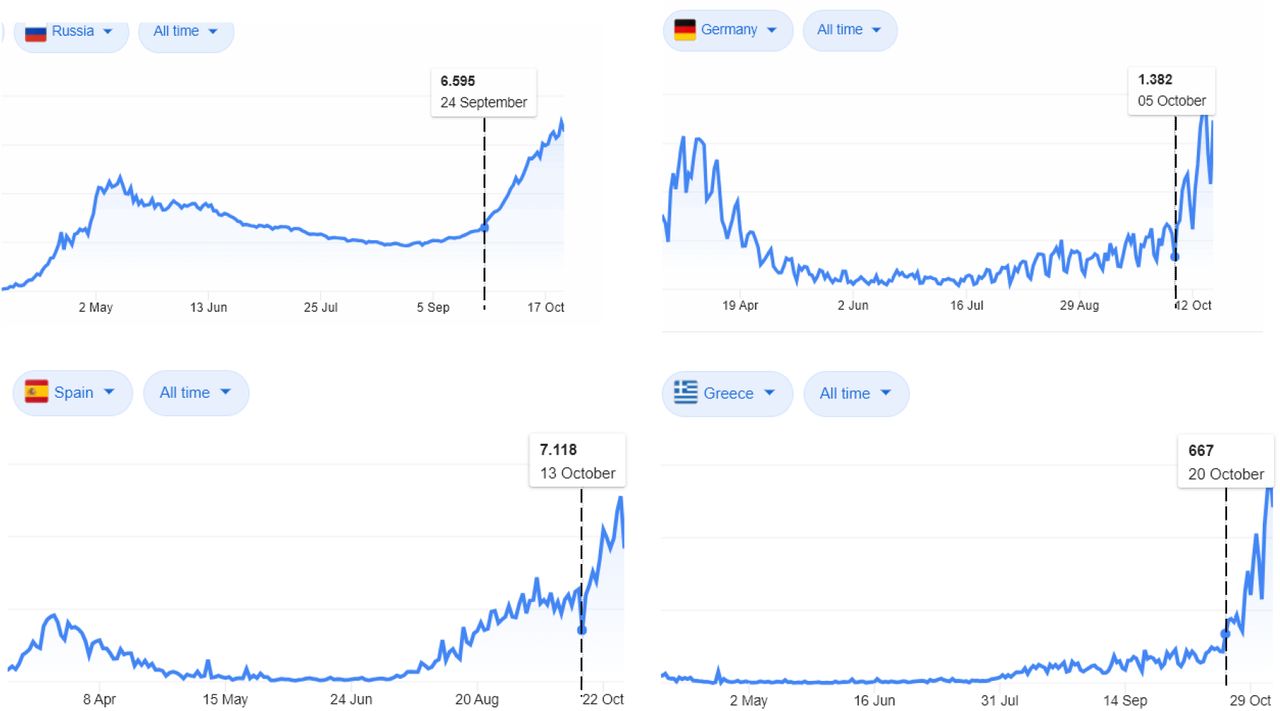
Typical examples of daily new COVID-19 cases (extracted from the Google home page when searching “covid”). All curves exhibit a clear boost of the growing rates.
A common reported explanation is the decreasing temperature. The aim of this study is to challenge this assumption against a pure latitude impact.
Material and method
Data sources
The countries daily new COVID-19 cases were obtained by digitalizing the curves from the Johns Hopkins coronavirus resource center (https://coronavirus.jhu.edu/map.html).
The country population weighted center (PWC) latitudes were obtained from the Baylor University population resource (http://cs.ecs.baylor.edu/~hamerly/software/europe_population_weighted_centers.txt)
The averaged 2 weeks temperatures preceding the boost dates were derived from weather.com.
The theoretical sun UV daily dose for vitamin D production, as a function of latitude and of the day of the year, was derived from [1].
Boost date determination
The date of the boost was automatically determined by fitting the two last months of the daily new COVID-19 cases with:
 where l is the logistic function:
 tc is considered as the boost date of the country c, i.e. the date when the exponential coefficient, coming from the initial value αc, crosses the value
  before tending towards βc when t → ∞. γ is the steepness of this changing. γ was assumed country independent as we search for an impact of the latitude of its own. This further allows to prevent an over-fitting of the data noise by a steepness tuned for each country.
Note that as the exponential coefficient varies with time, the doubling time around the boost date is not simply ln(2) divided by this coefficient.
Results
Table 1 shows the fitting results (data and fitting process are provided in the supplementary xlsx file).
Temp: mean country temperature during the 2 weeks preceding its COVID-19 boost date. PWC lat: latitude of the country PWC. Sun UV: theoretical sun UV daily dose at the boost date, expressed as a fraction at the PWC latitude versus the latitude 0°.
Fig. 2A clearly proves no correlation with temperatures, while fig. 2B clearly shows an impact of the country latitude.
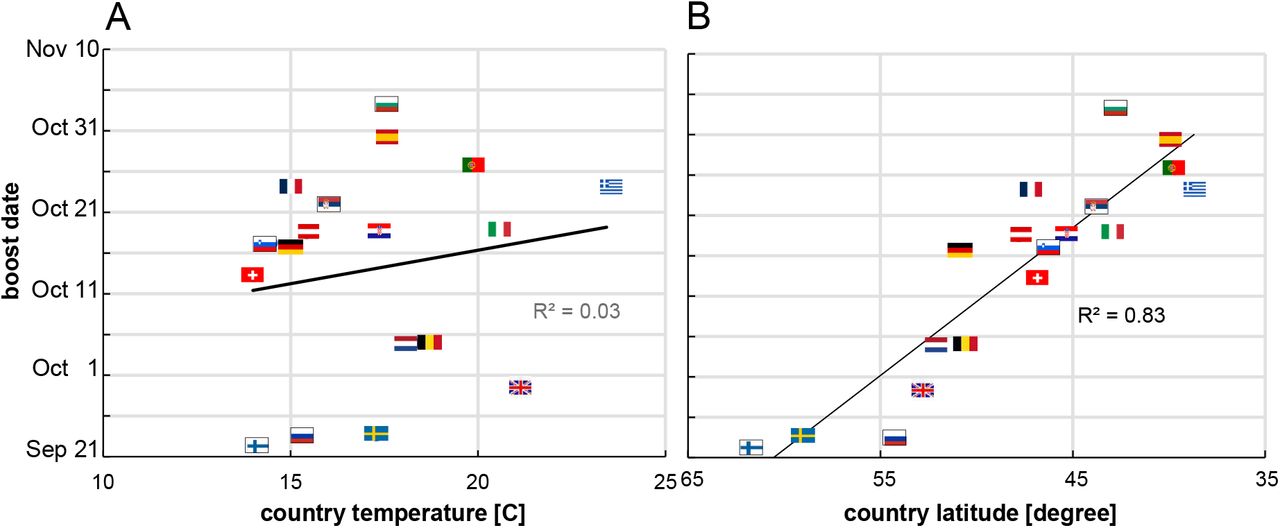
COVID-19 boost date as a function of the country mean temperature during the 2 preceding weeks (A), and as a function of the country PWC latitude (B) pointing vitamin D as one of the primary factor (flags link country between graphs).
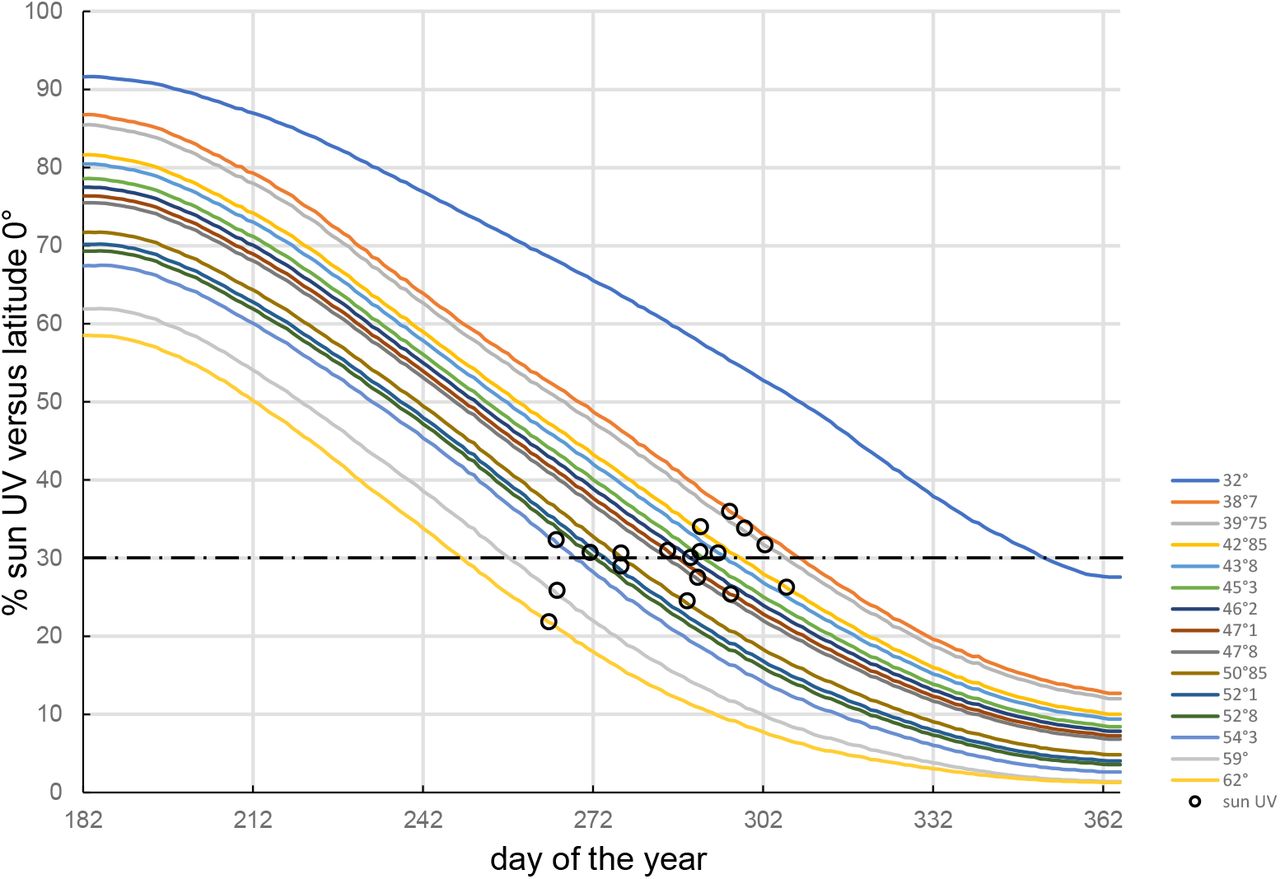
Fig. 3 clearly shows that the boost dates set on the sun UV daily dose as a function of the latitude evidences an impact of the sun UV daily dose.

Solid curves: theoretical sun UV daily dose for vitamin D skin production under a clear sky corresponding to the 18 PWC country latitudes plus the 31° latitude (derived from [1]). Black circles: country boost dates positioned on their corresponding latitude curve. Black dot-dash line corresponds to the averaged countries sun UV daily doses at their boost date.
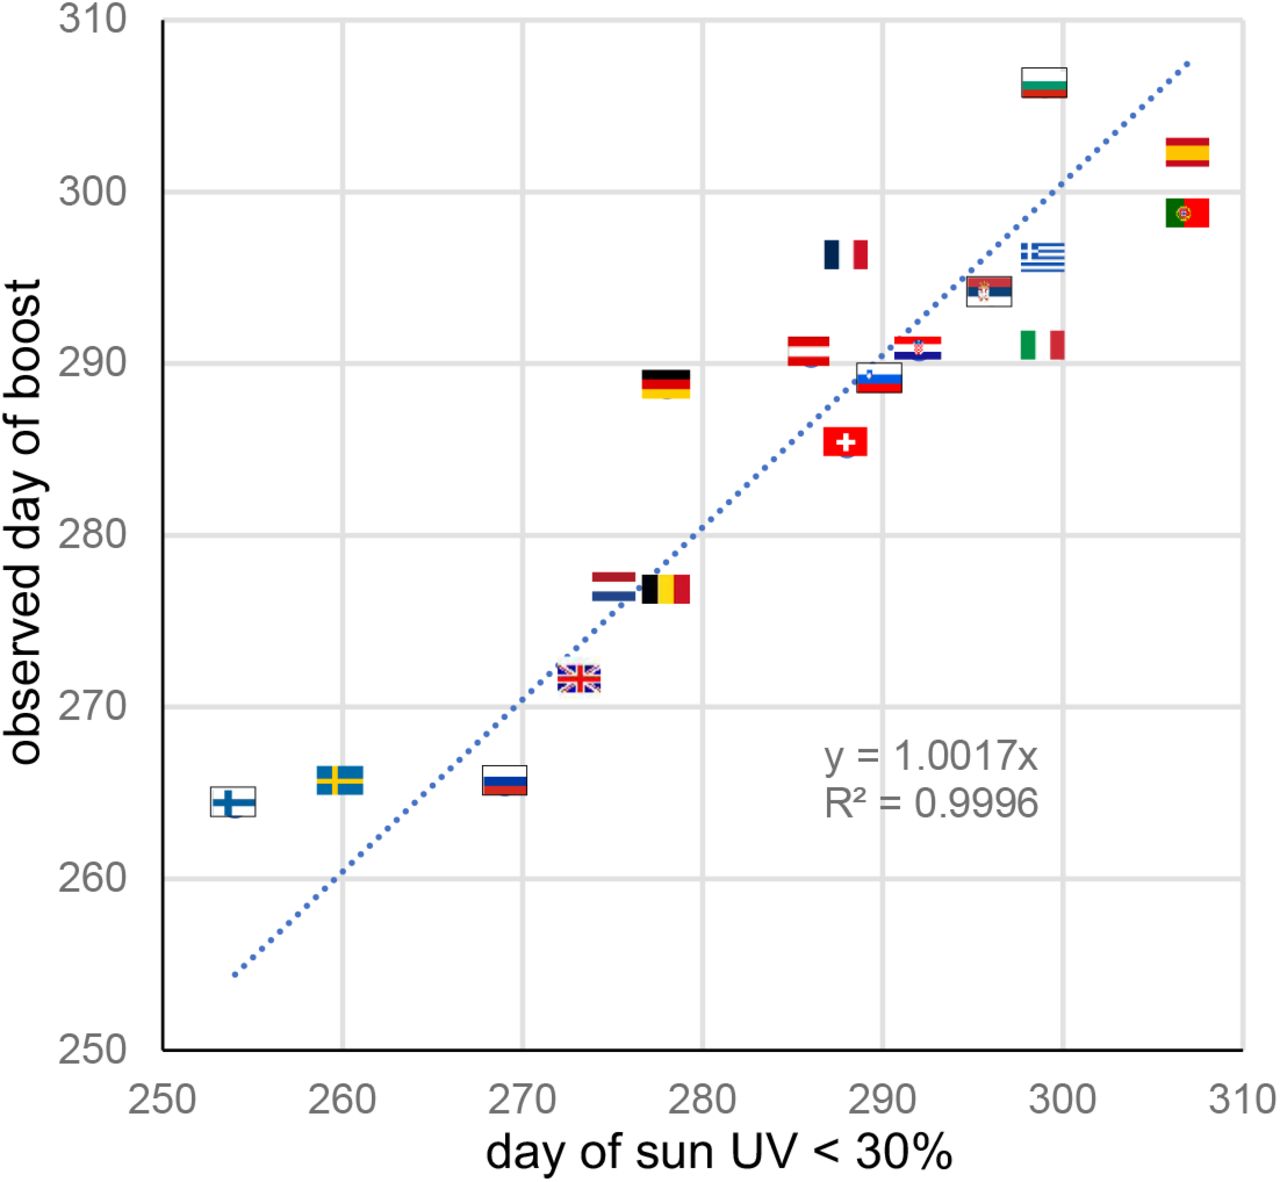
Fig. 4 shows that the day of the second wave boost is well predicted by the time when the sun UV daily dose of the country becomes lower than 30% of that at latitude 0°.
observed day of the second wave covid-19 boost as a function of the day when the country sun UV daily dose drops lower than 30% of that at latitude 0°. Trendline forced to intercept (0,0).
Discussion
Many studies support an impact of low vitamin D blood level on the respiratory impairment in coronavirus or virus diseases [2], and also recently for the COVID-19 pandemic [3]. Low vitamin D blood level is also more prevalent in populations at risk: i.e. aged people [4], obese patients [5], coloured skin people living in high latitude countries [6] and diabetic patients [7].
However by comparing the covid-19 severity between different populations, these studies can hardly discriminate whether the vitamin D blood level is a real factor of covid-19 severity or only a marker of another weakness being the primary severity factor.
In contrary, the date of the boost is an intrapopulation observation and can only be triggered by a parameter globally affecting this population. As there is no temperature correlation, but an impressive latitude correlation (fig. 2), the remaining common parameter affecting these populations at different times linearly depending on the latitude is the sun UV daily dose (fig. 4).
The present study supports thus that lower vitamin D blood level is a contributing factor of COVID-19 severity. By increasing the coronavirus load in the respiratory track, the contagiousness in the population is also increased, starting a chain reaction which explains the wave boost.
The results are also in line with the low population mortality observed within ±35° latitudes [8] and reported in Hubei located on the 31° latitude, regarding that these regions are most of the year above the sun UV daily dose 30% threshold (fig. 3: black dot-dash line).
Conclusion
The present study evidences that lower vitamin D blood level should be considered as a contributing factor of covid-19 severity.
Europe, and north USA as well, are starting this autumn a long covid-19 crisis as they will get back above the October sun UV daily dose only end 2021 March.
The bet to reduce the pandemic severity during the coming winter using controlled preventive vitamin D supplementation should be considered [10,11].
Data Availability
all data referred in the paper come from open database
Footnotes
Sweden data added Figure 3 and discussion section improved New figure 4 Primary role of vitamin D evidenced Excel data added as supplementary material Improved excel file with explanations


